Zip Codes with the Highest Percentage of Population Employed in Arts, Entertainment & Recreation in Denison, TX
RELATED REPORTS & OPTIONS
Arts, Entertainment & Recreation
Denison
Compare Zip Codes
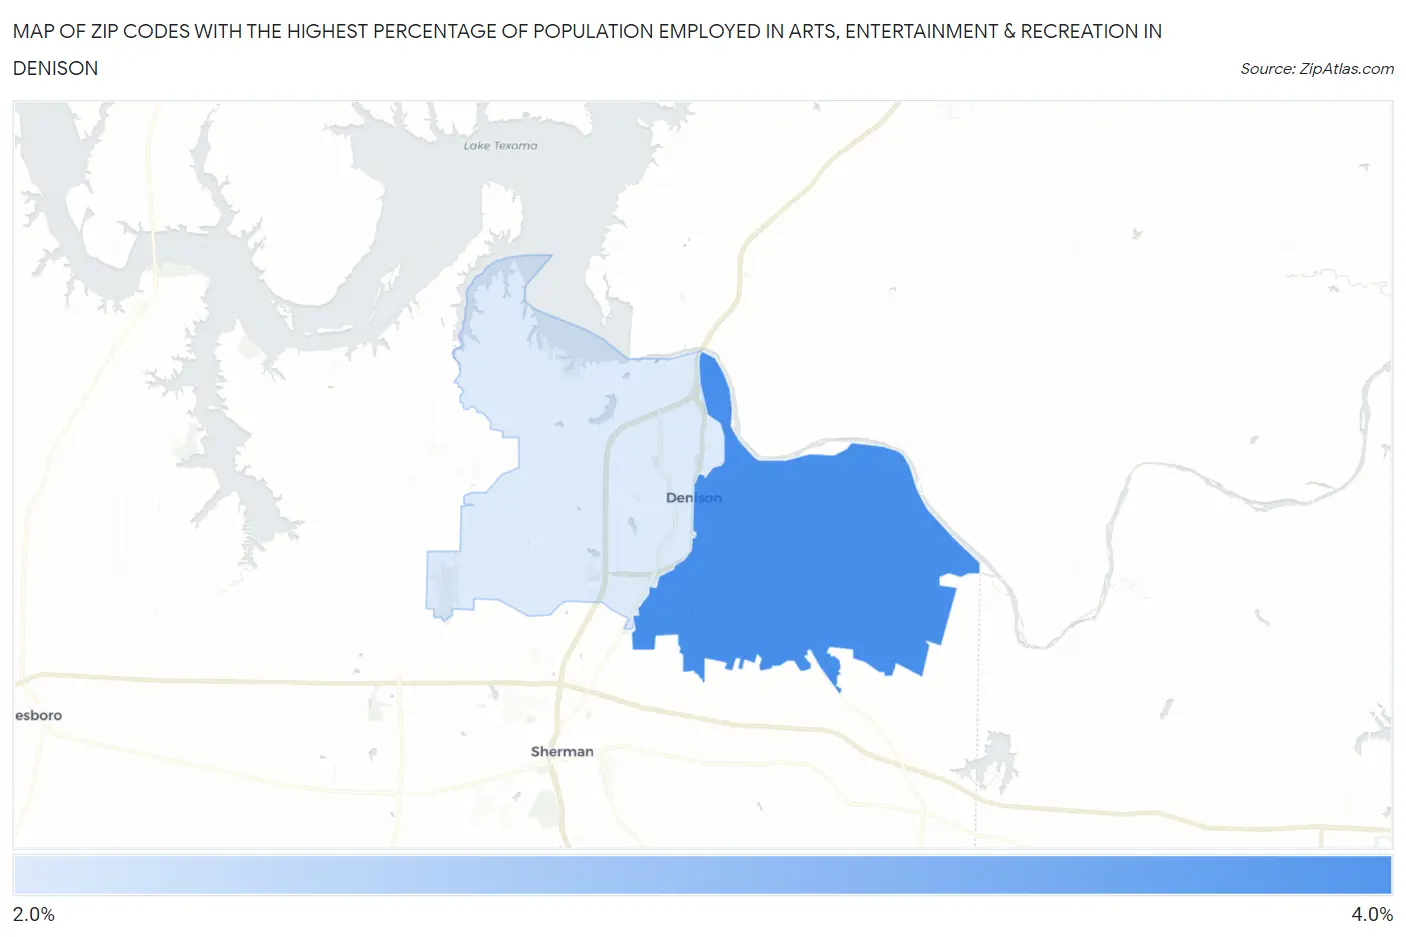
Map of Zip Codes with the Highest Percentage of Population Employed in Arts, Entertainment & Recreation in Denison
2.9%
3.3%
Zip Codes with the Highest Percentage of Population Employed in Arts, Entertainment & Recreation in Denison, TX
| Zip Code | % Employed | vs State | vs National | |
| 1. | 75021 | 3.3% | 1.5%(+1.85)#109 | 2.1%(+1.23)#4,539 |
| 2. | 75020 | 2.9% | 1.5%(+1.45)#154 | 2.1%(+0.825)#5,625 |
1
Common Questions
What are the Top Zip Codes with the Highest Percentage of Population Employed in Arts, Entertainment & Recreation in Denison, TX?
Top Zip Codes with the Highest Percentage of Population Employed in Arts, Entertainment & Recreation in Denison, TX are:
What zip code has the Highest Percentage of Population Employed in Arts, Entertainment & Recreation in Denison, TX?
75021 has the Highest Percentage of Population Employed in Arts, Entertainment & Recreation in Denison, TX with 3.3%.
What is the Percentage of Population Employed in Arts, Entertainment & Recreation in Denison, TX?
Percentage of Population Employed in Arts, Entertainment & Recreation in Denison is 3.3%.
What is the Percentage of Population Employed in Arts, Entertainment & Recreation in Texas?
Percentage of Population Employed in Arts, Entertainment & Recreation in Texas is 1.5%.
What is the Percentage of Population Employed in Arts, Entertainment & Recreation in the United States?
Percentage of Population Employed in Arts, Entertainment & Recreation in the United States is 2.1%.