Zip Codes with the Highest Percentage of Population with a Degree in Arts and Humanities in Cordova, TN
RELATED REPORTS & OPTIONS
Arts and Humanities
Cordova
Compare Zip Codes
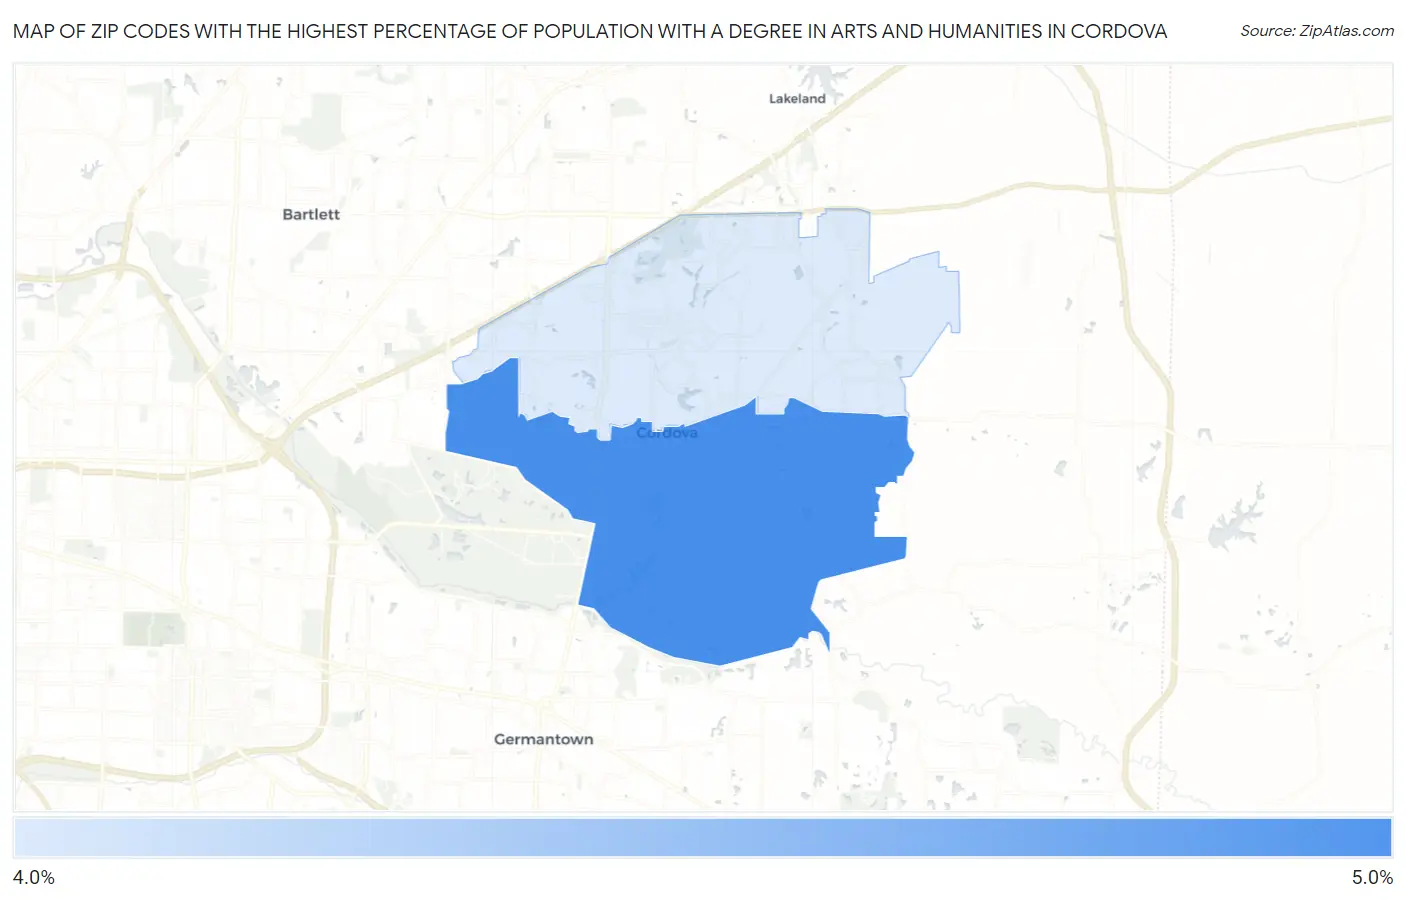
Map of Zip Codes with the Highest Percentage of Population with a Degree in Arts and Humanities in Cordova
4.3%
4.8%
Zip Codes with the Highest Percentage of Population with a Degree in Arts and Humanities in Cordova, TN
| Zip Code | % Graduates | vs State | vs National | |
| 1. | 38018 | 4.8% | 7.0%(-2.20)#386 | 6.0%(-1.22)#18,231 |
| 2. | 38016 | 4.3% | 7.0%(-2.68)#411 | 6.0%(-1.69)#19,540 |
1
Common Questions
What are the Top Zip Codes with the Highest Percentage of Population with a Degree in Arts and Humanities in Cordova, TN?
Top Zip Codes with the Highest Percentage of Population with a Degree in Arts and Humanities in Cordova, TN are:
What zip code has the Highest Percentage of Population with a Degree in Arts and Humanities in Cordova, TN?
38018 has the Highest Percentage of Population with a Degree in Arts and Humanities in Cordova, TN with 4.8%.
What is the Percentage of Population with a Degree in Arts and Humanities in Tennessee?
Percentage of Population with a Degree in Arts and Humanities in Tennessee is 7.0%.
What is the Percentage of Population with a Degree in Arts and Humanities in the United States?
Percentage of Population with a Degree in Arts and Humanities in the United States is 6.0%.