Zip Codes with the Highest Percentage of Population Employed in Arts, Entertainment & Recreation in Cordova, TN
RELATED REPORTS & OPTIONS
Arts, Entertainment & Recreation
Cordova
Compare Zip Codes
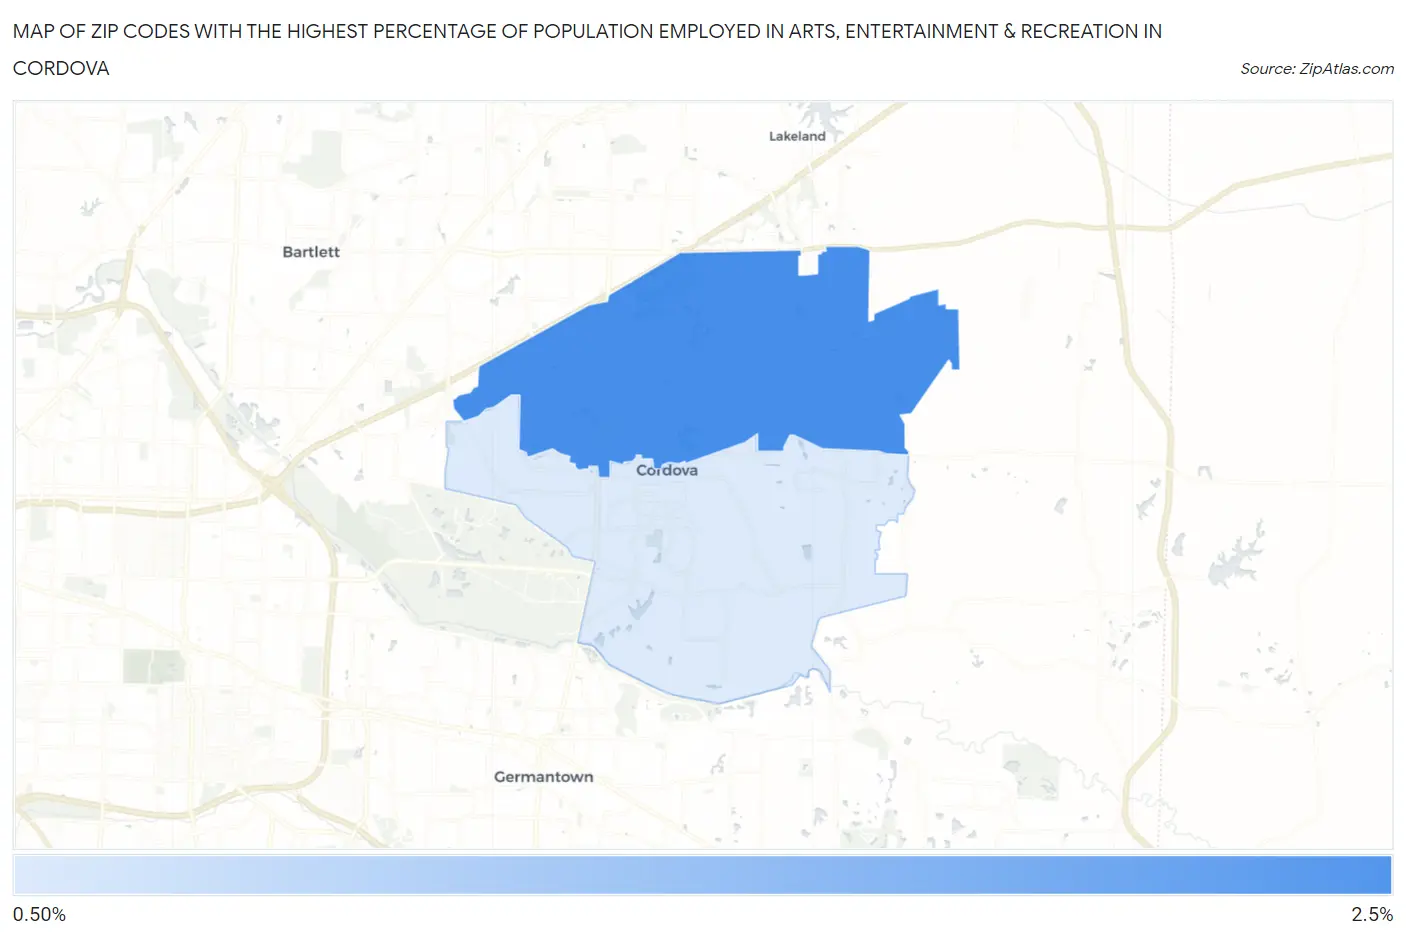
Map of Zip Codes with the Highest Percentage of Population Employed in Arts, Entertainment & Recreation in Cordova
0.56%
2.4%
Zip Codes with the Highest Percentage of Population Employed in Arts, Entertainment & Recreation in Cordova, TN
| Zip Code | % Employed | vs State | vs National | |
| 1. | 38016 | 2.4% | 1.8%(+0.607)#114 | 2.1%(+0.311)#7,669 |
| 2. | 38018 | 0.56% | 1.8%(-1.23)#368 | 2.1%(-1.52)#20,093 |
1
Common Questions
What are the Top Zip Codes with the Highest Percentage of Population Employed in Arts, Entertainment & Recreation in Cordova, TN?
Top Zip Codes with the Highest Percentage of Population Employed in Arts, Entertainment & Recreation in Cordova, TN are:
What zip code has the Highest Percentage of Population Employed in Arts, Entertainment & Recreation in Cordova, TN?
38016 has the Highest Percentage of Population Employed in Arts, Entertainment & Recreation in Cordova, TN with 2.4%.
What is the Percentage of Population Employed in Arts, Entertainment & Recreation in Tennessee?
Percentage of Population Employed in Arts, Entertainment & Recreation in Tennessee is 1.8%.
What is the Percentage of Population Employed in Arts, Entertainment & Recreation in the United States?
Percentage of Population Employed in Arts, Entertainment & Recreation in the United States is 2.1%.