Zip Codes with the Highest Percentage of Population Employed in Arts, Media & Entertainment in Cordova, TN
RELATED REPORTS & OPTIONS
Arts, Media & Entertainment
Cordova
Compare Zip Codes
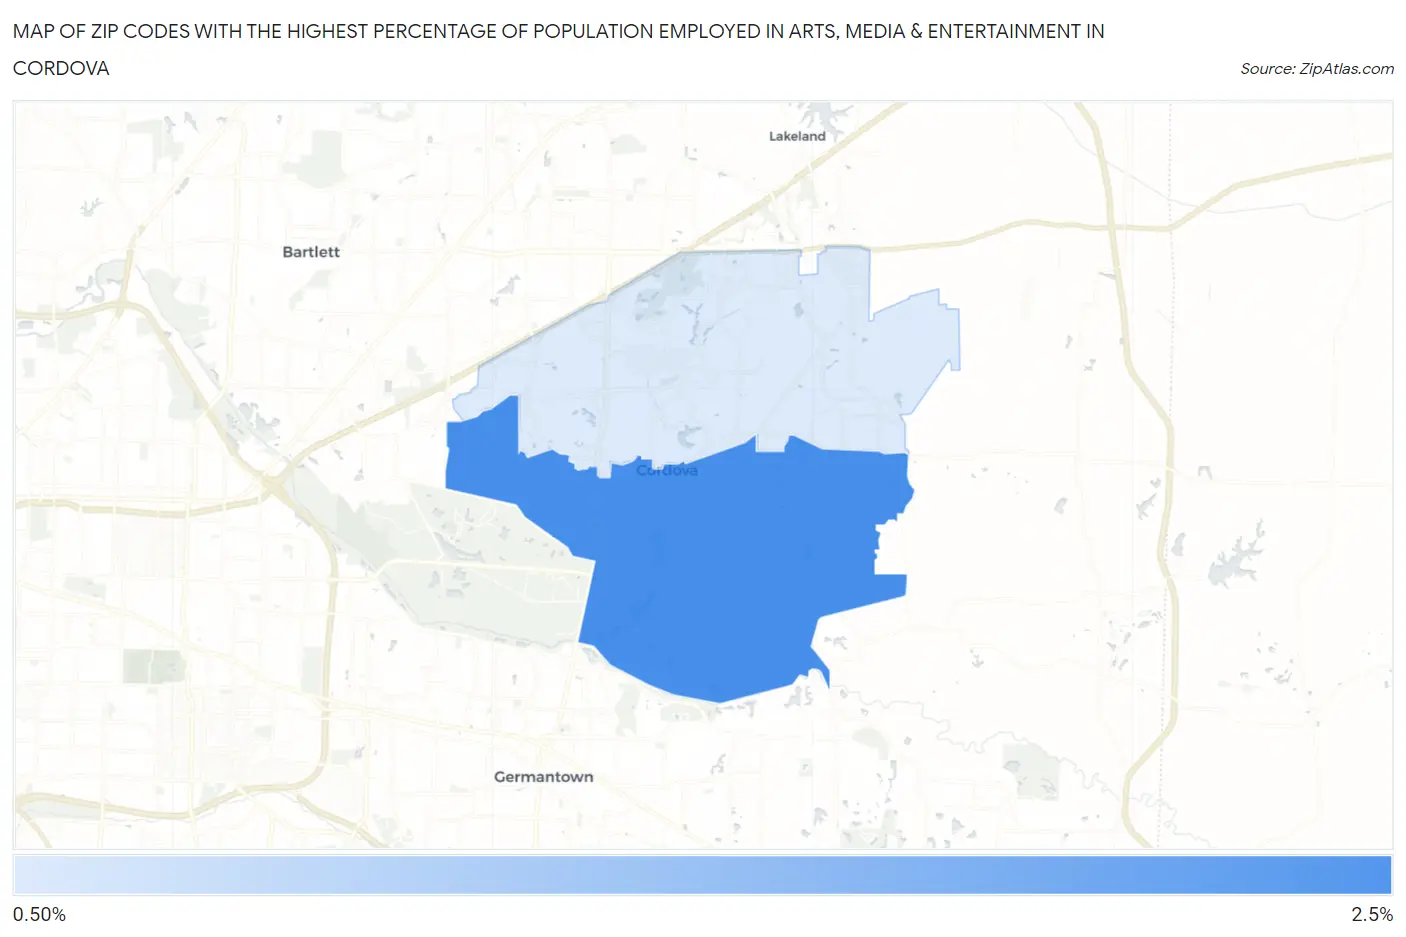
Map of Zip Codes with the Highest Percentage of Population Employed in Arts, Media & Entertainment in Cordova
0.87%
2.0%
Zip Codes with the Highest Percentage of Population Employed in Arts, Media & Entertainment in Cordova, TN
| Zip Code | % Employed | vs State | vs National | |
| 1. | 38018 | 2.0% | 1.9%(+0.078)#143 | 2.1%(-0.042)#7,714 |
| 2. | 38016 | 0.87% | 1.9%(-1.07)#289 | 2.1%(-1.19)#15,858 |
1
Common Questions
What are the Top Zip Codes with the Highest Percentage of Population Employed in Arts, Media & Entertainment in Cordova, TN?
Top Zip Codes with the Highest Percentage of Population Employed in Arts, Media & Entertainment in Cordova, TN are:
What zip code has the Highest Percentage of Population Employed in Arts, Media & Entertainment in Cordova, TN?
38018 has the Highest Percentage of Population Employed in Arts, Media & Entertainment in Cordova, TN with 2.0%.
What is the Percentage of Population Employed in Arts, Media & Entertainment in Tennessee?
Percentage of Population Employed in Arts, Media & Entertainment in Tennessee is 1.9%.
What is the Percentage of Population Employed in Arts, Media & Entertainment in the United States?
Percentage of Population Employed in Arts, Media & Entertainment in the United States is 2.1%.