Zip Codes with the Highest Percentage of Population Employed in Computer & Mathematics in Omaha, NE

RELATED REPORTS & OPTIONS

Computer & Mathematics
Population
Families and Households
Female Fertility
Female Fertility (Unmarried)
Race (Community Size)
Race (Percentage)
Ancestry (Community Size)
AfghanAfricanAlbanianAleutAmericanApacheArabArapahoArgentineanArmenianAustralianAustrianBangladeshiBasqueBelgianBhutaneseBlackfeetBolivianBrazilianBritishBulgarianBurmeseCajunCambodianCanadianCarpatho RusynCentral AmericanCentral American IndianCherokeeChickasawChileanChineseChippewaChoctawColombianComancheCosta RicanCreekCroatianCubanCzechCzechoslovakianDanishDominicanDutchEastern EuropeanEcuadorianEgyptianEnglishEthiopianEuropeanFilipinoFinnishFrenchFrench American IndianFrench CanadianGermanGerman RussianGhanaianGreekGuamanian / ChamorroGuatemalanGuyaneseHaitianHonduranHungarianIcelanderIndian (Asian)IndonesianInupiatIranianIraqiIrishIroquoisIsraeliItalianJamaicanJapaneseJordanianKenyanKiowaKoreanLaotianLatvianLebaneseLithuanianLuxembourgerMacedonianMalaysianMexicanMexican American IndianMoroccanNative HawaiianNavajoNicaraguanNigerianNorthern EuropeanNorwegianPakistaniPalestinianPanamanianPennsylvania GermanPeruvianPolishPortuguesePotawatomiPuebloPuerto RicanRomanianRussianSalvadoranSamoanScandinavianScotch-IrishScottishSeminoleSerbianSiouxSlavicSlovakSloveneSomaliSouth AfricanSouth AmericanSpaniardSpanishSri LankanSubsaharan AfricanSudaneseSwedishSwissSyrianThaiTlingit-HaidaTrinidadian and TobagonianTurkishUkrainianVenezuelanVietnameseWelshWest IndianYugoslavianZimbabwean
Ancestry (Percentage)
AfghanAfricanAlbanianAleutAmericanApacheArabArapahoArgentineanArmenianAustralianAustrianBangladeshiBasqueBelgianBhutaneseBlackfeetBolivianBrazilianBritishBulgarianBurmeseCajunCambodianCanadianCarpatho RusynCentral AmericanCentral American IndianCherokeeChickasawChileanChineseChippewaChoctawColombianComancheCosta RicanCreekCroatianCubanCzechCzechoslovakianDanishDominicanDutchEastern EuropeanEcuadorianEgyptianEnglishEthiopianEuropeanFilipinoFinnishFrenchFrench American IndianFrench CanadianGermanGerman RussianGhanaianGreekGuamanian / ChamorroGuatemalanGuyaneseHaitianHonduranHungarianIcelanderIndian (Asian)IndonesianInupiatIranianIraqiIrishIroquoisIsraeliItalianJamaicanJapaneseJordanianKenyanKiowaKoreanLaotianLatvianLebaneseLithuanianLuxembourgerMacedonianMalaysianMexicanMexican American IndianMoroccanNative HawaiianNavajoNicaraguanNigerianNorthern EuropeanNorwegianPakistaniPalestinianPanamanianPennsylvania GermanPeruvianPolishPortuguesePotawatomiPuebloPuerto RicanRomanianRussianSalvadoranSamoanScandinavianScotch-IrishScottishSeminoleSerbianSiouxSlavicSlovakSloveneSomaliSouth AfricanSouth AmericanSpaniardSpanishSri LankanSubsaharan AfricanSudaneseSwedishSwissSyrianThaiTlingit-HaidaTrinidadian and TobagonianTurkishUkrainianVenezuelanVietnameseWelshWest IndianYugoslavianZimbabwean
Immigrant Origin (Total)
AfghanistanAfricaArgentinaAsiaAustraliaBangladeshBarbadosBelarusBosnia and HerzegovinaBrazilBurma / MyanmarCameroonCanadaCaribbeanCentral AmericaChileChinaColombiaCongoCosta RicaCroatiaCubaCzechoslovakiaDominican RepublicEastern AfricaEastern AsiaEastern EuropeEgyptEl SalvadorEnglandEthiopiaEuropeFranceGermanyGhanaGreeceGuatemalaHondurasHong KongHungaryIndiaIndonesiaIranIraqIrelandIsraelItalyJamaicaJapanJordanKazakhstanKenyaKoreaKuwaitLaosLatin AmericaLatviaLithuaniaMalaysiaMexicoMiddle AfricaMoroccoNepalNetherlandsNicaraguaNigeriaNorthern AfricaNorthern EuropeOceaniaPakistanPanamaPeruPhilippinesPolandPortugalRomaniaRussiaSaudi ArabiaScotlandSierra LeoneSomaliaSouth AfricaSouth AmericaSouth Central AsiaSouth Eastern AsiaSouthern EuropeSpainSri LankaSudanSyriaTaiwanThailandTrinidad and TobagoTurkeyUgandaUkraineVenezuelaVietnamWestern AfricaWestern AsiaWestern EuropeZaireZimbabwe
Immigrant Origin (Percentage)
AfghanistanAfricaArgentinaAsiaAustraliaBangladeshBarbadosBelarusBosnia and HerzegovinaBrazilBurma / MyanmarCameroonCanadaCaribbeanCentral AmericaChileChinaColombiaCongoCosta RicaCroatiaCubaCzechoslovakiaDominican RepublicEastern AfricaEastern AsiaEastern EuropeEgyptEl SalvadorEnglandEthiopiaEuropeFranceGermanyGhanaGreeceGuatemalaHondurasHong KongHungaryIndiaIndonesiaIranIraqIrelandIsraelItalyJamaicaJapanJordanKazakhstanKenyaKoreaKuwaitLaosLatin AmericaLatviaLithuaniaMalaysiaMexicoMiddle AfricaMoroccoNepalNetherlandsNicaraguaNigeriaNorthern AfricaNorthern EuropeOceaniaPakistanPanamaPeruPhilippinesPolandPortugalRomaniaRussiaSaudi ArabiaScotlandSierra LeoneSomaliaSouth AfricaSouth AmericaSouth Central AsiaSouth Eastern AsiaSouthern EuropeSpainSri LankaSudanSyriaTaiwanThailandTrinidad and TobagoTurkeyUgandaUkraineVenezuelaVietnamWestern AfricaWestern AsiaWestern EuropeZaireZimbabwe
Income
Income (Families)
Income (Households)
Poverty
Poverty (Families)
Unemployment
Employment Occupations
Employment Industries
Employer Class
Commute Time
Commute Means
School Enrollment
Education by Degree Field
Occupancy
Finances
Physical Characteristics
Omaha
Compare Zip Codes
Comparison Subject

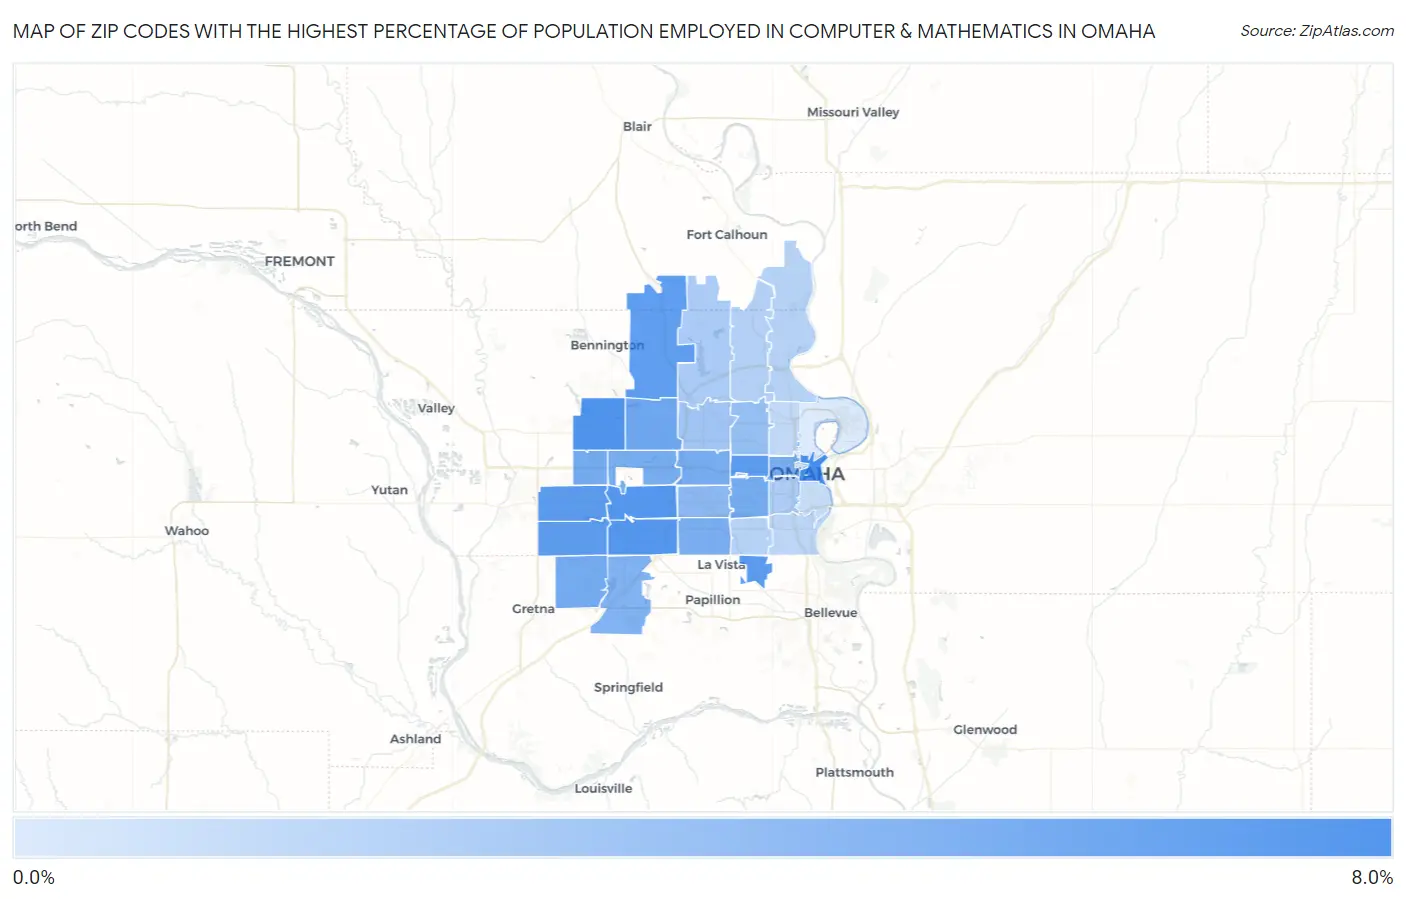
Map of Zip Codes with the Highest Percentage of Population Employed in Computer & Mathematics in Omaha

0.0%
8.0%
Zip Codes with the Highest Percentage of Population Employed in Computer & Mathematics in Omaha Map

Zip Codes with the Highest Percentage of Population Employed in Computer & Mathematics in Omaha, NE

Zip Code % Employed vs State vs National
1.681027.1%3.2%(+3.93)#103.5%(+3.57)#1,576
2.681166.7%3.2%(+3.50)#123.5%(+3.14)#1,817
3.681446.5%3.2%(+3.33)#163.5%(+2.97)#1,934
4.681376.5%3.2%(+3.30)#173.5%(+2.94)#1,956
5.681306.2%3.2%(+3.07)#213.5%(+2.71)#2,120
6.681576.2%3.2%(+3.06)#223.5%(+2.70)#2,132
7.681326.2%3.2%(+3.05)#233.5%(+2.69)#2,135
8.681356.0%3.2%(+2.79)#273.5%(+2.43)#2,355
9.681425.9%3.2%(+2.76)#293.5%(+2.40)#2,386
10.681645.2%3.2%(+2.07)#423.5%(+1.71)#3,084
11.681065.0%3.2%(+1.80)#473.5%(+1.44)#3,403
12.681364.9%3.2%(+1.73)#483.5%(+1.37)#3,515
13.681184.9%3.2%(+1.70)#493.5%(+1.34)#3,552
14.681144.9%3.2%(+1.70)#503.5%(+1.34)#3,558
15.681544.8%3.2%(+1.66)#513.5%(+1.30)#3,614
16.681274.7%3.2%(+1.57)#523.5%(+1.21)#3,727
17.681314.7%3.2%(+1.50)#543.5%(+1.14)#3,837
18.681384.4%3.2%(+1.25)#613.5%(+0.890)#4,245
19.681243.9%3.2%(+0.700)#703.5%(+0.339)#5,327
20.681043.4%3.2%(+0.223)#863.5%(-0.138)#6,522
21.681823.2%3.2%(+0.027)#953.5%(-0.333)#7,120
22.681342.9%3.2%(-0.286)#1003.5%(-0.646)#8,177
23.681222.5%3.2%(-0.713)#1133.5%(-1.07)#9,835
24.681052.4%3.2%(-0.763)#1163.5%(-1.12)#10,026
25.681522.1%3.2%(-1.11)#1373.5%(-1.47)#11,558
26.681122.0%3.2%(-1.20)#1433.5%(-1.56)#11,950
27.681172.0%3.2%(-1.20)#1443.5%(-1.56)#11,965
28.681071.6%3.2%(-1.59)#1673.5%(-1.95)#13,945
29.681111.4%3.2%(-1.76)#1793.5%(-2.12)#14,948
30.681081.2%3.2%(-1.93)#1993.5%(-2.29)#15,907
31.681780.73%3.2%(-2.43)#2583.5%(-2.79)#19,067
32.681100.17%3.2%(-3.00)#3223.5%(-3.36)#22,189

Common Questions

What are the Top 10 Zip Codes with the Highest Percentage of Population Employed in Computer & Mathematics in Omaha, NE?
Top 10 Zip Codes with the Highest Percentage of Population Employed in Computer & Mathematics in Omaha, NE are:
#1
7.1%
#2
6.7%
#3
6.5%
#4
6.5%
#5
6.2%
#6
6.2%
#7
6.2%
#8
6.0%
#9
5.9%
#10
5.2%
What zip code has the Highest Percentage of Population Employed in Computer & Mathematics in Omaha, NE?
68102 has the Highest Percentage of Population Employed in Computer & Mathematics in Omaha, NE with 7.1%.
What is the Percentage of Population Employed in Computer & Mathematics in Omaha, NE?
Percentage of Population Employed in Computer & Mathematics in Omaha is 4.2%.
What is the Percentage of Population Employed in Computer & Mathematics in Nebraska?
Percentage of Population Employed in Computer & Mathematics in Nebraska is 3.2%.
What is the Percentage of Population Employed in Computer & Mathematics in the United States?
Percentage of Population Employed in Computer & Mathematics in the United States is 3.5%.