Zip Codes with the Highest Percentage of Population Employed in Community & Social Service in Omaha, NE

RELATED REPORTS & OPTIONS

Community & Social Service
Population
Families and Households
Female Fertility
Female Fertility (Unmarried)
Race (Community Size)
Race (Percentage)
Ancestry (Community Size)
AfghanAfricanAlbanianAleutAmericanApacheArabArapahoArgentineanArmenianAustralianAustrianBangladeshiBasqueBelgianBhutaneseBlackfeetBolivianBrazilianBritishBulgarianBurmeseCajunCambodianCanadianCarpatho RusynCentral AmericanCentral American IndianCherokeeChickasawChileanChineseChippewaChoctawColombianComancheCosta RicanCreekCroatianCubanCzechCzechoslovakianDanishDominicanDutchEastern EuropeanEcuadorianEgyptianEnglishEthiopianEuropeanFilipinoFinnishFrenchFrench American IndianFrench CanadianGermanGerman RussianGhanaianGreekGuamanian / ChamorroGuatemalanGuyaneseHaitianHonduranHungarianIcelanderIndian (Asian)IndonesianInupiatIranianIraqiIrishIroquoisIsraeliItalianJamaicanJapaneseJordanianKenyanKiowaKoreanLaotianLatvianLebaneseLithuanianLuxembourgerMacedonianMalaysianMexicanMexican American IndianMoroccanNative HawaiianNavajoNicaraguanNigerianNorthern EuropeanNorwegianPakistaniPalestinianPanamanianPennsylvania GermanPeruvianPolishPortuguesePotawatomiPuebloPuerto RicanRomanianRussianSalvadoranSamoanScandinavianScotch-IrishScottishSeminoleSerbianSiouxSlavicSlovakSloveneSomaliSouth AfricanSouth AmericanSpaniardSpanishSri LankanSubsaharan AfricanSudaneseSwedishSwissSyrianThaiTlingit-HaidaTrinidadian and TobagonianTurkishUkrainianVenezuelanVietnameseWelshWest IndianYugoslavianZimbabwean
Ancestry (Percentage)
AfghanAfricanAlbanianAleutAmericanApacheArabArapahoArgentineanArmenianAustralianAustrianBangladeshiBasqueBelgianBhutaneseBlackfeetBolivianBrazilianBritishBulgarianBurmeseCajunCambodianCanadianCarpatho RusynCentral AmericanCentral American IndianCherokeeChickasawChileanChineseChippewaChoctawColombianComancheCosta RicanCreekCroatianCubanCzechCzechoslovakianDanishDominicanDutchEastern EuropeanEcuadorianEgyptianEnglishEthiopianEuropeanFilipinoFinnishFrenchFrench American IndianFrench CanadianGermanGerman RussianGhanaianGreekGuamanian / ChamorroGuatemalanGuyaneseHaitianHonduranHungarianIcelanderIndian (Asian)IndonesianInupiatIranianIraqiIrishIroquoisIsraeliItalianJamaicanJapaneseJordanianKenyanKiowaKoreanLaotianLatvianLebaneseLithuanianLuxembourgerMacedonianMalaysianMexicanMexican American IndianMoroccanNative HawaiianNavajoNicaraguanNigerianNorthern EuropeanNorwegianPakistaniPalestinianPanamanianPennsylvania GermanPeruvianPolishPortuguesePotawatomiPuebloPuerto RicanRomanianRussianSalvadoranSamoanScandinavianScotch-IrishScottishSeminoleSerbianSiouxSlavicSlovakSloveneSomaliSouth AfricanSouth AmericanSpaniardSpanishSri LankanSubsaharan AfricanSudaneseSwedishSwissSyrianThaiTlingit-HaidaTrinidadian and TobagonianTurkishUkrainianVenezuelanVietnameseWelshWest IndianYugoslavianZimbabwean
Immigrant Origin (Total)
AfghanistanAfricaArgentinaAsiaAustraliaBangladeshBarbadosBelarusBosnia and HerzegovinaBrazilBurma / MyanmarCameroonCanadaCaribbeanCentral AmericaChileChinaColombiaCongoCosta RicaCroatiaCubaCzechoslovakiaDominican RepublicEastern AfricaEastern AsiaEastern EuropeEgyptEl SalvadorEnglandEthiopiaEuropeFranceGermanyGhanaGreeceGuatemalaHondurasHong KongHungaryIndiaIndonesiaIranIraqIrelandIsraelItalyJamaicaJapanJordanKazakhstanKenyaKoreaKuwaitLaosLatin AmericaLatviaLithuaniaMalaysiaMexicoMiddle AfricaMoroccoNepalNetherlandsNicaraguaNigeriaNorthern AfricaNorthern EuropeOceaniaPakistanPanamaPeruPhilippinesPolandPortugalRomaniaRussiaSaudi ArabiaScotlandSierra LeoneSomaliaSouth AfricaSouth AmericaSouth Central AsiaSouth Eastern AsiaSouthern EuropeSpainSri LankaSudanSyriaTaiwanThailandTrinidad and TobagoTurkeyUgandaUkraineVenezuelaVietnamWestern AfricaWestern AsiaWestern EuropeZaireZimbabwe
Immigrant Origin (Percentage)
AfghanistanAfricaArgentinaAsiaAustraliaBangladeshBarbadosBelarusBosnia and HerzegovinaBrazilBurma / MyanmarCameroonCanadaCaribbeanCentral AmericaChileChinaColombiaCongoCosta RicaCroatiaCubaCzechoslovakiaDominican RepublicEastern AfricaEastern AsiaEastern EuropeEgyptEl SalvadorEnglandEthiopiaEuropeFranceGermanyGhanaGreeceGuatemalaHondurasHong KongHungaryIndiaIndonesiaIranIraqIrelandIsraelItalyJamaicaJapanJordanKazakhstanKenyaKoreaKuwaitLaosLatin AmericaLatviaLithuaniaMalaysiaMexicoMiddle AfricaMoroccoNepalNetherlandsNicaraguaNigeriaNorthern AfricaNorthern EuropeOceaniaPakistanPanamaPeruPhilippinesPolandPortugalRomaniaRussiaSaudi ArabiaScotlandSierra LeoneSomaliaSouth AfricaSouth AmericaSouth Central AsiaSouth Eastern AsiaSouthern EuropeSpainSri LankaSudanSyriaTaiwanThailandTrinidad and TobagoTurkeyUgandaUkraineVenezuelaVietnamWestern AfricaWestern AsiaWestern EuropeZaireZimbabwe
Income
Income (Families)
Income (Households)
Poverty
Poverty (Families)
Unemployment
Employment Occupations
Employment Industries
Employer Class
Commute Time
Commute Means
School Enrollment
Education by Degree Field
Occupancy
Finances
Physical Characteristics
Omaha
Compare Zip Codes
Comparison Subject

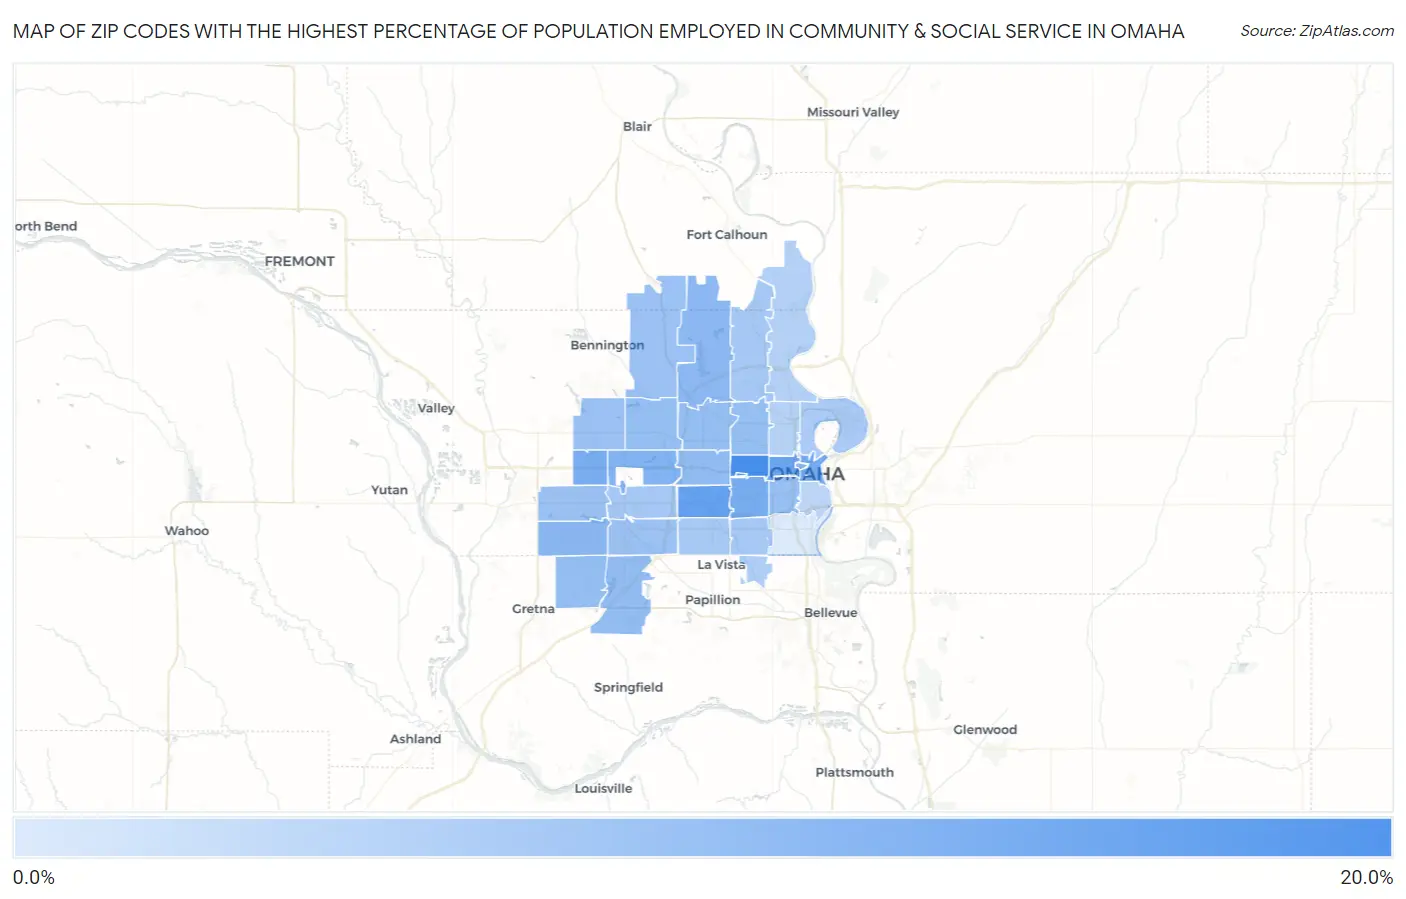
Map of Zip Codes with the Highest Percentage of Population Employed in Community & Social Service in Omaha

0.0%
20.0%
Zip Codes with the Highest Percentage of Population Employed in Community & Social Service  in Omaha Map

Zip Codes with the Highest Percentage of Population Employed in Community & Social Service in Omaha, NE

Zip Code % Employed vs State vs National
1.6813219.8%11.0%(+8.76)#2711.2%(+8.59)#2,090
2.6818219.7%11.0%(+8.64)#2911.2%(+8.47)#2,134
3.6812416.7%11.0%(+5.61)#4411.2%(+5.44)#3,615
4.6813115.8%11.0%(+4.74)#5111.2%(+4.57)#4,261
5.6810214.7%11.0%(+3.67)#7311.2%(+3.50)#5,249
6.6810614.6%11.0%(+3.57)#8011.2%(+3.40)#5,348
7.6811814.4%11.0%(+3.36)#8411.2%(+3.19)#5,581
8.6815413.6%11.0%(+2.52)#10911.2%(+2.35)#6,666
9.6817812.7%11.0%(+1.69)#13311.2%(+1.52)#8,009
10.6813512.5%11.0%(+1.50)#13611.2%(+1.33)#8,346
11.6812212.4%11.0%(+1.37)#14211.2%(+1.19)#8,579
12.6811412.0%11.0%(+0.910)#15811.2%(+0.739)#9,476
13.6813811.6%11.0%(+0.544)#17011.2%(+0.373)#10,265
14.6813611.5%11.0%(+0.480)#17111.2%(+0.309)#10,405
15.6816411.5%11.0%(+0.443)#17511.2%(+0.272)#10,484
16.6813411.5%11.0%(+0.443)#17611.2%(+0.272)#10,485
17.6810411.4%11.0%(+0.359)#18111.2%(+0.187)#10,669
18.6810511.3%11.0%(+0.266)#19011.2%(+0.095)#10,867
19.6811611.0%11.0%(-0.051)#20811.2%(-0.222)#11,662
20.6813710.9%11.0%(-0.113)#20911.2%(-0.284)#11,813
21.6814210.8%11.0%(-0.240)#21611.2%(-0.411)#12,108
22.6813010.7%11.0%(-0.342)#21911.2%(-0.513)#12,371
23.681449.9%11.0%(-1.17)#25511.2%(-1.34)#14,478
24.681529.8%11.0%(-1.22)#25711.2%(-1.39)#14,588
25.681179.8%11.0%(-1.24)#25811.2%(-1.42)#14,647
26.681279.7%11.0%(-1.37)#26211.2%(-1.54)#14,925
27.681109.4%11.0%(-1.60)#27711.2%(-1.77)#15,576
28.681578.9%11.0%(-2.15)#30211.2%(-2.33)#17,125
29.681128.4%11.0%(-2.63)#32611.2%(-2.80)#18,436
30.681118.2%11.0%(-2.89)#34711.2%(-3.06)#19,140
31.681087.6%11.0%(-3.43)#37811.2%(-3.60)#20,615
32.681074.3%11.0%(-6.69)#48311.2%(-6.87)#27,120

Common Questions

What are the Top 10 Zip Codes with the Highest Percentage of Population Employed in Community & Social Service in Omaha, NE?
Top 10 Zip Codes with the Highest Percentage of Population Employed in Community & Social Service in Omaha, NE are:
#1
19.8%
#2
19.7%
#3
16.7%
#4
15.8%
#5
14.7%
#6
14.6%
#7
14.4%
#8
13.6%
#9
12.7%
#10
12.5%
What zip code has the Highest Percentage of Population Employed in Community & Social Service in Omaha, NE?
68132 has the Highest Percentage of Population Employed in Community & Social Service in Omaha, NE with 19.8%.
What is the Percentage of Population Employed in Community & Social Service in Omaha, NE?
Percentage of Population Employed in Community & Social Service in Omaha is 11.7%.
What is the Percentage of Population Employed in Community & Social Service in Nebraska?
Percentage of Population Employed in Community & Social Service in Nebraska is 11.0%.
What is the Percentage of Population Employed in Community & Social Service in the United States?
Percentage of Population Employed in Community & Social Service in the United States is 11.2%.