Zip Codes with the Highest Percentage of Population with a Degree in Education in Omaha, NE

RELATED REPORTS & OPTIONS

Education
Population
Families and Households
Female Fertility
Female Fertility (Unmarried)
Race (Community Size)
Race (Percentage)
Ancestry (Community Size)
AfghanAfricanAlbanianAleutAmericanApacheArabArapahoArgentineanArmenianAustralianAustrianBangladeshiBasqueBelgianBhutaneseBlackfeetBolivianBrazilianBritishBulgarianBurmeseCajunCambodianCanadianCarpatho RusynCentral AmericanCentral American IndianCherokeeChickasawChileanChineseChippewaChoctawColombianComancheCosta RicanCreekCroatianCubanCzechCzechoslovakianDanishDominicanDutchEastern EuropeanEcuadorianEgyptianEnglishEthiopianEuropeanFilipinoFinnishFrenchFrench American IndianFrench CanadianGermanGerman RussianGhanaianGreekGuamanian / ChamorroGuatemalanGuyaneseHaitianHonduranHungarianIcelanderIndian (Asian)IndonesianInupiatIranianIraqiIrishIroquoisIsraeliItalianJamaicanJapaneseJordanianKenyanKiowaKoreanLaotianLatvianLebaneseLithuanianLuxembourgerMacedonianMalaysianMexicanMexican American IndianMoroccanNative HawaiianNavajoNicaraguanNigerianNorthern EuropeanNorwegianPakistaniPalestinianPanamanianPennsylvania GermanPeruvianPolishPortuguesePotawatomiPuebloPuerto RicanRomanianRussianSalvadoranSamoanScandinavianScotch-IrishScottishSeminoleSerbianSiouxSlavicSlovakSloveneSomaliSouth AfricanSouth AmericanSpaniardSpanishSri LankanSubsaharan AfricanSudaneseSwedishSwissSyrianThaiTlingit-HaidaTrinidadian and TobagonianTurkishUkrainianVenezuelanVietnameseWelshWest IndianYugoslavianZimbabwean
Ancestry (Percentage)
AfghanAfricanAlbanianAleutAmericanApacheArabArapahoArgentineanArmenianAustralianAustrianBangladeshiBasqueBelgianBhutaneseBlackfeetBolivianBrazilianBritishBulgarianBurmeseCajunCambodianCanadianCarpatho RusynCentral AmericanCentral American IndianCherokeeChickasawChileanChineseChippewaChoctawColombianComancheCosta RicanCreekCroatianCubanCzechCzechoslovakianDanishDominicanDutchEastern EuropeanEcuadorianEgyptianEnglishEthiopianEuropeanFilipinoFinnishFrenchFrench American IndianFrench CanadianGermanGerman RussianGhanaianGreekGuamanian / ChamorroGuatemalanGuyaneseHaitianHonduranHungarianIcelanderIndian (Asian)IndonesianInupiatIranianIraqiIrishIroquoisIsraeliItalianJamaicanJapaneseJordanianKenyanKiowaKoreanLaotianLatvianLebaneseLithuanianLuxembourgerMacedonianMalaysianMexicanMexican American IndianMoroccanNative HawaiianNavajoNicaraguanNigerianNorthern EuropeanNorwegianPakistaniPalestinianPanamanianPennsylvania GermanPeruvianPolishPortuguesePotawatomiPuebloPuerto RicanRomanianRussianSalvadoranSamoanScandinavianScotch-IrishScottishSeminoleSerbianSiouxSlavicSlovakSloveneSomaliSouth AfricanSouth AmericanSpaniardSpanishSri LankanSubsaharan AfricanSudaneseSwedishSwissSyrianThaiTlingit-HaidaTrinidadian and TobagonianTurkishUkrainianVenezuelanVietnameseWelshWest IndianYugoslavianZimbabwean
Immigrant Origin (Total)
AfghanistanAfricaArgentinaAsiaAustraliaBangladeshBarbadosBelarusBosnia and HerzegovinaBrazilBurma / MyanmarCameroonCanadaCaribbeanCentral AmericaChileChinaColombiaCongoCosta RicaCroatiaCubaCzechoslovakiaDominican RepublicEastern AfricaEastern AsiaEastern EuropeEgyptEl SalvadorEnglandEthiopiaEuropeFranceGermanyGhanaGreeceGuatemalaHondurasHong KongHungaryIndiaIndonesiaIranIraqIrelandIsraelItalyJamaicaJapanJordanKazakhstanKenyaKoreaKuwaitLaosLatin AmericaLatviaLithuaniaMalaysiaMexicoMiddle AfricaMoroccoNepalNetherlandsNicaraguaNigeriaNorthern AfricaNorthern EuropeOceaniaPakistanPanamaPeruPhilippinesPolandPortugalRomaniaRussiaSaudi ArabiaScotlandSierra LeoneSomaliaSouth AfricaSouth AmericaSouth Central AsiaSouth Eastern AsiaSouthern EuropeSpainSri LankaSudanSyriaTaiwanThailandTrinidad and TobagoTurkeyUgandaUkraineVenezuelaVietnamWestern AfricaWestern AsiaWestern EuropeZaireZimbabwe
Immigrant Origin (Percentage)
AfghanistanAfricaArgentinaAsiaAustraliaBangladeshBarbadosBelarusBosnia and HerzegovinaBrazilBurma / MyanmarCameroonCanadaCaribbeanCentral AmericaChileChinaColombiaCongoCosta RicaCroatiaCubaCzechoslovakiaDominican RepublicEastern AfricaEastern AsiaEastern EuropeEgyptEl SalvadorEnglandEthiopiaEuropeFranceGermanyGhanaGreeceGuatemalaHondurasHong KongHungaryIndiaIndonesiaIranIraqIrelandIsraelItalyJamaicaJapanJordanKazakhstanKenyaKoreaKuwaitLaosLatin AmericaLatviaLithuaniaMalaysiaMexicoMiddle AfricaMoroccoNepalNetherlandsNicaraguaNigeriaNorthern AfricaNorthern EuropeOceaniaPakistanPanamaPeruPhilippinesPolandPortugalRomaniaRussiaSaudi ArabiaScotlandSierra LeoneSomaliaSouth AfricaSouth AmericaSouth Central AsiaSouth Eastern AsiaSouthern EuropeSpainSri LankaSudanSyriaTaiwanThailandTrinidad and TobagoTurkeyUgandaUkraineVenezuelaVietnamWestern AfricaWestern AsiaWestern EuropeZaireZimbabwe
Income
Income (Families)
Income (Households)
Poverty
Poverty (Families)
Unemployment
Employment Occupations
Employment Industries
Employer Class
Commute Time
Commute Means
School Enrollment
Education by Degree Field
Occupancy
Finances
Physical Characteristics
Omaha
Compare Zip Codes
Comparison Subject

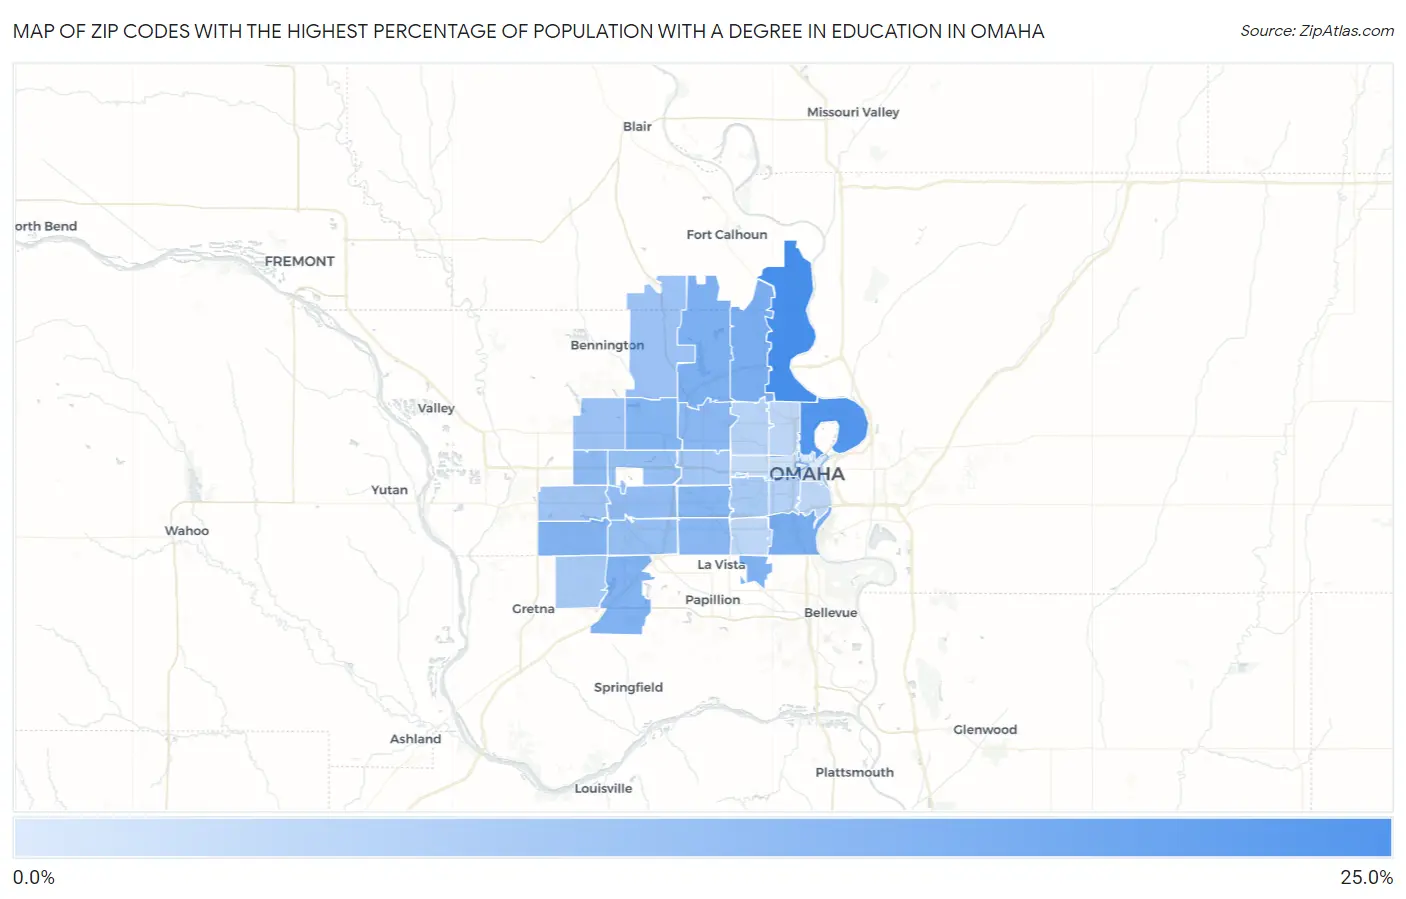
Map of Zip Codes with the Highest Percentage of Population with a Degree in Education in Omaha

0.0%
25.0%
Zip Codes with the Highest Percentage of Population with a Degree in Education in Omaha Map

Zip Codes with the Highest Percentage of Population with a Degree in Education in Omaha, NE

Zip Code % Graduates vs State vs National
1.6811222.9%16.5%(+6.41)#26211.1%(+11.9)#8,262
2.6811021.0%16.5%(+4.51)#29711.1%(+9.96)#9,699
3.6810716.5%16.5%(+0.043)#36611.1%(+5.49)#13,955
4.6815216.4%16.5%(-0.135)#36811.1%(+5.31)#14,135
5.6812216.1%16.5%(-0.392)#37411.1%(+5.05)#14,401
6.6815715.6%16.5%(-0.936)#38511.1%(+4.51)#14,989
7.6813815.4%16.5%(-1.09)#39011.1%(+4.36)#15,150
8.6813515.2%16.5%(-1.31)#39911.1%(+4.13)#15,428
9.6816415.0%16.5%(-1.46)#40311.1%(+3.99)#15,625
10.6812414.6%16.5%(-1.87)#41011.1%(+3.58)#16,170
11.6813414.3%16.5%(-2.23)#42011.1%(+3.21)#16,710
12.6812714.2%16.5%(-2.30)#42111.1%(+3.15)#16,772
13.6811813.6%16.5%(-2.88)#43011.1%(+2.57)#17,510
14.6814413.4%16.5%(-3.14)#43511.1%(+2.31)#17,795
15.6815413.0%16.5%(-3.50)#44111.1%(+1.95)#18,244
16.6813712.9%16.5%(-3.59)#44311.1%(+1.86)#18,364
17.6814212.3%16.5%(-4.20)#45611.1%(+1.25)#19,201
18.6811612.0%16.5%(-4.55)#46311.1%(+0.899)#19,677
19.6813011.4%16.5%(-5.06)#46711.1%(+0.389)#20,361
20.6811411.2%16.5%(-5.30)#47011.1%(+0.142)#20,702
21.6810610.7%16.5%(-5.76)#47511.1%(-0.313)#21,295
22.6813610.6%16.5%(-5.93)#47611.1%(-0.489)#21,553
23.681059.2%16.5%(-7.28)#49111.1%(-1.83)#23,391
24.681048.9%16.5%(-7.59)#49311.1%(-2.14)#23,793
25.681088.2%16.5%(-8.28)#49711.1%(-2.83)#24,606
26.681178.1%16.5%(-8.39)#49811.1%(-2.94)#24,716
27.681118.0%16.5%(-8.48)#50111.1%(-3.04)#24,851
28.681327.3%16.5%(-9.19)#50611.1%(-3.74)#25,570
29.681316.1%16.5%(-10.4)#51211.1%(-4.93)#26,719
30.681024.4%16.5%(-12.1)#51711.1%(-6.64)#27,949

Common Questions

What are the Top 10 Zip Codes with the Highest Percentage of Population with a Degree in Education in Omaha, NE?
Top 10 Zip Codes with the Highest Percentage of Population with a Degree in Education in Omaha, NE are:
#1
22.9%
#2
21.0%
#3
16.5%
#4
16.4%
#5
16.1%
#6
15.6%
#7
15.4%
#8
15.2%
#9
15.0%
#10
14.6%
What zip code has the Highest Percentage of Population with a Degree in Education in Omaha, NE?
68112 has the Highest Percentage of Population with a Degree in Education in Omaha, NE with 22.9%.
What is the Percentage of Population with a Degree in Education in Omaha, NE?
Percentage of Population with a Degree in Education in Omaha is 12.2%.
What is the Percentage of Population with a Degree in Education in Nebraska?
Percentage of Population with a Degree in Education in Nebraska is 16.5%.
What is the Percentage of Population with a Degree in Education in the United States?
Percentage of Population with a Degree in Education in the United States is 11.1%.