Zip Codes with the Largest Northern European Community in Omaha, NE

RELATED REPORTS & OPTIONS

Northern European
Population
Families and Households
Female Fertility
Female Fertility (Unmarried)
Race (Community Size)
Race (Percentage)
Ancestry (Community Size)
AfghanAfricanAlbanianAleutAmericanApacheArabArapahoArgentineanArmenianAustralianAustrianBangladeshiBasqueBelgianBhutaneseBlackfeetBolivianBrazilianBritishBulgarianBurmeseCajunCambodianCanadianCarpatho RusynCentral AmericanCentral American IndianCherokeeChickasawChileanChineseChippewaChoctawColombianComancheCosta RicanCreekCroatianCubanCzechCzechoslovakianDanishDominicanDutchEastern EuropeanEcuadorianEgyptianEnglishEthiopianEuropeanFilipinoFinnishFrenchFrench American IndianFrench CanadianGermanGerman RussianGhanaianGreekGuamanian / ChamorroGuatemalanGuyaneseHaitianHonduranHungarianIcelanderIndian (Asian)IndonesianInupiatIranianIraqiIrishIroquoisIsraeliItalianJamaicanJapaneseJordanianKenyanKiowaKoreanLaotianLatvianLebaneseLithuanianLuxembourgerMacedonianMalaysianMexicanMexican American IndianMoroccanNative HawaiianNavajoNicaraguanNigerianNorthern EuropeanNorwegianPakistaniPalestinianPanamanianPennsylvania GermanPeruvianPolishPortuguesePotawatomiPuebloPuerto RicanRomanianRussianSalvadoranSamoanScandinavianScotch-IrishScottishSeminoleSerbianSiouxSlavicSlovakSloveneSomaliSouth AfricanSouth AmericanSpaniardSpanishSri LankanSubsaharan AfricanSudaneseSwedishSwissSyrianThaiTlingit-HaidaTrinidadian and TobagonianTurkishUkrainianVenezuelanVietnameseWelshWest IndianYugoslavianZimbabwean
Ancestry (Percentage)
AfghanAfricanAlbanianAleutAmericanApacheArabArapahoArgentineanArmenianAustralianAustrianBangladeshiBasqueBelgianBhutaneseBlackfeetBolivianBrazilianBritishBulgarianBurmeseCajunCambodianCanadianCarpatho RusynCentral AmericanCentral American IndianCherokeeChickasawChileanChineseChippewaChoctawColombianComancheCosta RicanCreekCroatianCubanCzechCzechoslovakianDanishDominicanDutchEastern EuropeanEcuadorianEgyptianEnglishEthiopianEuropeanFilipinoFinnishFrenchFrench American IndianFrench CanadianGermanGerman RussianGhanaianGreekGuamanian / ChamorroGuatemalanGuyaneseHaitianHonduranHungarianIcelanderIndian (Asian)IndonesianInupiatIranianIraqiIrishIroquoisIsraeliItalianJamaicanJapaneseJordanianKenyanKiowaKoreanLaotianLatvianLebaneseLithuanianLuxembourgerMacedonianMalaysianMexicanMexican American IndianMoroccanNative HawaiianNavajoNicaraguanNigerianNorthern EuropeanNorwegianPakistaniPalestinianPanamanianPennsylvania GermanPeruvianPolishPortuguesePotawatomiPuebloPuerto RicanRomanianRussianSalvadoranSamoanScandinavianScotch-IrishScottishSeminoleSerbianSiouxSlavicSlovakSloveneSomaliSouth AfricanSouth AmericanSpaniardSpanishSri LankanSubsaharan AfricanSudaneseSwedishSwissSyrianThaiTlingit-HaidaTrinidadian and TobagonianTurkishUkrainianVenezuelanVietnameseWelshWest IndianYugoslavianZimbabwean
Immigrant Origin (Total)
AfghanistanAfricaArgentinaAsiaAustraliaBangladeshBarbadosBelarusBosnia and HerzegovinaBrazilBurma / MyanmarCameroonCanadaCaribbeanCentral AmericaChileChinaColombiaCongoCosta RicaCroatiaCubaCzechoslovakiaDominican RepublicEastern AfricaEastern AsiaEastern EuropeEgyptEl SalvadorEnglandEthiopiaEuropeFranceGermanyGhanaGreeceGuatemalaHondurasHong KongHungaryIndiaIndonesiaIranIraqIrelandIsraelItalyJamaicaJapanJordanKazakhstanKenyaKoreaKuwaitLaosLatin AmericaLatviaLithuaniaMalaysiaMexicoMiddle AfricaMoroccoNepalNetherlandsNicaraguaNigeriaNorthern AfricaNorthern EuropeOceaniaPakistanPanamaPeruPhilippinesPolandPortugalRomaniaRussiaSaudi ArabiaScotlandSierra LeoneSomaliaSouth AfricaSouth AmericaSouth Central AsiaSouth Eastern AsiaSouthern EuropeSpainSri LankaSudanSyriaTaiwanThailandTrinidad and TobagoTurkeyUgandaUkraineVenezuelaVietnamWestern AfricaWestern AsiaWestern EuropeZaireZimbabwe
Immigrant Origin (Percentage)
AfghanistanAfricaArgentinaAsiaAustraliaBangladeshBarbadosBelarusBosnia and HerzegovinaBrazilBurma / MyanmarCameroonCanadaCaribbeanCentral AmericaChileChinaColombiaCongoCosta RicaCroatiaCubaCzechoslovakiaDominican RepublicEastern AfricaEastern AsiaEastern EuropeEgyptEl SalvadorEnglandEthiopiaEuropeFranceGermanyGhanaGreeceGuatemalaHondurasHong KongHungaryIndiaIndonesiaIranIraqIrelandIsraelItalyJamaicaJapanJordanKazakhstanKenyaKoreaKuwaitLaosLatin AmericaLatviaLithuaniaMalaysiaMexicoMiddle AfricaMoroccoNepalNetherlandsNicaraguaNigeriaNorthern AfricaNorthern EuropeOceaniaPakistanPanamaPeruPhilippinesPolandPortugalRomaniaRussiaSaudi ArabiaScotlandSierra LeoneSomaliaSouth AfricaSouth AmericaSouth Central AsiaSouth Eastern AsiaSouthern EuropeSpainSri LankaSudanSyriaTaiwanThailandTrinidad and TobagoTurkeyUgandaUkraineVenezuelaVietnamWestern AfricaWestern AsiaWestern EuropeZaireZimbabwe
Income
Income (Families)
Income (Households)
Poverty
Poverty (Families)
Unemployment
Employment Occupations
Employment Industries
Employer Class
Commute Time
Commute Means
School Enrollment
Education by Degree Field
Occupancy
Finances
Physical Characteristics
Omaha
Compare Zip Codes
Comparison Subject

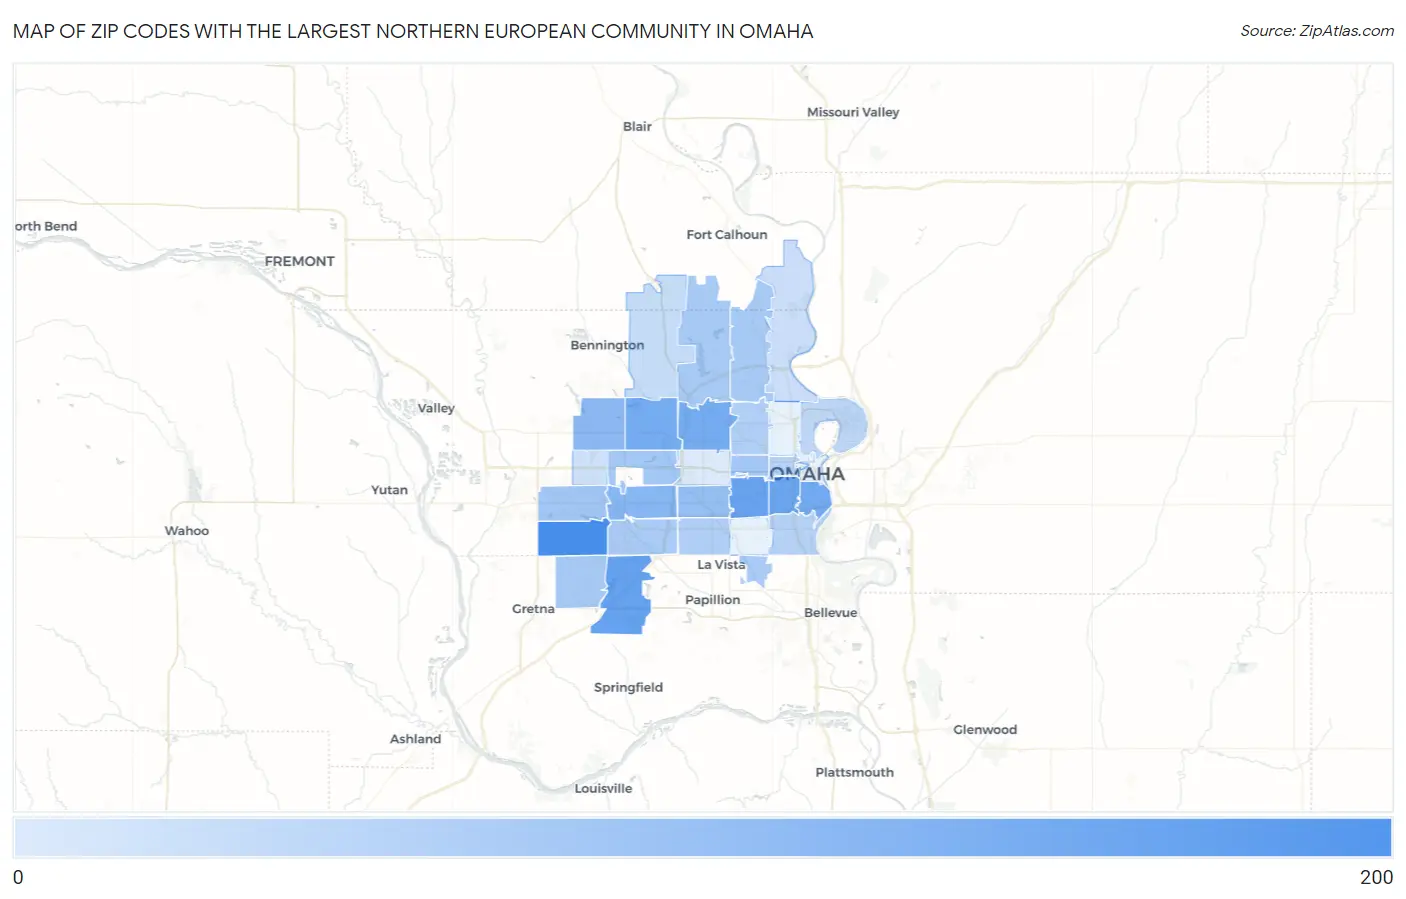
Map of Zip Codes with the Largest Northern European Community in Omaha

0
200
Zip Codes with the Largest Northern European Community in Omaha Map

Zip Codes with the Largest Northern European Community in Omaha, NE

Zip Code Northern European vs State vs National
1.681352002,863(6.99%)#2487,800(0.04%)#360
2.68138942,863(3.28%)#3487,800(0.02%)#1,439
3.68106902,863(3.14%)#4487,800(0.02%)#1,530
4.68105782,863(2.72%)#6487,800(0.02%)#1,843
5.68108662,863(2.31%)#11487,800(0.01%)#2,261
6.68134632,863(2.20%)#12487,800(0.01%)#2,378
7.68164632,863(2.20%)#13487,800(0.01%)#2,379
8.68144412,863(1.43%)#24487,800(0.01%)#3,558
9.68116362,863(1.26%)#28487,800(0.01%)#3,909
10.68124282,863(0.98%)#36487,800(0.01%)#4,716
11.68154202,863(0.70%)#41487,800(0.00%)#5,700
12.68130202,863(0.70%)#42487,800(0.00%)#5,704
13.68132202,863(0.70%)#43487,800(0.00%)#5,721
14.68136172,863(0.59%)#44487,800(0.00%)#6,187
15.68122172,863(0.59%)#45487,800(0.00%)#6,208
16.68152172,863(0.59%)#46487,800(0.00%)#6,246
17.68137162,863(0.56%)#47487,800(0.00%)#6,349
18.68157162,863(0.56%)#48487,800(0.00%)#6,432
19.68104142,863(0.49%)#50487,800(0.00%)#6,727
20.68127142,863(0.49%)#51487,800(0.00%)#6,778
21.68107122,863(0.42%)#54487,800(0.00%)#7,191
22.68131122,863(0.42%)#57487,800(0.00%)#7,255
23.68110102,863(0.35%)#63487,800(0.00%)#7,771
24.6814282,863(0.28%)#70487,800(0.00%)#8,371
25.6811272,863(0.24%)#73487,800(0.00%)#8,606
26.6811862,863(0.21%)#75487,800(0.00%)#8,884
27.6811442,863(0.14%)#85487,800(0.00%)#9,466

Common Questions

What are the Top 10 Zip Codes with the Largest Northern European Community in Omaha, NE?
Top 10 Zip Codes with the Largest Northern European Community in Omaha, NE are:
#1
200
#2
94
#3
90
#4
78
#5
66
#6
63
#7
63
#8
41
#9
36
#10
28
What zip code has the Largest Northern European Community in Omaha, NE?
68135 has the Largest Northern European Community in Omaha, NE with 200.
What is the Total Northern European Population in Omaha, NE?
Total Northern European Population in Omaha is 732.
What is the Total Northern European Population in Nebraska?
Total Northern European Population in Nebraska is 2,863.
What is the Total Northern European Population in the United States?
Total Northern European Population in the United States is 487,800.