Zip Codes with the Highest Percentage of Households Heated by Bottled Gas / Liquid Propane in Omaha, NE
RELATED REPORTS & OPTIONS
Bottled Gas / LP Heating
Omaha
Compare Zip Codes
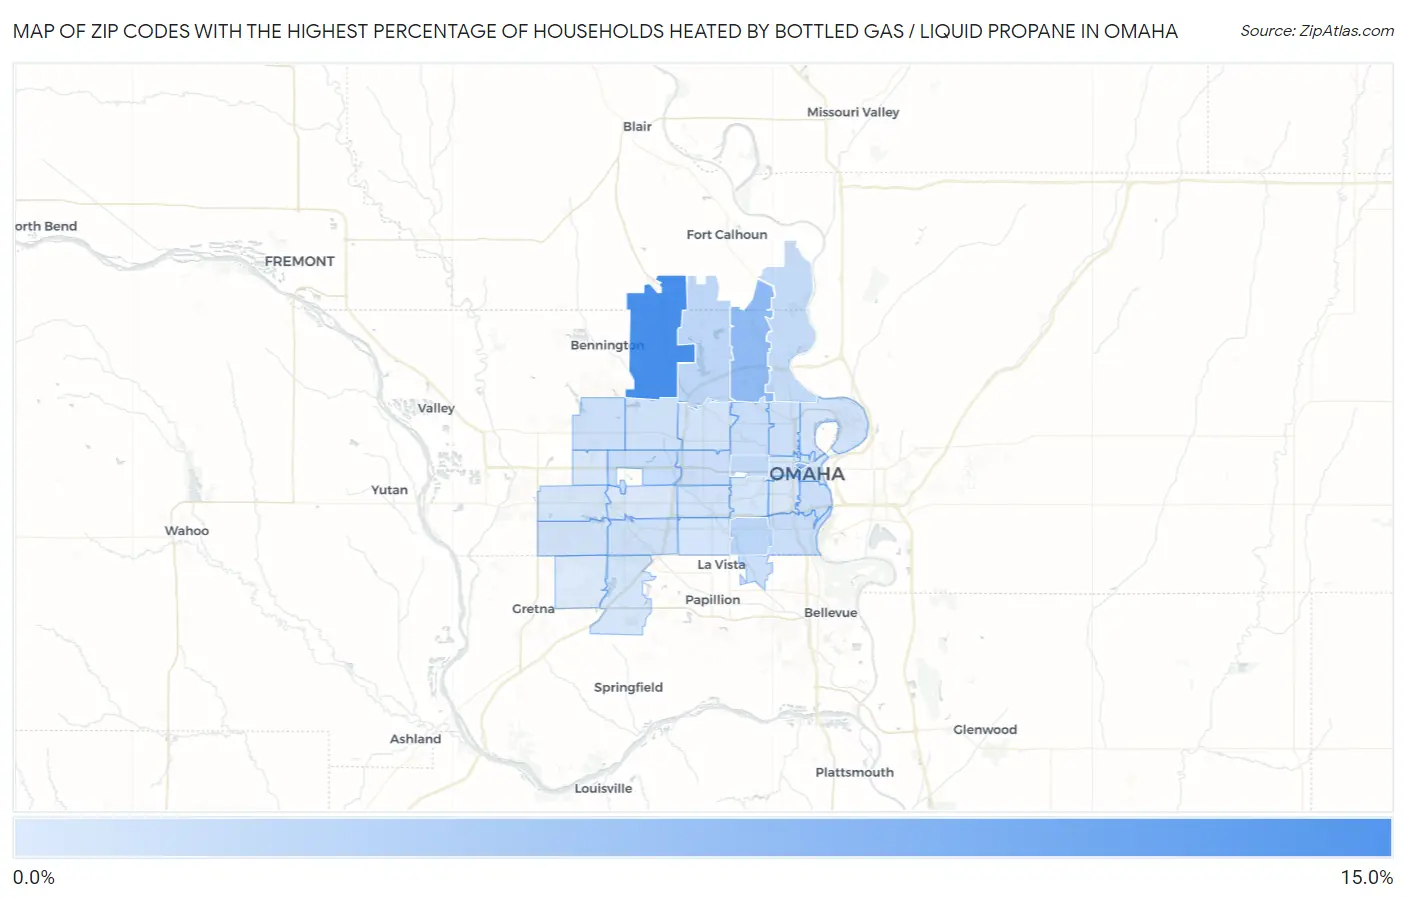
Map of Zip Codes with the Highest Percentage of Households Heated by Bottled Gas / Liquid Propane in Omaha
0.10%
12.6%
Zip Codes with the Highest Percentage of Households Heated by Bottled Gas / Liquid Propane in Omaha, NE
| Zip Code | Bottled Gas / LP Heating | vs State | vs National | |
| 1. | 68142 | 12.6% | 7.1%(+5.50)#383 | 4.9%(+7.70)#12,671 |
| 2. | 68152 | 6.5% | 7.1%(-0.600)#467 | 4.9%(+1.60)#17,175 |
| 3. | 68178 | 6.4% | 7.1%(-0.700)#470 | 4.9%(+1.50)#17,283 |
| 4. | 68117 | 2.8% | 7.1%(-4.30)#515 | 4.9%(-2.10)#21,432 |
| 5. | 68122 | 2.6% | 7.1%(-4.50)#517 | 4.9%(-2.30)#21,790 |
| 6. | 68132 | 2.3% | 7.1%(-4.80)#521 | 4.9%(-2.60)#22,467 |
| 7. | 68112 | 2.1% | 7.1%(-5.00)#522 | 4.9%(-2.80)#22,988 |
| 8. | 68104 | 1.8% | 7.1%(-5.30)#528 | 4.9%(-3.10)#23,706 |
| 9. | 68107 | 1.8% | 7.1%(-5.30)#530 | 4.9%(-3.10)#23,743 |
| 10. | 68154 | 1.7% | 7.1%(-5.40)#532 | 4.9%(-3.20)#24,072 |
| 11. | 68108 | 1.6% | 7.1%(-5.50)#534 | 4.9%(-3.30)#24,480 |
| 12. | 68114 | 1.5% | 7.1%(-5.60)#538 | 4.9%(-3.40)#24,813 |
| 13. | 68116 | 1.4% | 7.1%(-5.70)#540 | 4.9%(-3.50)#25,073 |
| 14. | 68157 | 1.4% | 7.1%(-5.70)#542 | 4.9%(-3.50)#25,277 |
| 15. | 68111 | 1.3% | 7.1%(-5.80)#544 | 4.9%(-3.60)#25,527 |
| 16. | 68164 | 1.2% | 7.1%(-5.90)#546 | 4.9%(-3.70)#25,866 |
| 17. | 68137 | 1.2% | 7.1%(-5.90)#547 | 4.9%(-3.70)#25,913 |
| 18. | 68124 | 1.1% | 7.1%(-6.00)#548 | 4.9%(-3.80)#26,366 |
| 19. | 68135 | 1.0% | 7.1%(-6.10)#550 | 4.9%(-3.90)#26,657 |
| 20. | 68134 | 1.0% | 7.1%(-6.10)#551 | 4.9%(-3.90)#26,662 |
| 21. | 68110 | 1.0% | 7.1%(-6.10)#552 | 4.9%(-3.90)#26,840 |
| 22. | 68127 | 0.90% | 7.1%(-6.20)#554 | 4.9%(-4.00)#27,169 |
| 23. | 68131 | 0.90% | 7.1%(-6.20)#556 | 4.9%(-4.00)#27,238 |
| 24. | 68106 | 0.80% | 7.1%(-6.30)#558 | 4.9%(-4.10)#27,562 |
| 25. | 68138 | 0.80% | 7.1%(-6.30)#560 | 4.9%(-4.10)#27,639 |
| 26. | 68102 | 0.80% | 7.1%(-6.30)#561 | 4.9%(-4.10)#27,660 |
| 27. | 68130 | 0.70% | 7.1%(-6.40)#564 | 4.9%(-4.20)#27,928 |
| 28. | 68144 | 0.50% | 7.1%(-6.60)#567 | 4.9%(-4.40)#28,608 |
| 29. | 68105 | 0.50% | 7.1%(-6.60)#568 | 4.9%(-4.40)#28,636 |
| 30. | 68118 | 0.40% | 7.1%(-6.70)#569 | 4.9%(-4.50)#29,020 |
| 31. | 68136 | 0.10% | 7.1%(-7.00)#571 | 4.9%(-4.80)#29,575 |
1
Common Questions
What are the Top 10 Zip Codes with the Highest Percentage of Households Heated by Bottled Gas / Liquid Propane in Omaha, NE?
Top 10 Zip Codes with the Highest Percentage of Households Heated by Bottled Gas / Liquid Propane in Omaha, NE are:
What zip code has the Highest Percentage of Households Heated by Bottled Gas / Liquid Propane in Omaha, NE?
68142 has the Highest Percentage of Households Heated by Bottled Gas / Liquid Propane in Omaha, NE with 12.6%.
What is the Percentage of Households Heated by Bottled Gas / Liquid Propane in Omaha, NE?
Percentage of Households Heated by Bottled Gas / Liquid Propane in Omaha is 1.2%.
What is the Percentage of Households Heated by Bottled Gas / Liquid Propane in Nebraska?
Percentage of Households Heated by Bottled Gas / Liquid Propane in Nebraska is 7.1%.
What is the Percentage of Households Heated by Bottled Gas / Liquid Propane in the United States?
Percentage of Households Heated by Bottled Gas / Liquid Propane in the United States is 4.9%.