Zip Codes with the Highest Percentage of Population Employed in Computer, Engineering & Science in Omaha, NE

RELATED REPORTS & OPTIONS

Computer, Engineering & Science
Population
Families and Households
Female Fertility
Female Fertility (Unmarried)
Race (Community Size)
Race (Percentage)
Ancestry (Community Size)
AfghanAfricanAlbanianAleutAmericanApacheArabArapahoArgentineanArmenianAustralianAustrianBangladeshiBasqueBelgianBhutaneseBlackfeetBolivianBrazilianBritishBulgarianBurmeseCajunCambodianCanadianCarpatho RusynCentral AmericanCentral American IndianCherokeeChickasawChileanChineseChippewaChoctawColombianComancheCosta RicanCreekCroatianCubanCzechCzechoslovakianDanishDominicanDutchEastern EuropeanEcuadorianEgyptianEnglishEthiopianEuropeanFilipinoFinnishFrenchFrench American IndianFrench CanadianGermanGerman RussianGhanaianGreekGuamanian / ChamorroGuatemalanGuyaneseHaitianHonduranHungarianIcelanderIndian (Asian)IndonesianInupiatIranianIraqiIrishIroquoisIsraeliItalianJamaicanJapaneseJordanianKenyanKiowaKoreanLaotianLatvianLebaneseLithuanianLuxembourgerMacedonianMalaysianMexicanMexican American IndianMoroccanNative HawaiianNavajoNicaraguanNigerianNorthern EuropeanNorwegianPakistaniPalestinianPanamanianPennsylvania GermanPeruvianPolishPortuguesePotawatomiPuebloPuerto RicanRomanianRussianSalvadoranSamoanScandinavianScotch-IrishScottishSeminoleSerbianSiouxSlavicSlovakSloveneSomaliSouth AfricanSouth AmericanSpaniardSpanishSri LankanSubsaharan AfricanSudaneseSwedishSwissSyrianThaiTlingit-HaidaTrinidadian and TobagonianTurkishUkrainianVenezuelanVietnameseWelshWest IndianYugoslavianZimbabwean
Ancestry (Percentage)
AfghanAfricanAlbanianAleutAmericanApacheArabArapahoArgentineanArmenianAustralianAustrianBangladeshiBasqueBelgianBhutaneseBlackfeetBolivianBrazilianBritishBulgarianBurmeseCajunCambodianCanadianCarpatho RusynCentral AmericanCentral American IndianCherokeeChickasawChileanChineseChippewaChoctawColombianComancheCosta RicanCreekCroatianCubanCzechCzechoslovakianDanishDominicanDutchEastern EuropeanEcuadorianEgyptianEnglishEthiopianEuropeanFilipinoFinnishFrenchFrench American IndianFrench CanadianGermanGerman RussianGhanaianGreekGuamanian / ChamorroGuatemalanGuyaneseHaitianHonduranHungarianIcelanderIndian (Asian)IndonesianInupiatIranianIraqiIrishIroquoisIsraeliItalianJamaicanJapaneseJordanianKenyanKiowaKoreanLaotianLatvianLebaneseLithuanianLuxembourgerMacedonianMalaysianMexicanMexican American IndianMoroccanNative HawaiianNavajoNicaraguanNigerianNorthern EuropeanNorwegianPakistaniPalestinianPanamanianPennsylvania GermanPeruvianPolishPortuguesePotawatomiPuebloPuerto RicanRomanianRussianSalvadoranSamoanScandinavianScotch-IrishScottishSeminoleSerbianSiouxSlavicSlovakSloveneSomaliSouth AfricanSouth AmericanSpaniardSpanishSri LankanSubsaharan AfricanSudaneseSwedishSwissSyrianThaiTlingit-HaidaTrinidadian and TobagonianTurkishUkrainianVenezuelanVietnameseWelshWest IndianYugoslavianZimbabwean
Immigrant Origin (Total)
AfghanistanAfricaArgentinaAsiaAustraliaBangladeshBarbadosBelarusBosnia and HerzegovinaBrazilBurma / MyanmarCameroonCanadaCaribbeanCentral AmericaChileChinaColombiaCongoCosta RicaCroatiaCubaCzechoslovakiaDominican RepublicEastern AfricaEastern AsiaEastern EuropeEgyptEl SalvadorEnglandEthiopiaEuropeFranceGermanyGhanaGreeceGuatemalaHondurasHong KongHungaryIndiaIndonesiaIranIraqIrelandIsraelItalyJamaicaJapanJordanKazakhstanKenyaKoreaKuwaitLaosLatin AmericaLatviaLithuaniaMalaysiaMexicoMiddle AfricaMoroccoNepalNetherlandsNicaraguaNigeriaNorthern AfricaNorthern EuropeOceaniaPakistanPanamaPeruPhilippinesPolandPortugalRomaniaRussiaSaudi ArabiaScotlandSierra LeoneSomaliaSouth AfricaSouth AmericaSouth Central AsiaSouth Eastern AsiaSouthern EuropeSpainSri LankaSudanSyriaTaiwanThailandTrinidad and TobagoTurkeyUgandaUkraineVenezuelaVietnamWestern AfricaWestern AsiaWestern EuropeZaireZimbabwe
Immigrant Origin (Percentage)
AfghanistanAfricaArgentinaAsiaAustraliaBangladeshBarbadosBelarusBosnia and HerzegovinaBrazilBurma / MyanmarCameroonCanadaCaribbeanCentral AmericaChileChinaColombiaCongoCosta RicaCroatiaCubaCzechoslovakiaDominican RepublicEastern AfricaEastern AsiaEastern EuropeEgyptEl SalvadorEnglandEthiopiaEuropeFranceGermanyGhanaGreeceGuatemalaHondurasHong KongHungaryIndiaIndonesiaIranIraqIrelandIsraelItalyJamaicaJapanJordanKazakhstanKenyaKoreaKuwaitLaosLatin AmericaLatviaLithuaniaMalaysiaMexicoMiddle AfricaMoroccoNepalNetherlandsNicaraguaNigeriaNorthern AfricaNorthern EuropeOceaniaPakistanPanamaPeruPhilippinesPolandPortugalRomaniaRussiaSaudi ArabiaScotlandSierra LeoneSomaliaSouth AfricaSouth AmericaSouth Central AsiaSouth Eastern AsiaSouthern EuropeSpainSri LankaSudanSyriaTaiwanThailandTrinidad and TobagoTurkeyUgandaUkraineVenezuelaVietnamWestern AfricaWestern AsiaWestern EuropeZaireZimbabwe
Income
Income (Families)
Income (Households)
Poverty
Poverty (Families)
Unemployment
Employment Occupations
Employment Industries
Employer Class
Commute Time
Commute Means
School Enrollment
Education by Degree Field
Occupancy
Finances
Physical Characteristics
Omaha
Compare Zip Codes
Comparison Subject

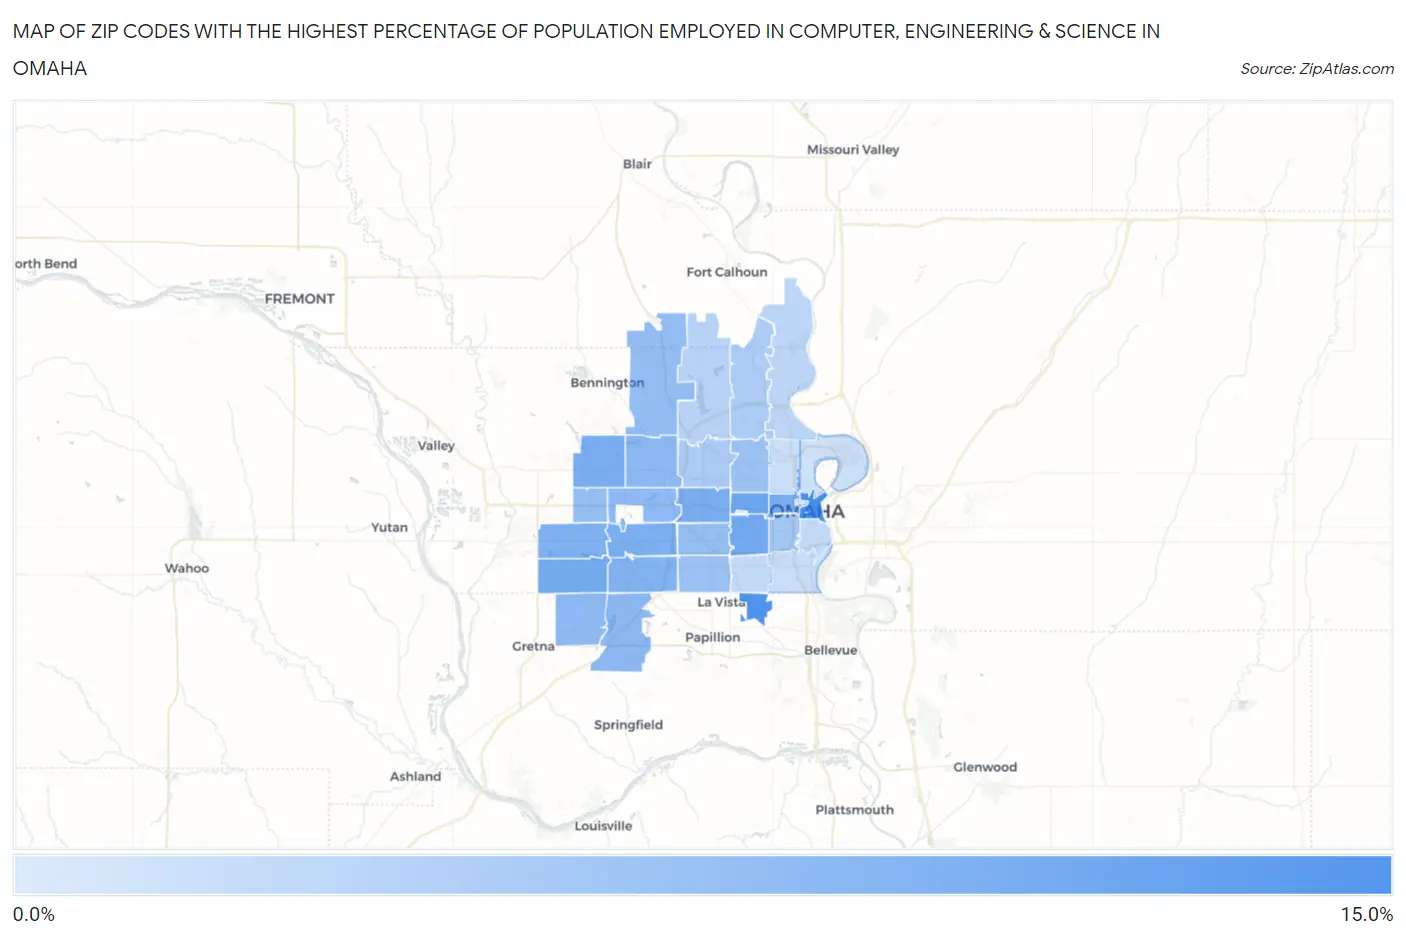
Map of Zip Codes with the Highest Percentage of Population Employed in Computer, Engineering & Science in Omaha

0.0%
15.0%
Zip Codes with the Highest Percentage of Population Employed in Computer, Engineering & Science in Omaha Map

Zip Codes with the Highest Percentage of Population Employed in Computer, Engineering & Science in Omaha, NE

Zip Code % Employed vs State vs National
1.6810214.2%5.7%(+8.48)#106.8%(+7.43)#1,291
2.6815713.6%5.7%(+7.92)#116.8%(+6.88)#1,445
3.6813210.7%5.7%(+5.01)#216.8%(+3.96)#2,715
4.6810610.2%5.7%(+4.44)#276.8%(+3.40)#3,101
5.6813510.0%5.7%(+4.24)#296.8%(+3.20)#3,254
6.681169.5%5.7%(+3.83)#356.8%(+2.78)#3,559
7.681319.5%5.7%(+3.82)#366.8%(+2.78)#3,565
8.681149.4%5.7%(+3.69)#386.8%(+2.65)#3,680
9.681449.2%5.7%(+3.49)#416.8%(+2.45)#3,853
10.681308.8%5.7%(+3.10)#476.8%(+2.05)#4,244
11.681378.5%5.7%(+2.81)#526.8%(+1.77)#4,578
12.681647.8%5.7%(+2.11)#606.8%(+1.07)#5,503
13.681387.7%5.7%(+1.95)#616.8%(+0.904)#5,727
14.681367.6%5.7%(+1.87)#626.8%(+0.827)#5,846
15.681547.6%5.7%(+1.84)#636.8%(+0.790)#5,908
16.681427.2%5.7%(+1.53)#676.8%(+0.479)#6,388
17.681187.0%5.7%(+1.28)#736.8%(+0.237)#6,800
18.681247.0%5.7%(+1.28)#746.8%(+0.230)#6,809
19.681276.5%5.7%(+0.740)#866.8%(-0.305)#7,821
20.681046.2%5.7%(+0.529)#976.8%(-0.517)#8,241
21.681055.7%5.7%(-0.064)#1126.8%(-1.11)#9,660
22.681345.2%5.7%(-0.540)#1296.8%(-1.59)#10,869
23.681524.9%5.7%(-0.808)#1356.8%(-1.85)#11,626
24.681223.9%5.7%(-1.78)#1846.8%(-2.83)#14,675
25.681123.5%5.7%(-2.20)#2066.8%(-3.25)#16,194
26.681823.2%5.7%(-2.53)#2286.8%(-3.57)#17,419
27.681082.9%5.7%(-2.82)#2436.8%(-3.87)#18,506
28.681172.8%5.7%(-2.89)#2516.8%(-3.94)#18,773
29.681072.4%5.7%(-3.29)#2736.8%(-4.33)#20,283
30.681112.2%5.7%(-3.52)#2976.8%(-4.56)#21,091
31.681101.8%5.7%(-3.90)#3276.8%(-4.95)#22,534
32.681780.73%5.7%(-4.99)#4166.8%(-6.03)#25,741

Common Questions

What are the Top 10 Zip Codes with the Highest Percentage of Population Employed in Computer, Engineering & Science in Omaha, NE?
Top 10 Zip Codes with the Highest Percentage of Population Employed in Computer, Engineering & Science in Omaha, NE are:
#1
14.2%
#2
13.6%
#3
10.7%
#4
10.2%
#5
10.0%
#6
9.5%
#7
9.5%
#8
9.4%
#9
9.2%
#10
8.8%
What zip code has the Highest Percentage of Population Employed in Computer, Engineering & Science in Omaha, NE?
68102 has the Highest Percentage of Population Employed in Computer, Engineering & Science in Omaha, NE with 14.2%.
What is the Percentage of Population Employed in Computer, Engineering & Science in Omaha, NE?
Percentage of Population Employed in Computer, Engineering & Science in Omaha is 7.2%.
What is the Percentage of Population Employed in Computer, Engineering & Science in Nebraska?
Percentage of Population Employed in Computer, Engineering & Science in Nebraska is 5.7%.
What is the Percentage of Population Employed in Computer, Engineering & Science in the United States?
Percentage of Population Employed in Computer, Engineering & Science in the United States is 6.8%.