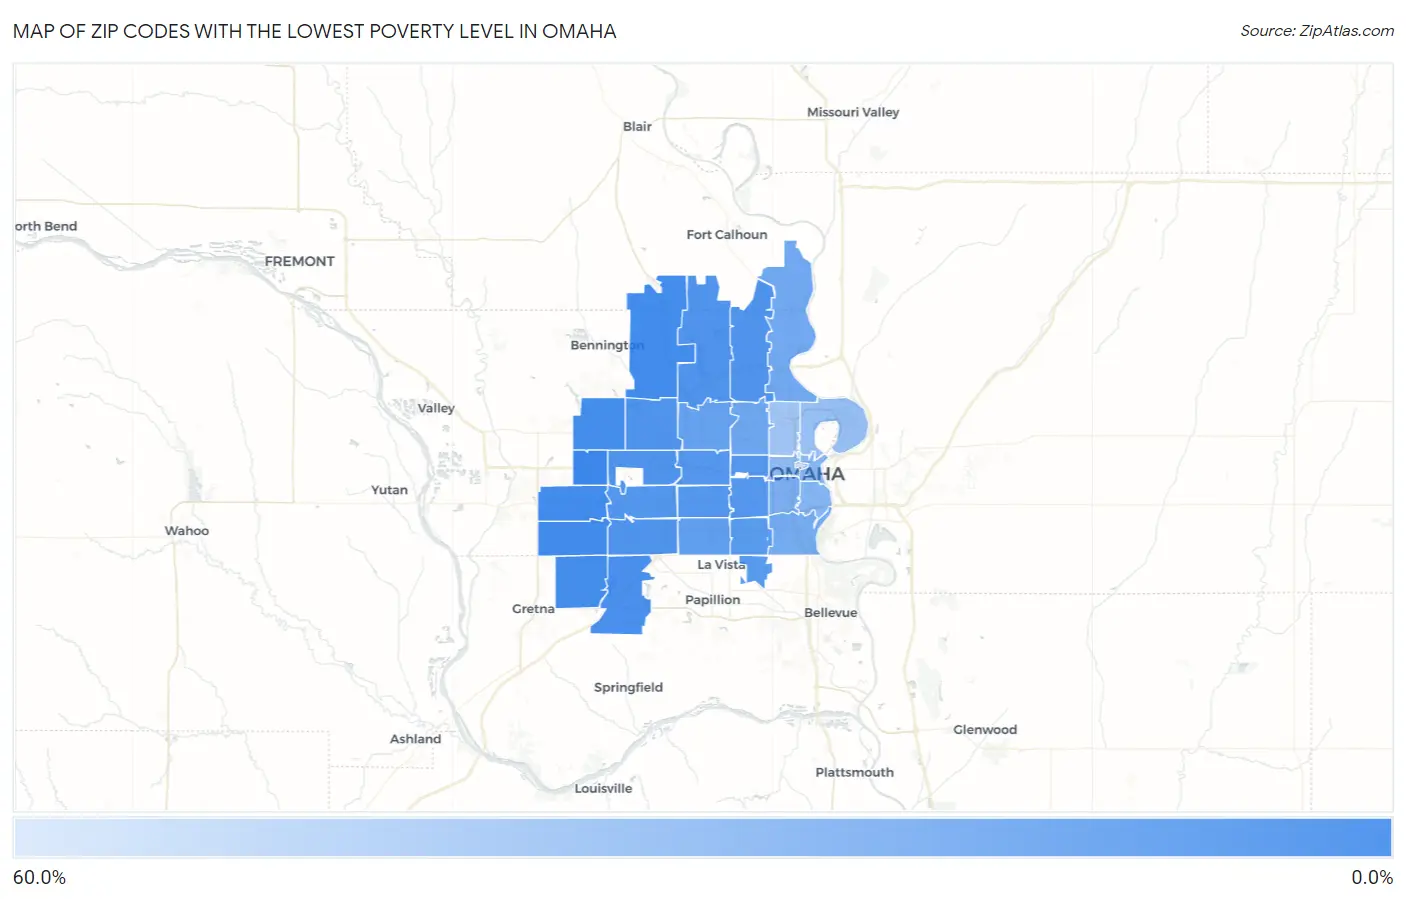
Zip Codes with the Lowest Poverty Level in Omaha, NE
RELATED REPORTS & OPTIONS
Lowest Poverty
Omaha
Compare Zip Codes
Map of Zip Codes with the Lowest Poverty Level in Omaha
53.5%
0.73%
Zip Codes with the Lowest Poverty Level in Omaha, NE
| Zip Code | Poverty | vs State | vs National | |
| 1. | 68118 | 0.73% | 10.4%(-9.67)#4 | 12.5%(-11.8)#138 |
| 2. | 68135 | 2.4% | 10.4%(-7.99)#39 | 12.5%(-10.1)#1,148 |
| 3. | 68130 | 2.6% | 10.4%(-7.83)#45 | 12.5%(-9.96)#1,324 |
| 4. | 68142 | 3.0% | 10.4%(-7.43)#60 | 12.5%(-9.56)#1,759 |
| 5. | 68136 | 3.1% | 10.4%(-7.30)#67 | 12.5%(-9.43)#1,931 |
| 6. | 68116 | 3.6% | 10.4%(-6.79)#95 | 12.5%(-8.92)#2,659 |
| 7. | 68138 | 5.0% | 10.4%(-5.45)#141 | 12.5%(-7.58)#4,735 |
| 8. | 68152 | 5.8% | 10.4%(-4.57)#177 | 12.5%(-6.71)#6,231 |
| 9. | 68122 | 5.8% | 10.4%(-4.57)#178 | 12.5%(-6.71)#6,235 |
| 10. | 68164 | 6.3% | 10.4%(-4.07)#195 | 12.5%(-6.20)#7,127 |
| 11. | 68154 | 6.5% | 10.4%(-3.93)#199 | 12.5%(-6.07)#7,371 |
| 12. | 68137 | 6.6% | 10.4%(-3.83)#209 | 12.5%(-5.97)#7,548 |
| 13. | 68144 | 7.4% | 10.4%(-3.05)#239 | 12.5%(-5.18)#9,006 |
| 14. | 68106 | 8.1% | 10.4%(-2.28)#268 | 12.5%(-4.41)#10,422 |
| 15. | 68114 | 8.1% | 10.4%(-2.27)#269 | 12.5%(-4.41)#10,431 |
| 16. | 68124 | 8.2% | 10.4%(-2.24)#271 | 12.5%(-4.38)#10,478 |
| 17. | 68132 | 8.5% | 10.4%(-1.94)#280 | 12.5%(-4.08)#11,035 |
| 18. | 68117 | 9.7% | 10.4%(-0.734)#323 | 12.5%(-2.87)#13,168 |
| 19. | 68157 | 9.7% | 10.4%(-0.704)#326 | 12.5%(-2.84)#13,226 |
| 20. | 68127 | 11.8% | 10.4%(+1.37)#403 | 12.5%(-0.762)#16,577 |
| 21. | 68134 | 13.2% | 10.4%(+2.82)#434 | 12.5%(+0.683)#18,617 |
| 22. | 68104 | 16.0% | 10.4%(+5.63)#487 | 12.5%(+3.49)#21,846 |
| 23. | 68112 | 16.6% | 10.4%(+6.25)#493 | 12.5%(+4.11)#22,465 |
| 24. | 68107 | 18.6% | 10.4%(+8.17)#508 | 12.5%(+6.04)#24,090 |
| 25. | 68105 | 19.6% | 10.4%(+9.24)#514 | 12.5%(+7.10)#24,855 |
| 26. | 68108 | 23.5% | 10.4%(+13.1)#534 | 12.5%(+11.0)#26,967 |
| 27. | 68102 | 25.8% | 10.4%(+15.4)#538 | 12.5%(+13.3)#27,826 |
| 28. | 68131 | 28.1% | 10.4%(+17.7)#542 | 12.5%(+15.6)#28,417 |
| 29. | 68110 | 30.9% | 10.4%(+20.5)#544 | 12.5%(+18.4)#28,984 |
| 30. | 68111 | 34.3% | 10.4%(+23.9)#545 | 12.5%(+21.7)#29,546 |
| 31. | 68178 | 53.5% | 10.4%(+43.1)#550 | 12.5%(+40.9)#30,710 |
1
Common Questions
What are the Top 10 Zip Codes with the Lowest Poverty Level in Omaha, NE?
Top 10 Zip Codes with the Lowest Poverty Level in Omaha, NE are:
What zip code has the Lowest Poverty Level in Omaha, NE?
68118 has the Lowest Poverty Level in Omaha, NE with 0.73%.
What is the Poverty Level in Omaha, NE?
Poverty Level in Omaha is 12.5%.
What is the Poverty Level in Nebraska?
Poverty Level in Nebraska is 10.4%.
What is the Poverty Level in the United States?
Poverty Level in the United States is 12.5%.