Zip Codes with the Highest Percentage of Not-for-profit Organizations in Omaha, NE

RELATED REPORTS & OPTIONS

Not-for-profit Organizations
Population
Families and Households
Female Fertility
Female Fertility (Unmarried)
Race (Community Size)
Race (Percentage)
Ancestry (Community Size)
AfghanAfricanAlbanianAleutAmericanApacheArabArapahoArgentineanArmenianAustralianAustrianBangladeshiBasqueBelgianBhutaneseBlackfeetBolivianBrazilianBritishBulgarianBurmeseCajunCambodianCanadianCarpatho RusynCentral AmericanCentral American IndianCherokeeChickasawChileanChineseChippewaChoctawColombianComancheCosta RicanCreekCroatianCubanCzechCzechoslovakianDanishDominicanDutchEastern EuropeanEcuadorianEgyptianEnglishEthiopianEuropeanFilipinoFinnishFrenchFrench American IndianFrench CanadianGermanGerman RussianGhanaianGreekGuamanian / ChamorroGuatemalanGuyaneseHaitianHonduranHungarianIcelanderIndian (Asian)IndonesianInupiatIranianIraqiIrishIroquoisIsraeliItalianJamaicanJapaneseJordanianKenyanKiowaKoreanLaotianLatvianLebaneseLithuanianLuxembourgerMacedonianMalaysianMexicanMexican American IndianMoroccanNative HawaiianNavajoNicaraguanNigerianNorthern EuropeanNorwegianPakistaniPalestinianPanamanianPennsylvania GermanPeruvianPolishPortuguesePotawatomiPuebloPuerto RicanRomanianRussianSalvadoranSamoanScandinavianScotch-IrishScottishSeminoleSerbianSiouxSlavicSlovakSloveneSomaliSouth AfricanSouth AmericanSpaniardSpanishSri LankanSubsaharan AfricanSudaneseSwedishSwissSyrianThaiTlingit-HaidaTrinidadian and TobagonianTurkishUkrainianVenezuelanVietnameseWelshWest IndianYugoslavianZimbabwean
Ancestry (Percentage)
AfghanAfricanAlbanianAleutAmericanApacheArabArapahoArgentineanArmenianAustralianAustrianBangladeshiBasqueBelgianBhutaneseBlackfeetBolivianBrazilianBritishBulgarianBurmeseCajunCambodianCanadianCarpatho RusynCentral AmericanCentral American IndianCherokeeChickasawChileanChineseChippewaChoctawColombianComancheCosta RicanCreekCroatianCubanCzechCzechoslovakianDanishDominicanDutchEastern EuropeanEcuadorianEgyptianEnglishEthiopianEuropeanFilipinoFinnishFrenchFrench American IndianFrench CanadianGermanGerman RussianGhanaianGreekGuamanian / ChamorroGuatemalanGuyaneseHaitianHonduranHungarianIcelanderIndian (Asian)IndonesianInupiatIranianIraqiIrishIroquoisIsraeliItalianJamaicanJapaneseJordanianKenyanKiowaKoreanLaotianLatvianLebaneseLithuanianLuxembourgerMacedonianMalaysianMexicanMexican American IndianMoroccanNative HawaiianNavajoNicaraguanNigerianNorthern EuropeanNorwegianPakistaniPalestinianPanamanianPennsylvania GermanPeruvianPolishPortuguesePotawatomiPuebloPuerto RicanRomanianRussianSalvadoranSamoanScandinavianScotch-IrishScottishSeminoleSerbianSiouxSlavicSlovakSloveneSomaliSouth AfricanSouth AmericanSpaniardSpanishSri LankanSubsaharan AfricanSudaneseSwedishSwissSyrianThaiTlingit-HaidaTrinidadian and TobagonianTurkishUkrainianVenezuelanVietnameseWelshWest IndianYugoslavianZimbabwean
Immigrant Origin (Total)
AfghanistanAfricaArgentinaAsiaAustraliaBangladeshBarbadosBelarusBosnia and HerzegovinaBrazilBurma / MyanmarCameroonCanadaCaribbeanCentral AmericaChileChinaColombiaCongoCosta RicaCroatiaCubaCzechoslovakiaDominican RepublicEastern AfricaEastern AsiaEastern EuropeEgyptEl SalvadorEnglandEthiopiaEuropeFranceGermanyGhanaGreeceGuatemalaHondurasHong KongHungaryIndiaIndonesiaIranIraqIrelandIsraelItalyJamaicaJapanJordanKazakhstanKenyaKoreaKuwaitLaosLatin AmericaLatviaLithuaniaMalaysiaMexicoMiddle AfricaMoroccoNepalNetherlandsNicaraguaNigeriaNorthern AfricaNorthern EuropeOceaniaPakistanPanamaPeruPhilippinesPolandPortugalRomaniaRussiaSaudi ArabiaScotlandSierra LeoneSomaliaSouth AfricaSouth AmericaSouth Central AsiaSouth Eastern AsiaSouthern EuropeSpainSri LankaSudanSyriaTaiwanThailandTrinidad and TobagoTurkeyUgandaUkraineVenezuelaVietnamWestern AfricaWestern AsiaWestern EuropeZaireZimbabwe
Immigrant Origin (Percentage)
AfghanistanAfricaArgentinaAsiaAustraliaBangladeshBarbadosBelarusBosnia and HerzegovinaBrazilBurma / MyanmarCameroonCanadaCaribbeanCentral AmericaChileChinaColombiaCongoCosta RicaCroatiaCubaCzechoslovakiaDominican RepublicEastern AfricaEastern AsiaEastern EuropeEgyptEl SalvadorEnglandEthiopiaEuropeFranceGermanyGhanaGreeceGuatemalaHondurasHong KongHungaryIndiaIndonesiaIranIraqIrelandIsraelItalyJamaicaJapanJordanKazakhstanKenyaKoreaKuwaitLaosLatin AmericaLatviaLithuaniaMalaysiaMexicoMiddle AfricaMoroccoNepalNetherlandsNicaraguaNigeriaNorthern AfricaNorthern EuropeOceaniaPakistanPanamaPeruPhilippinesPolandPortugalRomaniaRussiaSaudi ArabiaScotlandSierra LeoneSomaliaSouth AfricaSouth AmericaSouth Central AsiaSouth Eastern AsiaSouthern EuropeSpainSri LankaSudanSyriaTaiwanThailandTrinidad and TobagoTurkeyUgandaUkraineVenezuelaVietnamWestern AfricaWestern AsiaWestern EuropeZaireZimbabwe
Income
Income (Families)
Income (Households)
Poverty
Poverty (Families)
Unemployment
Employment Occupations
Employment Industries
Employer Class
Commute Time
Commute Means
School Enrollment
Education by Degree Field
Occupancy
Finances
Physical Characteristics
Omaha
Compare Zip Codes
Comparison Subject

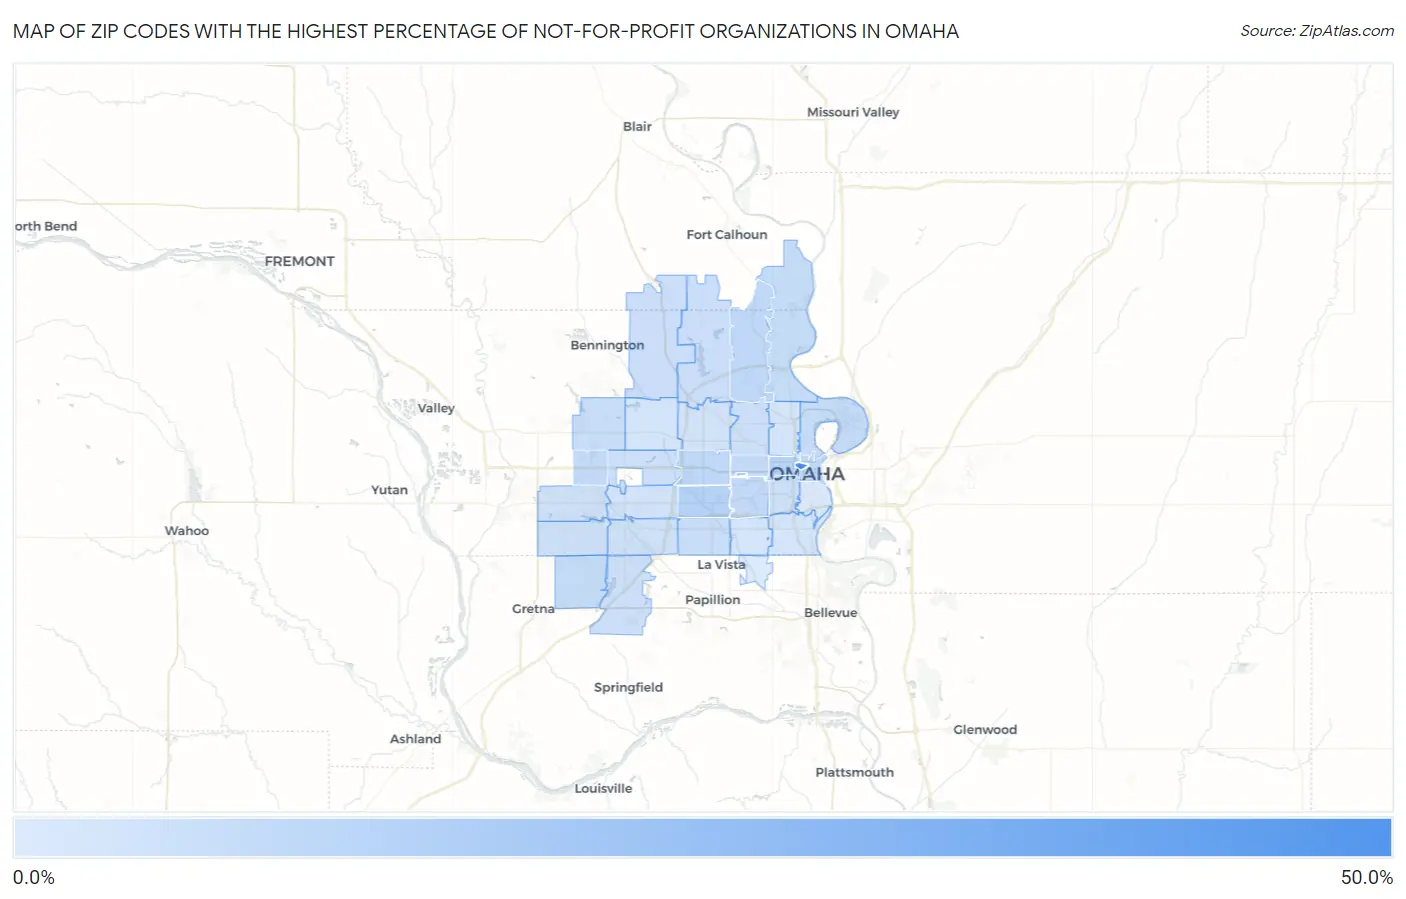
Map of Zip Codes with the Highest Percentage of Not-for-profit Organizations in Omaha

0.0%
50.0%
Zip Codes with the Highest Percentage of Not-for-profit Organizations in Omaha Map

Zip Codes with the Highest Percentage of Not-for-profit Organizations in Omaha, NE

Zip Code % Employed in Not-for-profit vs State vs National
1.6817847.9%9.5%(+38.4)#38.4%(+39.5)#157
2.6818222.6%9.5%(+13.1)#128.4%(+14.1)#938
3.6812416.0%9.5%(+6.48)#348.4%(+7.56)#2,445
4.6813115.7%9.5%(+6.18)#398.4%(+7.26)#2,577
5.6811413.9%9.5%(+4.39)#568.4%(+5.47)#3,662
6.6810213.8%9.5%(+4.30)#598.4%(+5.38)#3,732
7.6815213.7%9.5%(+4.22)#618.4%(+5.30)#3,811
8.6813213.3%9.5%(+3.81)#738.4%(+4.89)#4,191
9.6810613.3%9.5%(+3.76)#758.4%(+4.84)#4,233
10.6811812.8%9.5%(+3.25)#888.4%(+4.33)#4,739
11.6811012.2%9.5%(+2.66)#1088.4%(+3.74)#5,391
12.6813612.1%9.5%(+2.56)#1148.4%(+3.64)#5,527
13.6811211.7%9.5%(+2.17)#1248.4%(+3.25)#6,052
14.6812711.6%9.5%(+2.03)#1298.4%(+3.11)#6,246
15.6811611.4%9.5%(+1.91)#1338.4%(+2.99)#6,410
16.6814210.9%9.5%(+1.38)#1438.4%(+2.46)#7,211
17.6812210.7%9.5%(+1.14)#1488.4%(+2.22)#7,631
18.6815410.5%9.5%(+1.00)#1518.4%(+2.08)#7,854
19.6810410.5%9.5%(+0.998)#1528.4%(+2.08)#7,873
20.6813810.5%9.5%(+0.994)#1538.4%(+2.07)#7,877
21.6810510.2%9.5%(+0.686)#1618.4%(+1.77)#8,483
22.681309.8%9.5%(+0.276)#1748.4%(+1.36)#9,307
23.681379.8%9.5%(+0.235)#1778.4%(+1.32)#9,392
24.681359.7%9.5%(+0.212)#1818.4%(+1.29)#9,443
25.681449.4%9.5%(-0.101)#1928.4%(+0.980)#10,114
26.681349.4%9.5%(-0.102)#1938.4%(+0.978)#10,119
27.681118.8%9.5%(-0.754)#2288.4%(+0.327)#11,630
28.681648.6%9.5%(-0.887)#2338.4%(+0.194)#11,941
29.681078.5%9.5%(-1.05)#2368.4%(+0.036)#12,322
30.681178.4%9.5%(-1.16)#2488.4%(-0.084)#12,665
31.681087.7%9.5%(-1.87)#2878.4%(-0.788)#14,603
32.681576.4%9.5%(-3.09)#3498.4%(-2.01)#18,222

Common Questions

What are the Top 10 Zip Codes with the Highest Percentage of Not-for-profit Organizations in Omaha, NE?
Top 10 Zip Codes with the Highest Percentage of Not-for-profit Organizations in Omaha, NE are:
#1
47.9%
#2
22.6%
#3
16.0%
#4
15.7%
#5
13.9%
#6
13.8%
#7
13.7%
#8
13.3%
#9
13.3%
#10
12.8%
What zip code has the Highest Percentage of Not-for-profit Organizations in Omaha, NE?
68178 has the Highest Percentage of Not-for-profit Organizations in Omaha, NE with 47.9%.
What is the Percentage of Not-for-profit Organizations in Omaha, NE?
Percentage of Not-for-profit Organizations in Omaha is 11.0%.
What is the Percentage of Not-for-profit Organizations in Nebraska?
Percentage of Not-for-profit Organizations in Nebraska is 9.5%.
What is the Percentage of Not-for-profit Organizations in the United States?
Percentage of Not-for-profit Organizations in the United States is 8.4%.