Zip Codes with the Shortest Median Commute Time to Work for Females in Omaha, NE

RELATED REPORTS & OPTIONS

Shortest Commute | Female
Population
Families and Households
Female Fertility
Female Fertility (Unmarried)
Race (Community Size)
Race (Percentage)
Ancestry (Community Size)
AfghanAfricanAlbanianAleutAmericanApacheArabArapahoArgentineanArmenianAustralianAustrianBangladeshiBasqueBelgianBhutaneseBlackfeetBolivianBrazilianBritishBulgarianBurmeseCajunCambodianCanadianCarpatho RusynCentral AmericanCentral American IndianCherokeeChickasawChileanChineseChippewaChoctawColombianComancheCosta RicanCreekCroatianCubanCzechCzechoslovakianDanishDominicanDutchEastern EuropeanEcuadorianEgyptianEnglishEthiopianEuropeanFilipinoFinnishFrenchFrench American IndianFrench CanadianGermanGerman RussianGhanaianGreekGuamanian / ChamorroGuatemalanGuyaneseHaitianHonduranHungarianIcelanderIndian (Asian)IndonesianInupiatIranianIraqiIrishIroquoisIsraeliItalianJamaicanJapaneseJordanianKenyanKiowaKoreanLaotianLatvianLebaneseLithuanianLuxembourgerMacedonianMalaysianMexicanMexican American IndianMoroccanNative HawaiianNavajoNicaraguanNigerianNorthern EuropeanNorwegianPakistaniPalestinianPanamanianPennsylvania GermanPeruvianPolishPortuguesePotawatomiPuebloPuerto RicanRomanianRussianSalvadoranSamoanScandinavianScotch-IrishScottishSeminoleSerbianSiouxSlavicSlovakSloveneSomaliSouth AfricanSouth AmericanSpaniardSpanishSri LankanSubsaharan AfricanSudaneseSwedishSwissSyrianThaiTlingit-HaidaTrinidadian and TobagonianTurkishUkrainianVenezuelanVietnameseWelshWest IndianYugoslavianZimbabwean
Ancestry (Percentage)
AfghanAfricanAlbanianAleutAmericanApacheArabArapahoArgentineanArmenianAustralianAustrianBangladeshiBasqueBelgianBhutaneseBlackfeetBolivianBrazilianBritishBulgarianBurmeseCajunCambodianCanadianCarpatho RusynCentral AmericanCentral American IndianCherokeeChickasawChileanChineseChippewaChoctawColombianComancheCosta RicanCreekCroatianCubanCzechCzechoslovakianDanishDominicanDutchEastern EuropeanEcuadorianEgyptianEnglishEthiopianEuropeanFilipinoFinnishFrenchFrench American IndianFrench CanadianGermanGerman RussianGhanaianGreekGuamanian / ChamorroGuatemalanGuyaneseHaitianHonduranHungarianIcelanderIndian (Asian)IndonesianInupiatIranianIraqiIrishIroquoisIsraeliItalianJamaicanJapaneseJordanianKenyanKiowaKoreanLaotianLatvianLebaneseLithuanianLuxembourgerMacedonianMalaysianMexicanMexican American IndianMoroccanNative HawaiianNavajoNicaraguanNigerianNorthern EuropeanNorwegianPakistaniPalestinianPanamanianPennsylvania GermanPeruvianPolishPortuguesePotawatomiPuebloPuerto RicanRomanianRussianSalvadoranSamoanScandinavianScotch-IrishScottishSeminoleSerbianSiouxSlavicSlovakSloveneSomaliSouth AfricanSouth AmericanSpaniardSpanishSri LankanSubsaharan AfricanSudaneseSwedishSwissSyrianThaiTlingit-HaidaTrinidadian and TobagonianTurkishUkrainianVenezuelanVietnameseWelshWest IndianYugoslavianZimbabwean
Immigrant Origin (Total)
AfghanistanAfricaArgentinaAsiaAustraliaBangladeshBarbadosBelarusBosnia and HerzegovinaBrazilBurma / MyanmarCameroonCanadaCaribbeanCentral AmericaChileChinaColombiaCongoCosta RicaCroatiaCubaCzechoslovakiaDominican RepublicEastern AfricaEastern AsiaEastern EuropeEgyptEl SalvadorEnglandEthiopiaEuropeFranceGermanyGhanaGreeceGuatemalaHondurasHong KongHungaryIndiaIndonesiaIranIraqIrelandIsraelItalyJamaicaJapanJordanKazakhstanKenyaKoreaKuwaitLaosLatin AmericaLatviaLithuaniaMalaysiaMexicoMiddle AfricaMoroccoNepalNetherlandsNicaraguaNigeriaNorthern AfricaNorthern EuropeOceaniaPakistanPanamaPeruPhilippinesPolandPortugalRomaniaRussiaSaudi ArabiaScotlandSierra LeoneSomaliaSouth AfricaSouth AmericaSouth Central AsiaSouth Eastern AsiaSouthern EuropeSpainSri LankaSudanSyriaTaiwanThailandTrinidad and TobagoTurkeyUgandaUkraineVenezuelaVietnamWestern AfricaWestern AsiaWestern EuropeZaireZimbabwe
Immigrant Origin (Percentage)
AfghanistanAfricaArgentinaAsiaAustraliaBangladeshBarbadosBelarusBosnia and HerzegovinaBrazilBurma / MyanmarCameroonCanadaCaribbeanCentral AmericaChileChinaColombiaCongoCosta RicaCroatiaCubaCzechoslovakiaDominican RepublicEastern AfricaEastern AsiaEastern EuropeEgyptEl SalvadorEnglandEthiopiaEuropeFranceGermanyGhanaGreeceGuatemalaHondurasHong KongHungaryIndiaIndonesiaIranIraqIrelandIsraelItalyJamaicaJapanJordanKazakhstanKenyaKoreaKuwaitLaosLatin AmericaLatviaLithuaniaMalaysiaMexicoMiddle AfricaMoroccoNepalNetherlandsNicaraguaNigeriaNorthern AfricaNorthern EuropeOceaniaPakistanPanamaPeruPhilippinesPolandPortugalRomaniaRussiaSaudi ArabiaScotlandSierra LeoneSomaliaSouth AfricaSouth AmericaSouth Central AsiaSouth Eastern AsiaSouthern EuropeSpainSri LankaSudanSyriaTaiwanThailandTrinidad and TobagoTurkeyUgandaUkraineVenezuelaVietnamWestern AfricaWestern AsiaWestern EuropeZaireZimbabwe
Income
Income (Families)
Income (Households)
Poverty
Poverty (Families)
Unemployment
Employment Occupations
Employment Industries
Employer Class
Commute Time
Commute Means
School Enrollment
Education by Degree Field
Occupancy
Finances
Physical Characteristics
Omaha
Compare Zip Codes
Comparison Subject

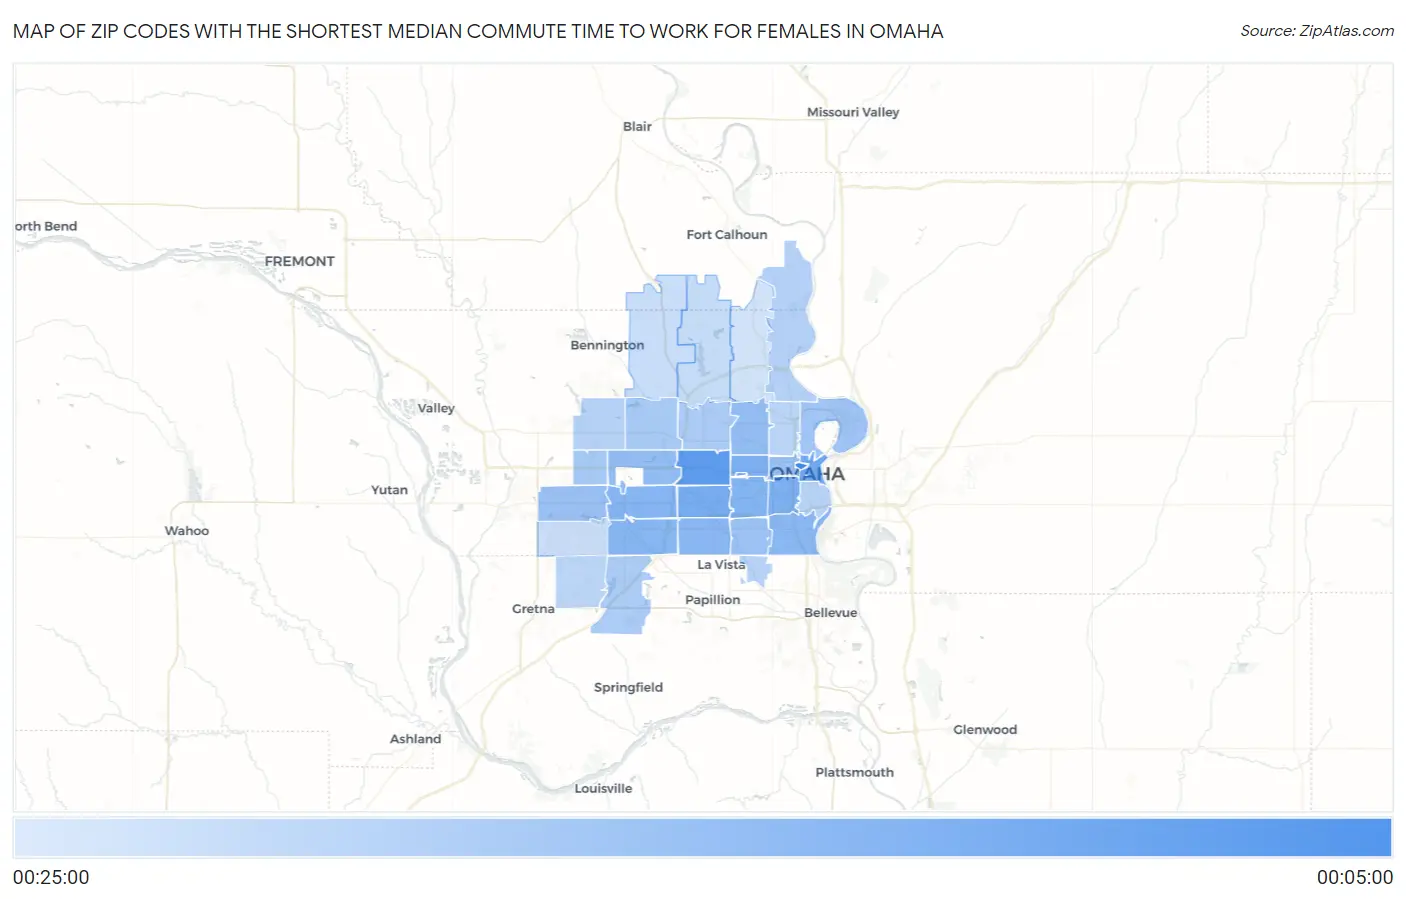
Map of Zip Codes with the Shortest Median Commute Time to Work for Females in Omaha

00:25:00
00:00:00
Zip Codes with the Shortest Median Commute Time to Work for Females in Omaha Map

Zip Codes with the Shortest Median Commute Time to Work for Females in Omaha, NE

Zip Code Commute Time vs State vs National
1.6817800:13:0800:18:09(-5.01)#4600:24:50(-11.7)#1,396
2.6811400:14:5500:18:09(-3.23)#8500:24:50(-9.91)#2,290
3.6818200:15:0500:18:09(-3.06)#9100:24:50(-9.75)#2,382
4.6810200:15:5700:18:09(-2.19)#11200:24:50(-8.88)#2,988
5.6812400:16:2700:18:09(-1.69)#13000:24:50(-8.38)#3,429
6.6810500:16:3900:18:09(-1.49)#13700:24:50(-8.18)#3,620
7.6813200:16:5300:18:09(-1.27)#14300:24:50(-7.96)#3,833
8.6810600:17:0300:18:09(-1.09)#14700:24:50(-7.78)#4,016
9.6814400:17:1300:18:09(-0.922)#15300:24:50(-7.61)#4,176
10.6813700:17:2500:18:09(-0.721)#15800:24:50(-7.41)#4,380
11.6812700:17:3200:18:09(-0.608)#16200:24:50(-7.30)#4,499
12.6810700:17:3600:18:09(-0.541)#16400:24:50(-7.23)#4,576
13.6815400:18:0900:18:09(+0.010)#18600:24:50(-6.68)#5,216
14.6810400:18:1000:18:09(+0.029)#18800:24:50(-6.66)#5,248
15.6813000:18:3300:18:09(+0.410)#20600:24:50(-6.28)#5,731
16.6813100:18:3400:18:09(+0.423)#20800:24:50(-6.27)#5,757
17.6811700:18:4900:18:09(+0.670)#21300:24:50(-6.02)#6,093
18.6811000:19:0700:18:09(+0.976)#22100:24:50(-5.71)#6,531
19.6811800:19:3600:18:09(+1.45)#23800:24:50(-5.24)#7,278
20.6816400:19:3900:18:09(+1.51)#24100:24:50(-5.18)#7,357
21.6813400:19:4600:18:09(+1.62)#24500:24:50(-5.06)#7,541
22.6813800:19:5700:18:09(+1.80)#24900:24:50(-4.89)#7,789
23.6811200:20:2200:18:09(+2.22)#26500:24:50(-4.47)#8,490
24.6810800:20:3200:18:09(+2.40)#26800:24:50(-4.29)#8,771
25.6811600:20:4100:18:09(+2.54)#27500:24:50(-4.15)#9,024
26.6815700:20:4400:18:09(+2.59)#27700:24:50(-4.09)#9,115
27.6811100:20:5400:18:09(+2.75)#28000:24:50(-3.94)#9,383
28.6813600:21:1400:18:09(+3.09)#29300:24:50(-3.60)#9,978
29.6812200:21:5000:18:09(+3.70)#31600:24:50(-2.99)#11,115
30.6814200:22:0400:18:09(+3.93)#32300:24:50(-2.76)#11,523
31.6813500:22:1100:18:09(+4.03)#33000:24:50(-2.66)#11,749
32.6815200:22:4700:18:09(+4.63)#34800:24:50(-2.06)#12,873

Common Questions

What are the Top 10 Zip Codes with the Shortest Median Commute Time to Work for Females in Omaha, NE?
Top 10 Zip Codes with the Shortest Median Commute Time to Work for Females in Omaha, NE are:
#1
00:13:08
#2
00:14:55
#3
00:15:05
#4
00:15:57
#5
00:16:27
#6
00:16:39
#7
00:16:53
#8
00:17:03
#9
00:17:13
#10
00:17:25
What zip code has the Shortest Median Commute Time to Work for Females in Omaha, NE?
68178 has the Shortest Median Commute Time to Work for Females in Omaha, NE with 00:13:08.
What is the Median Commute Time to Work for Females in Omaha, NE?
Median Commute Time to Work for Females in Omaha is 00:18:33.
What is the Median Commute Time to Work for Females in Nebraska?
Median Commute Time to Work for Females in Nebraska is 00:18:09.
What is the Median Commute Time to Work for Females in the United States?
Median Commute Time to Work for Females in the United States is 00:24:50.