Zip Codes with the Highest Percentage of Households Without a Vehicle in Omaha, NE
RELATED REPORTS & OPTIONS
Households without a Cars
Omaha
Compare Zip Codes
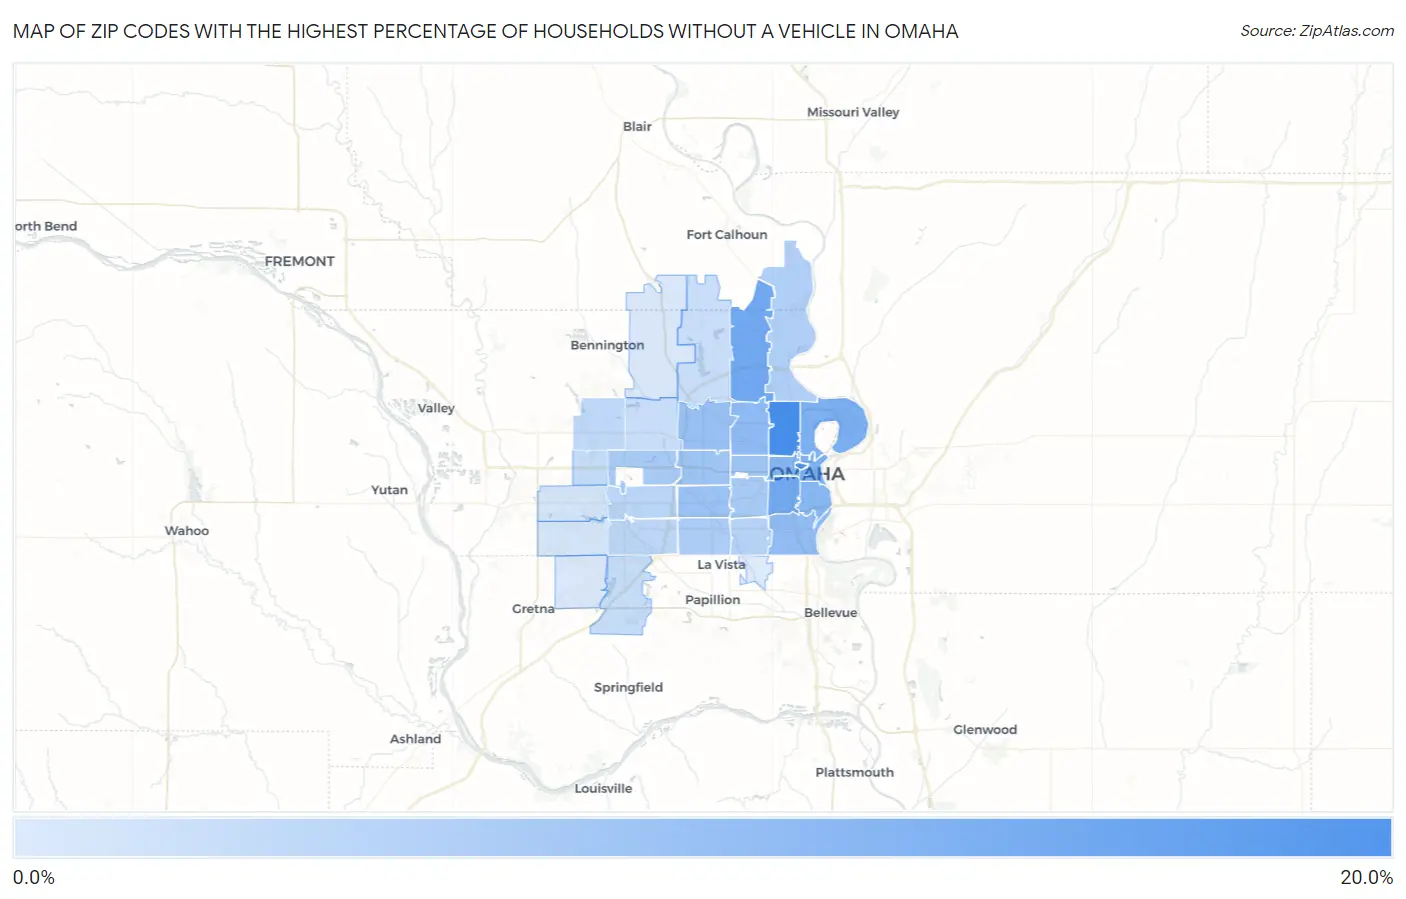
Map of Zip Codes with the Highest Percentage of Households Without a Vehicle in Omaha
0.50%
18.0%
Zip Codes with the Highest Percentage of Households Without a Vehicle in Omaha, NE
| Zip Code | Housholds Without a Car | vs State | vs National | |
| 1. | 68111 | 18.0% | 5.1%(+12.9)#6 | 8.3%(+9.70)#1,776 |
| 2. | 68178 | 17.3% | 5.1%(+12.2)#7 | 8.3%(+9.00)#1,903 |
| 3. | 68152 | 12.8% | 5.1%(+7.70)#16 | 8.3%(+4.50)#3,192 |
| 4. | 68105 | 12.7% | 5.1%(+7.60)#18 | 8.3%(+4.40)#3,225 |
| 5. | 68110 | 11.6% | 5.1%(+6.50)#19 | 8.3%(+3.30)#3,775 |
| 6. | 68102 | 11.5% | 5.1%(+6.40)#20 | 8.3%(+3.20)#3,839 |
| 7. | 68108 | 10.2% | 5.1%(+5.10)#24 | 8.3%(+1.90)#4,710 |
| 8. | 68131 | 10.1% | 5.1%(+5.00)#26 | 8.3%(+1.80)#4,792 |
| 9. | 68104 | 9.2% | 5.1%(+4.10)#31 | 8.3%(+0.900)#5,514 |
| 10. | 68107 | 8.9% | 5.1%(+3.80)#34 | 8.3%(+0.600)#5,839 |
| 11. | 68134 | 8.2% | 5.1%(+3.10)#43 | 8.3%(-0.100)#6,653 |
| 12. | 68124 | 8.0% | 5.1%(+2.90)#44 | 8.3%(-0.300)#6,945 |
| 13. | 68114 | 7.5% | 5.1%(+2.40)#58 | 8.3%(-0.800)#7,722 |
| 14. | 68132 | 7.3% | 5.1%(+2.20)#61 | 8.3%(-1.00)#8,068 |
| 15. | 68154 | 6.4% | 5.1%(+1.30)#76 | 8.3%(-1.90)#9,588 |
| 16. | 68106 | 6.4% | 5.1%(+1.30)#77 | 8.3%(-1.90)#9,595 |
| 17. | 68127 | 5.9% | 5.1%(+0.800)#89 | 8.3%(-2.40)#10,704 |
| 18. | 68112 | 5.3% | 5.1%(+0.200)#105 | 8.3%(-3.00)#12,156 |
| 19. | 68117 | 4.7% | 5.1%(-0.400)#130 | 8.3%(-3.60)#13,732 |
| 20. | 68144 | 4.2% | 5.1%(-0.900)#148 | 8.3%(-4.10)#15,132 |
| 21. | 68137 | 4.1% | 5.1%(-1.00)#152 | 8.3%(-4.20)#15,408 |
| 22. | 68116 | 3.7% | 5.1%(-1.40)#170 | 8.3%(-4.60)#16,656 |
| 23. | 68118 | 3.1% | 5.1%(-2.00)#209 | 8.3%(-5.20)#18,803 |
| 24. | 68138 | 3.0% | 5.1%(-2.10)#219 | 8.3%(-5.30)#19,134 |
| 25. | 68164 | 2.8% | 5.1%(-2.30)#233 | 8.3%(-5.50)#19,751 |
| 26. | 68122 | 2.7% | 5.1%(-2.40)#242 | 8.3%(-5.60)#20,150 |
| 27. | 68130 | 1.4% | 5.1%(-3.70)#345 | 8.3%(-6.90)#24,439 |
| 28. | 68135 | 1.3% | 5.1%(-3.80)#354 | 8.3%(-7.00)#24,731 |
| 29. | 68142 | 1.1% | 5.1%(-4.00)#372 | 8.3%(-7.20)#25,409 |
| 30. | 68136 | 0.80% | 5.1%(-4.30)#384 | 8.3%(-7.50)#26,094 |
| 31. | 68157 | 0.50% | 5.1%(-4.60)#412 | 8.3%(-7.80)#26,837 |
1
Common Questions
What are the Top 10 Zip Codes with the Highest Percentage of Households Without a Vehicle in Omaha, NE?
Top 10 Zip Codes with the Highest Percentage of Households Without a Vehicle in Omaha, NE are:
What zip code has the Highest Percentage of Households Without a Vehicle in Omaha, NE?
68111 has the Highest Percentage of Households Without a Vehicle in Omaha, NE with 18.0%.
What is the Percentage of Households Without a Vehicle in Omaha, NE?
Percentage of Households Without a Vehicle in Omaha is 7.2%.
What is the Percentage of Households Without a Vehicle in Nebraska?
Percentage of Households Without a Vehicle in Nebraska is 5.1%.
What is the Percentage of Households Without a Vehicle in the United States?
Percentage of Households Without a Vehicle in the United States is 8.3%.