Zip Codes with the Highest Unemployment Rate Among Females in Omaha, NE

RELATED REPORTS & OPTIONS

Highest Unemployment | Female
Population
Families and Households
Female Fertility
Female Fertility (Unmarried)
Race (Community Size)
Race (Percentage)
Ancestry (Community Size)
AfghanAfricanAlbanianAleutAmericanApacheArabArapahoArgentineanArmenianAustralianAustrianBangladeshiBasqueBelgianBhutaneseBlackfeetBolivianBrazilianBritishBulgarianBurmeseCajunCambodianCanadianCarpatho RusynCentral AmericanCentral American IndianCherokeeChickasawChileanChineseChippewaChoctawColombianComancheCosta RicanCreekCroatianCubanCzechCzechoslovakianDanishDominicanDutchEastern EuropeanEcuadorianEgyptianEnglishEthiopianEuropeanFilipinoFinnishFrenchFrench American IndianFrench CanadianGermanGerman RussianGhanaianGreekGuamanian / ChamorroGuatemalanGuyaneseHaitianHonduranHungarianIcelanderIndian (Asian)IndonesianInupiatIranianIraqiIrishIroquoisIsraeliItalianJamaicanJapaneseJordanianKenyanKiowaKoreanLaotianLatvianLebaneseLithuanianLuxembourgerMacedonianMalaysianMexicanMexican American IndianMoroccanNative HawaiianNavajoNicaraguanNigerianNorthern EuropeanNorwegianPakistaniPalestinianPanamanianPennsylvania GermanPeruvianPolishPortuguesePotawatomiPuebloPuerto RicanRomanianRussianSalvadoranSamoanScandinavianScotch-IrishScottishSeminoleSerbianSiouxSlavicSlovakSloveneSomaliSouth AfricanSouth AmericanSpaniardSpanishSri LankanSubsaharan AfricanSudaneseSwedishSwissSyrianThaiTlingit-HaidaTrinidadian and TobagonianTurkishUkrainianVenezuelanVietnameseWelshWest IndianYugoslavianZimbabwean
Ancestry (Percentage)
AfghanAfricanAlbanianAleutAmericanApacheArabArapahoArgentineanArmenianAustralianAustrianBangladeshiBasqueBelgianBhutaneseBlackfeetBolivianBrazilianBritishBulgarianBurmeseCajunCambodianCanadianCarpatho RusynCentral AmericanCentral American IndianCherokeeChickasawChileanChineseChippewaChoctawColombianComancheCosta RicanCreekCroatianCubanCzechCzechoslovakianDanishDominicanDutchEastern EuropeanEcuadorianEgyptianEnglishEthiopianEuropeanFilipinoFinnishFrenchFrench American IndianFrench CanadianGermanGerman RussianGhanaianGreekGuamanian / ChamorroGuatemalanGuyaneseHaitianHonduranHungarianIcelanderIndian (Asian)IndonesianInupiatIranianIraqiIrishIroquoisIsraeliItalianJamaicanJapaneseJordanianKenyanKiowaKoreanLaotianLatvianLebaneseLithuanianLuxembourgerMacedonianMalaysianMexicanMexican American IndianMoroccanNative HawaiianNavajoNicaraguanNigerianNorthern EuropeanNorwegianPakistaniPalestinianPanamanianPennsylvania GermanPeruvianPolishPortuguesePotawatomiPuebloPuerto RicanRomanianRussianSalvadoranSamoanScandinavianScotch-IrishScottishSeminoleSerbianSiouxSlavicSlovakSloveneSomaliSouth AfricanSouth AmericanSpaniardSpanishSri LankanSubsaharan AfricanSudaneseSwedishSwissSyrianThaiTlingit-HaidaTrinidadian and TobagonianTurkishUkrainianVenezuelanVietnameseWelshWest IndianYugoslavianZimbabwean
Immigrant Origin (Total)
AfghanistanAfricaArgentinaAsiaAustraliaBangladeshBarbadosBelarusBosnia and HerzegovinaBrazilBurma / MyanmarCameroonCanadaCaribbeanCentral AmericaChileChinaColombiaCongoCosta RicaCroatiaCubaCzechoslovakiaDominican RepublicEastern AfricaEastern AsiaEastern EuropeEgyptEl SalvadorEnglandEthiopiaEuropeFranceGermanyGhanaGreeceGuatemalaHondurasHong KongHungaryIndiaIndonesiaIranIraqIrelandIsraelItalyJamaicaJapanJordanKazakhstanKenyaKoreaKuwaitLaosLatin AmericaLatviaLithuaniaMalaysiaMexicoMiddle AfricaMoroccoNepalNetherlandsNicaraguaNigeriaNorthern AfricaNorthern EuropeOceaniaPakistanPanamaPeruPhilippinesPolandPortugalRomaniaRussiaSaudi ArabiaScotlandSierra LeoneSomaliaSouth AfricaSouth AmericaSouth Central AsiaSouth Eastern AsiaSouthern EuropeSpainSri LankaSudanSyriaTaiwanThailandTrinidad and TobagoTurkeyUgandaUkraineVenezuelaVietnamWestern AfricaWestern AsiaWestern EuropeZaireZimbabwe
Immigrant Origin (Percentage)
AfghanistanAfricaArgentinaAsiaAustraliaBangladeshBarbadosBelarusBosnia and HerzegovinaBrazilBurma / MyanmarCameroonCanadaCaribbeanCentral AmericaChileChinaColombiaCongoCosta RicaCroatiaCubaCzechoslovakiaDominican RepublicEastern AfricaEastern AsiaEastern EuropeEgyptEl SalvadorEnglandEthiopiaEuropeFranceGermanyGhanaGreeceGuatemalaHondurasHong KongHungaryIndiaIndonesiaIranIraqIrelandIsraelItalyJamaicaJapanJordanKazakhstanKenyaKoreaKuwaitLaosLatin AmericaLatviaLithuaniaMalaysiaMexicoMiddle AfricaMoroccoNepalNetherlandsNicaraguaNigeriaNorthern AfricaNorthern EuropeOceaniaPakistanPanamaPeruPhilippinesPolandPortugalRomaniaRussiaSaudi ArabiaScotlandSierra LeoneSomaliaSouth AfricaSouth AmericaSouth Central AsiaSouth Eastern AsiaSouthern EuropeSpainSri LankaSudanSyriaTaiwanThailandTrinidad and TobagoTurkeyUgandaUkraineVenezuelaVietnamWestern AfricaWestern AsiaWestern EuropeZaireZimbabwe
Income
Income (Families)
Income (Households)
Poverty
Poverty (Families)
Unemployment
Employment Occupations
Employment Industries
Employer Class
Commute Time
Commute Means
School Enrollment
Education by Degree Field
Occupancy
Finances
Physical Characteristics
Omaha
Compare Zip Codes
Comparison Subject

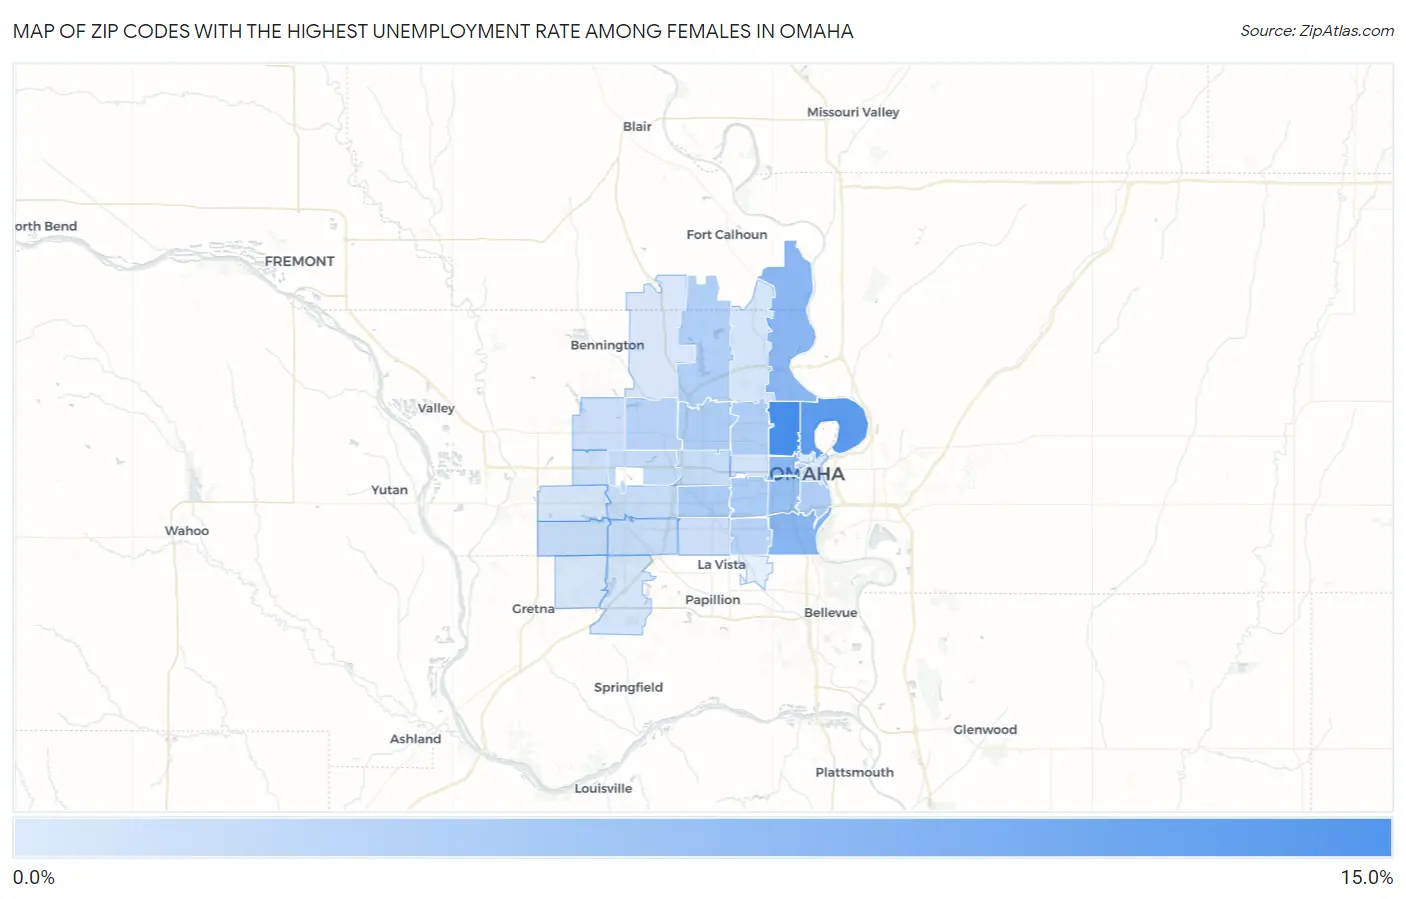
Map of Zip Codes with the Highest Unemployment Rate Among Females in Omaha

0.0%
15.0%
Zip Codes with the Highest Unemployment Rate Among Females in Omaha Map

Zip Codes with the Highest Unemployment Rate Among Females in Omaha, NE

Zip Code Female Unemployment vs State vs National
1.6811111.9%2.6%(+9.30)#184.9%(+7.00)#2,374
2.6811010.0%2.6%(+7.40)#244.9%(+5.10)#3,297
3.681076.7%2.6%(+4.10)#414.9%(+1.80)#6,623
4.681316.5%2.6%(+3.90)#444.9%(+1.60)#6,977
5.681126.5%2.6%(+3.90)#454.9%(+1.60)#6,979
6.681055.6%2.6%(+3.00)#554.9%(+0.700)#8,826
7.681244.1%2.6%(+1.50)#914.9%(-0.800)#12,832
8.681343.9%2.6%(+1.30)#994.9%(-1.00)#13,327
9.681063.9%2.6%(+1.30)#1004.9%(-1.00)#13,371
10.681043.7%2.6%(+1.10)#1114.9%(-1.20)#13,963
11.681083.7%2.6%(+1.10)#1124.9%(-1.20)#14,056
12.681223.5%2.6%(+0.900)#1144.9%(-1.40)#14,690
13.681173.0%2.6%(+0.400)#1284.9%(-1.90)#16,348
14.681642.9%2.6%(+0.300)#1314.9%(-2.00)#16,555
15.681782.2%2.6%(-0.400)#1844.9%(-2.70)#18,984
16.681542.1%2.6%(-0.500)#1894.9%(-2.80)#19,132
17.681442.0%2.6%(-0.600)#1954.9%(-2.90)#19,395
18.681142.0%2.6%(-0.600)#1974.9%(-2.90)#19,420
19.681351.9%2.6%(-0.700)#1994.9%(-3.00)#19,677
20.681371.9%2.6%(-0.700)#2004.9%(-3.00)#19,694
21.681161.5%2.6%(-1.10)#2234.9%(-3.40)#20,876
22.681271.4%2.6%(-1.20)#2314.9%(-3.50)#21,166
23.681181.3%2.6%(-1.30)#2374.9%(-3.60)#21,492
24.681321.1%2.6%(-1.50)#2494.9%(-3.80)#21,901
25.681380.90%2.6%(-1.70)#2654.9%(-4.00)#22,426
26.681520.90%2.6%(-1.70)#2664.9%(-4.00)#22,456
27.681300.70%2.6%(-1.90)#2814.9%(-4.20)#22,836
28.681360.70%2.6%(-1.90)#2824.9%(-4.20)#22,837
29.681420.50%2.6%(-2.10)#2974.9%(-4.40)#23,268
30.681020.20%2.6%(-2.40)#3104.9%(-4.70)#23,567

Common Questions

What are the Top 10 Zip Codes with the Highest Unemployment Rate Among Females in Omaha, NE?
Top 10 Zip Codes with the Highest Unemployment Rate Among Females in Omaha, NE are:
#1
11.9%
#2
10.0%
#3
6.7%
#4
6.5%
#5
6.5%
#6
5.6%
#7
4.1%
#8
3.9%
#9
3.9%
#10
3.7%
What zip code has the Highest Unemployment Rate Among Females in Omaha, NE?
68111 has the Highest Unemployment Rate Among Females in Omaha, NE with 11.9%.
What is the Unemployment Rate Among Females in Omaha, NE?
Unemployment Rate Among Females in Omaha is 3.6%.
What is the Unemployment Rate Among Females in Nebraska?
Unemployment Rate Among Females in Nebraska is 2.6%.
What is the Unemployment Rate Among Females in the United States?
Unemployment Rate Among Females in the United States is 4.9%.