Zip Codes with the Highest Percentage of Scotch-Irish Population in Omaha, NE

RELATED REPORTS & OPTIONS

Scotch-Irish
Population
Families and Households
Female Fertility
Female Fertility (Unmarried)
Race (Community Size)
Race (Percentage)
Ancestry (Community Size)
AfghanAfricanAlbanianAleutAmericanApacheArabArapahoArgentineanArmenianAustralianAustrianBangladeshiBasqueBelgianBhutaneseBlackfeetBolivianBrazilianBritishBulgarianBurmeseCajunCambodianCanadianCarpatho RusynCentral AmericanCentral American IndianCherokeeChickasawChileanChineseChippewaChoctawColombianComancheCosta RicanCreekCroatianCubanCzechCzechoslovakianDanishDominicanDutchEastern EuropeanEcuadorianEgyptianEnglishEthiopianEuropeanFilipinoFinnishFrenchFrench American IndianFrench CanadianGermanGerman RussianGhanaianGreekGuamanian / ChamorroGuatemalanGuyaneseHaitianHonduranHungarianIcelanderIndian (Asian)IndonesianInupiatIranianIraqiIrishIroquoisIsraeliItalianJamaicanJapaneseJordanianKenyanKiowaKoreanLaotianLatvianLebaneseLithuanianLuxembourgerMacedonianMalaysianMexicanMexican American IndianMoroccanNative HawaiianNavajoNicaraguanNigerianNorthern EuropeanNorwegianPakistaniPalestinianPanamanianPennsylvania GermanPeruvianPolishPortuguesePotawatomiPuebloPuerto RicanRomanianRussianSalvadoranSamoanScandinavianScotch-IrishScottishSeminoleSerbianSiouxSlavicSlovakSloveneSomaliSouth AfricanSouth AmericanSpaniardSpanishSri LankanSubsaharan AfricanSudaneseSwedishSwissSyrianThaiTlingit-HaidaTrinidadian and TobagonianTurkishUkrainianVenezuelanVietnameseWelshWest IndianYugoslavianZimbabwean
Ancestry (Percentage)
AfghanAfricanAlbanianAleutAmericanApacheArabArapahoArgentineanArmenianAustralianAustrianBangladeshiBasqueBelgianBhutaneseBlackfeetBolivianBrazilianBritishBulgarianBurmeseCajunCambodianCanadianCarpatho RusynCentral AmericanCentral American IndianCherokeeChickasawChileanChineseChippewaChoctawColombianComancheCosta RicanCreekCroatianCubanCzechCzechoslovakianDanishDominicanDutchEastern EuropeanEcuadorianEgyptianEnglishEthiopianEuropeanFilipinoFinnishFrenchFrench American IndianFrench CanadianGermanGerman RussianGhanaianGreekGuamanian / ChamorroGuatemalanGuyaneseHaitianHonduranHungarianIcelanderIndian (Asian)IndonesianInupiatIranianIraqiIrishIroquoisIsraeliItalianJamaicanJapaneseJordanianKenyanKiowaKoreanLaotianLatvianLebaneseLithuanianLuxembourgerMacedonianMalaysianMexicanMexican American IndianMoroccanNative HawaiianNavajoNicaraguanNigerianNorthern EuropeanNorwegianPakistaniPalestinianPanamanianPennsylvania GermanPeruvianPolishPortuguesePotawatomiPuebloPuerto RicanRomanianRussianSalvadoranSamoanScandinavianScotch-IrishScottishSeminoleSerbianSiouxSlavicSlovakSloveneSomaliSouth AfricanSouth AmericanSpaniardSpanishSri LankanSubsaharan AfricanSudaneseSwedishSwissSyrianThaiTlingit-HaidaTrinidadian and TobagonianTurkishUkrainianVenezuelanVietnameseWelshWest IndianYugoslavianZimbabwean
Immigrant Origin (Total)
AfghanistanAfricaArgentinaAsiaAustraliaBangladeshBarbadosBelarusBosnia and HerzegovinaBrazilBurma / MyanmarCameroonCanadaCaribbeanCentral AmericaChileChinaColombiaCongoCosta RicaCroatiaCubaCzechoslovakiaDominican RepublicEastern AfricaEastern AsiaEastern EuropeEgyptEl SalvadorEnglandEthiopiaEuropeFranceGermanyGhanaGreeceGuatemalaHondurasHong KongHungaryIndiaIndonesiaIranIraqIrelandIsraelItalyJamaicaJapanJordanKazakhstanKenyaKoreaKuwaitLaosLatin AmericaLatviaLithuaniaMalaysiaMexicoMiddle AfricaMoroccoNepalNetherlandsNicaraguaNigeriaNorthern AfricaNorthern EuropeOceaniaPakistanPanamaPeruPhilippinesPolandPortugalRomaniaRussiaSaudi ArabiaScotlandSierra LeoneSomaliaSouth AfricaSouth AmericaSouth Central AsiaSouth Eastern AsiaSouthern EuropeSpainSri LankaSudanSyriaTaiwanThailandTrinidad and TobagoTurkeyUgandaUkraineVenezuelaVietnamWestern AfricaWestern AsiaWestern EuropeZaireZimbabwe
Immigrant Origin (Percentage)
AfghanistanAfricaArgentinaAsiaAustraliaBangladeshBarbadosBelarusBosnia and HerzegovinaBrazilBurma / MyanmarCameroonCanadaCaribbeanCentral AmericaChileChinaColombiaCongoCosta RicaCroatiaCubaCzechoslovakiaDominican RepublicEastern AfricaEastern AsiaEastern EuropeEgyptEl SalvadorEnglandEthiopiaEuropeFranceGermanyGhanaGreeceGuatemalaHondurasHong KongHungaryIndiaIndonesiaIranIraqIrelandIsraelItalyJamaicaJapanJordanKazakhstanKenyaKoreaKuwaitLaosLatin AmericaLatviaLithuaniaMalaysiaMexicoMiddle AfricaMoroccoNepalNetherlandsNicaraguaNigeriaNorthern AfricaNorthern EuropeOceaniaPakistanPanamaPeruPhilippinesPolandPortugalRomaniaRussiaSaudi ArabiaScotlandSierra LeoneSomaliaSouth AfricaSouth AmericaSouth Central AsiaSouth Eastern AsiaSouthern EuropeSpainSri LankaSudanSyriaTaiwanThailandTrinidad and TobagoTurkeyUgandaUkraineVenezuelaVietnamWestern AfricaWestern AsiaWestern EuropeZaireZimbabwe
Income
Income (Families)
Income (Households)
Poverty
Poverty (Families)
Unemployment
Employment Occupations
Employment Industries
Employer Class
Commute Time
Commute Means
School Enrollment
Education by Degree Field
Occupancy
Finances
Physical Characteristics
Omaha
Compare Zip Codes
Comparison Subject

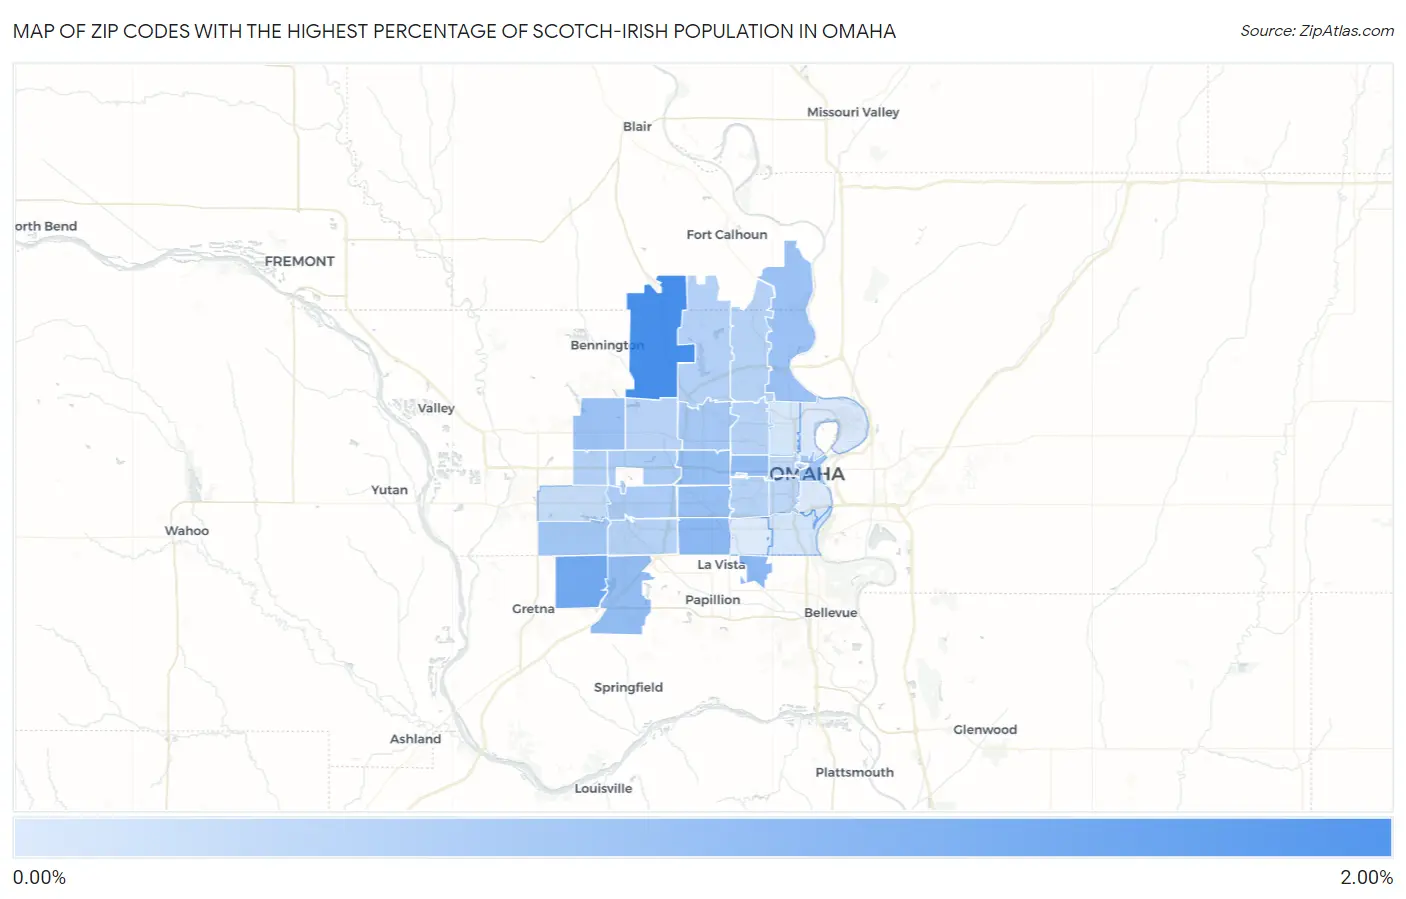
Map of Zip Codes with the Highest Percentage of Scotch-Irish Population in Omaha

0.00%
2.00%
Zip Codes with the Highest Percentage of Scotch-Irish Population in Omaha Map

Zip Codes with the Highest Percentage of Scotch-Irish Population in Omaha, NE

Zip Code Scotch-Irish vs State vs National
1.681421.96%0.68%(+1.28)#480.82%(+1.15)#3,954
2.681361.41%0.68%(+0.725)#790.82%(+0.591)#6,462
3.681271.07%0.68%(+0.383)#1080.82%(+0.248)#9,056
4.681571.06%0.68%(+0.379)#1120.82%(+0.245)#9,092
5.681320.99%0.68%(+0.307)#1300.82%(+0.173)#9,835
6.681380.99%0.68%(+0.306)#1310.82%(+0.172)#9,850
7.681140.96%0.68%(+0.272)#1330.82%(+0.138)#10,213
8.681240.92%0.68%(+0.232)#1390.82%(+0.097)#10,642
9.681120.89%0.68%(+0.210)#1460.82%(+0.076)#10,910
10.681160.87%0.68%(+0.183)#1520.82%(+0.048)#11,222
11.681020.80%0.68%(+0.119)#1660.82%(-0.015)#12,039
12.681350.79%0.68%(+0.104)#1710.82%(-0.030)#12,220
13.681340.76%0.68%(+0.074)#1790.82%(-0.061)#12,614
14.681440.70%0.68%(+0.017)#1920.82%(-0.118)#13,394
15.681540.66%0.68%(-0.028)#2010.82%(-0.162)#14,039
16.681220.58%0.68%(-0.101)#2230.82%(-0.235)#15,106
17.681180.57%0.68%(-0.116)#2260.82%(-0.250)#15,341
18.681040.56%0.68%(-0.129)#2320.82%(-0.263)#15,528
19.681060.55%0.68%(-0.132)#2340.82%(-0.266)#15,584
20.681370.55%0.68%(-0.138)#2380.82%(-0.273)#15,670
21.681520.53%0.68%(-0.153)#2430.82%(-0.287)#15,912
22.681640.51%0.68%(-0.173)#2460.82%(-0.307)#16,256
23.681780.46%0.68%(-0.219)#2590.82%(-0.353)#16,996
24.681050.46%0.68%(-0.225)#2600.82%(-0.360)#17,098
25.681310.43%0.68%(-0.257)#2750.82%(-0.391)#17,629
26.681820.40%0.68%(-0.288)#2860.82%(-0.422)#18,147
27.681300.33%0.68%(-0.357)#3040.82%(-0.491)#19,287
28.681070.16%0.68%(-0.522)#3530.82%(-0.657)#22,113
29.681110.13%0.68%(-0.555)#3620.82%(-0.689)#22,603
30.681080.087%0.68%(-0.596)#3690.82%(-0.730)#23,203
31.681100.072%0.68%(-0.611)#3730.82%(-0.746)#23,388
32.681170.046%0.68%(-0.638)#3760.82%(-0.772)#23,693

Common Questions

What are the Top 10 Zip Codes with the Highest Percentage of Scotch-Irish Population in Omaha, NE?
Top 10 Zip Codes with the Highest Percentage of Scotch-Irish Population in Omaha, NE are:
#1
1.96%
#2
1.41%
#3
1.07%
#4
1.06%
#5
0.99%
#6
0.99%
#7
0.96%
#8
0.92%
#9
0.89%
#10
0.87%
What zip code has the Highest Percentage of Scotch-Irish Population in Omaha, NE?
68142 has the Highest Percentage of Scotch-Irish Population in Omaha, NE with 1.96%.
What is the Percentage of Scotch-Irish Population in Omaha, NE?
Percentage of Scotch-Irish Population in Omaha is 0.61%.
What is the Percentage of Scotch-Irish Population in Nebraska?
Percentage of Scotch-Irish Population in Nebraska is 0.68%.
What is the Percentage of Scotch-Irish Population in the United States?
Percentage of Scotch-Irish Population in the United States is 0.82%.