Zip Codes with the Lowest Percentage of Renter-Occupied Units in Omaha, NE

RELATED REPORTS & OPTIONS

Lowest Renter-Occupied
Population
Families and Households
Female Fertility
Female Fertility (Unmarried)
Race (Community Size)
Race (Percentage)
Ancestry (Community Size)
AfghanAfricanAlbanianAleutAmericanApacheArabArapahoArgentineanArmenianAustralianAustrianBangladeshiBasqueBelgianBhutaneseBlackfeetBolivianBrazilianBritishBulgarianBurmeseCajunCambodianCanadianCarpatho RusynCentral AmericanCentral American IndianCherokeeChickasawChileanChineseChippewaChoctawColombianComancheCosta RicanCreekCroatianCubanCzechCzechoslovakianDanishDominicanDutchEastern EuropeanEcuadorianEgyptianEnglishEthiopianEuropeanFilipinoFinnishFrenchFrench American IndianFrench CanadianGermanGerman RussianGhanaianGreekGuamanian / ChamorroGuatemalanGuyaneseHaitianHonduranHungarianIcelanderIndian (Asian)IndonesianInupiatIranianIraqiIrishIroquoisIsraeliItalianJamaicanJapaneseJordanianKenyanKiowaKoreanLaotianLatvianLebaneseLithuanianLuxembourgerMacedonianMalaysianMexicanMexican American IndianMoroccanNative HawaiianNavajoNicaraguanNigerianNorthern EuropeanNorwegianPakistaniPalestinianPanamanianPennsylvania GermanPeruvianPolishPortuguesePotawatomiPuebloPuerto RicanRomanianRussianSalvadoranSamoanScandinavianScotch-IrishScottishSeminoleSerbianSiouxSlavicSlovakSloveneSomaliSouth AfricanSouth AmericanSpaniardSpanishSri LankanSubsaharan AfricanSudaneseSwedishSwissSyrianThaiTlingit-HaidaTrinidadian and TobagonianTurkishUkrainianVenezuelanVietnameseWelshWest IndianYugoslavianZimbabwean
Ancestry (Percentage)
AfghanAfricanAlbanianAleutAmericanApacheArabArapahoArgentineanArmenianAustralianAustrianBangladeshiBasqueBelgianBhutaneseBlackfeetBolivianBrazilianBritishBulgarianBurmeseCajunCambodianCanadianCarpatho RusynCentral AmericanCentral American IndianCherokeeChickasawChileanChineseChippewaChoctawColombianComancheCosta RicanCreekCroatianCubanCzechCzechoslovakianDanishDominicanDutchEastern EuropeanEcuadorianEgyptianEnglishEthiopianEuropeanFilipinoFinnishFrenchFrench American IndianFrench CanadianGermanGerman RussianGhanaianGreekGuamanian / ChamorroGuatemalanGuyaneseHaitianHonduranHungarianIcelanderIndian (Asian)IndonesianInupiatIranianIraqiIrishIroquoisIsraeliItalianJamaicanJapaneseJordanianKenyanKiowaKoreanLaotianLatvianLebaneseLithuanianLuxembourgerMacedonianMalaysianMexicanMexican American IndianMoroccanNative HawaiianNavajoNicaraguanNigerianNorthern EuropeanNorwegianPakistaniPalestinianPanamanianPennsylvania GermanPeruvianPolishPortuguesePotawatomiPuebloPuerto RicanRomanianRussianSalvadoranSamoanScandinavianScotch-IrishScottishSeminoleSerbianSiouxSlavicSlovakSloveneSomaliSouth AfricanSouth AmericanSpaniardSpanishSri LankanSubsaharan AfricanSudaneseSwedishSwissSyrianThaiTlingit-HaidaTrinidadian and TobagonianTurkishUkrainianVenezuelanVietnameseWelshWest IndianYugoslavianZimbabwean
Immigrant Origin (Total)
AfghanistanAfricaArgentinaAsiaAustraliaBangladeshBarbadosBelarusBosnia and HerzegovinaBrazilBurma / MyanmarCameroonCanadaCaribbeanCentral AmericaChileChinaColombiaCongoCosta RicaCroatiaCubaCzechoslovakiaDominican RepublicEastern AfricaEastern AsiaEastern EuropeEgyptEl SalvadorEnglandEthiopiaEuropeFranceGermanyGhanaGreeceGuatemalaHondurasHong KongHungaryIndiaIndonesiaIranIraqIrelandIsraelItalyJamaicaJapanJordanKazakhstanKenyaKoreaKuwaitLaosLatin AmericaLatviaLithuaniaMalaysiaMexicoMiddle AfricaMoroccoNepalNetherlandsNicaraguaNigeriaNorthern AfricaNorthern EuropeOceaniaPakistanPanamaPeruPhilippinesPolandPortugalRomaniaRussiaSaudi ArabiaScotlandSierra LeoneSomaliaSouth AfricaSouth AmericaSouth Central AsiaSouth Eastern AsiaSouthern EuropeSpainSri LankaSudanSyriaTaiwanThailandTrinidad and TobagoTurkeyUgandaUkraineVenezuelaVietnamWestern AfricaWestern AsiaWestern EuropeZaireZimbabwe
Immigrant Origin (Percentage)
AfghanistanAfricaArgentinaAsiaAustraliaBangladeshBarbadosBelarusBosnia and HerzegovinaBrazilBurma / MyanmarCameroonCanadaCaribbeanCentral AmericaChileChinaColombiaCongoCosta RicaCroatiaCubaCzechoslovakiaDominican RepublicEastern AfricaEastern AsiaEastern EuropeEgyptEl SalvadorEnglandEthiopiaEuropeFranceGermanyGhanaGreeceGuatemalaHondurasHong KongHungaryIndiaIndonesiaIranIraqIrelandIsraelItalyJamaicaJapanJordanKazakhstanKenyaKoreaKuwaitLaosLatin AmericaLatviaLithuaniaMalaysiaMexicoMiddle AfricaMoroccoNepalNetherlandsNicaraguaNigeriaNorthern AfricaNorthern EuropeOceaniaPakistanPanamaPeruPhilippinesPolandPortugalRomaniaRussiaSaudi ArabiaScotlandSierra LeoneSomaliaSouth AfricaSouth AmericaSouth Central AsiaSouth Eastern AsiaSouthern EuropeSpainSri LankaSudanSyriaTaiwanThailandTrinidad and TobagoTurkeyUgandaUkraineVenezuelaVietnamWestern AfricaWestern AsiaWestern EuropeZaireZimbabwe
Income
Income (Families)
Income (Households)
Poverty
Poverty (Families)
Unemployment
Employment Occupations
Employment Industries
Employer Class
Commute Time
Commute Means
School Enrollment
Education by Degree Field
Occupancy
Finances
Physical Characteristics
Omaha
Compare Zip Codes
Comparison Subject

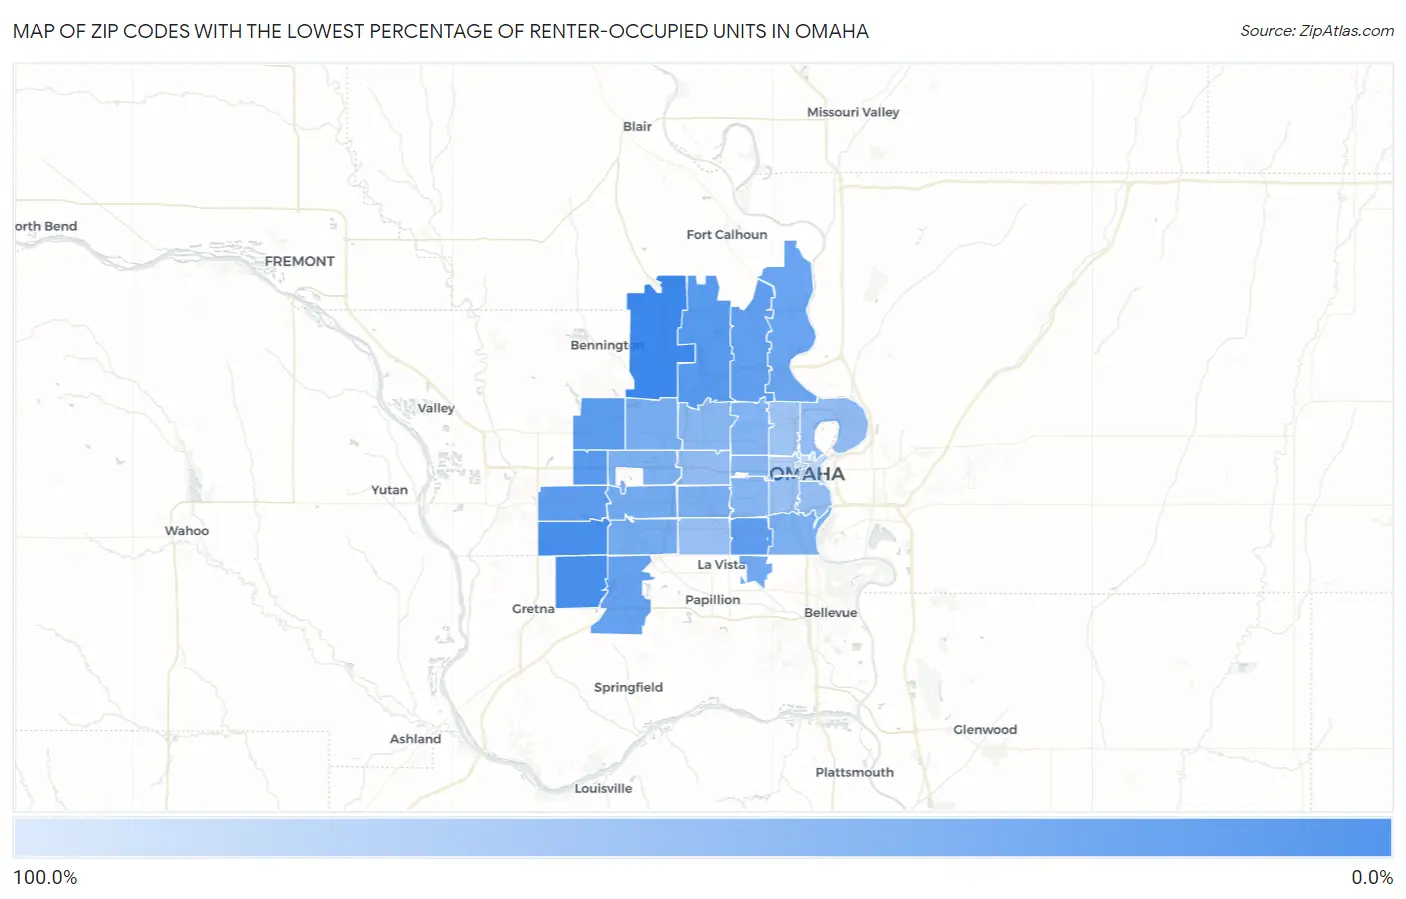
Map of Zip Codes with the Lowest Percentage of Renter-Occupied Units in Omaha

100.0%
0.0%
Zip Codes with the Lowest Percentage of Renter-Occupied Units in Omaha Map

Zip Codes with the Lowest Percentage of Renter-Occupied Units in Omaha, NE

Zip Code % Renter-Occupied vs State vs National
1.681424.6%33.5%(-28.9)#1535.2%(-30.6)#873
2.681369.8%33.5%(-23.6)#6235.2%(-25.4)#3,667
3.6813510.0%33.5%(-23.5)#6535.2%(-25.2)#3,760
4.6812218.3%33.5%(-15.1)#22835.2%(-16.8)#11,281
5.6811818.7%33.5%(-14.8)#23535.2%(-16.5)#11,618
6.6811620.4%33.5%(-13.0)#26635.2%(-14.7)#13,321
7.6813021.6%33.5%(-11.9)#28035.2%(-13.6)#14,341
8.6811721.7%33.5%(-11.7)#28435.2%(-13.4)#14,511
9.6815223.0%33.5%(-10.4)#31235.2%(-12.2)#15,704
10.6813825.1%33.5%(-8.33)#35835.2%(-10.1)#17,591
11.6811227.7%33.5%(-5.79)#39135.2%(-7.52)#19,476
12.6815731.0%33.5%(-2.50)#43235.2%(-4.23)#21,642
13.6814432.2%33.5%(-1.22)#44735.2%(-2.95)#22,390
14.6813734.8%33.5%(+1.30)#46735.2%(-0.433)#23,625
15.6816436.1%33.5%(+2.61)#48735.2%(+0.885)#24,228
16.6812437.0%33.5%(+3.57)#49035.2%(+1.84)#24,626
17.6810738.1%33.5%(+4.69)#49635.2%(+2.96)#25,061
18.6815440.0%33.5%(+6.54)#50635.2%(+4.81)#25,685
19.6810441.3%33.5%(+7.84)#51535.2%(+6.11)#26,083
20.6810643.3%33.5%(+9.86)#52735.2%(+8.13)#26,608
21.6813444.8%33.5%(+11.3)#53235.2%(+9.60)#26,985
22.6813245.0%33.5%(+11.6)#53335.2%(+9.86)#27,062
23.6811050.7%33.5%(+17.3)#53835.2%(+15.5)#28,120
24.6811451.5%33.5%(+18.0)#54035.2%(+16.3)#28,251
25.6810852.6%33.5%(+19.1)#54135.2%(+17.4)#28,414
26.6812755.3%33.5%(+21.8)#54435.2%(+20.1)#28,807
27.6810556.6%33.5%(+23.2)#54735.2%(+21.4)#28,960
28.6811160.7%33.5%(+27.3)#54935.2%(+25.5)#29,364
29.6813173.4%33.5%(+39.9)#55535.2%(+38.2)#30,209
30.6810287.1%33.5%(+53.7)#55635.2%(+52.0)#30,582
31.68178100.0%33.5%(+66.5)#56035.2%(+64.8)#30,862

Common Questions

What are the Top 10 Zip Codes with the Lowest Percentage of Renter-Occupied Units in Omaha, NE?
Top 10 Zip Codes with the Lowest Percentage of Renter-Occupied Units in Omaha, NE are:
#1
4.6%
#2
9.8%
#3
10.0%
#4
18.3%
#5
18.7%
#6
20.4%
#7
21.6%
#8
21.7%
#9
23.0%
#10
25.1%
What zip code has the Lowest Percentage of Renter-Occupied Units in Omaha, NE?
68142 has the Lowest Percentage of Renter-Occupied Units in Omaha, NE with 4.6%.
What is the Percentage of Renter-Occupied Units in Omaha, NE?
Percentage of Renter-Occupied Units in Omaha is 42.1%.
What is the Percentage of Renter-Occupied Units in Nebraska?
Percentage of Renter-Occupied Units in Nebraska is 33.5%.
What is the Percentage of Renter-Occupied Units in the United States?
Percentage of Renter-Occupied Units in the United States is 35.2%.