Wilkinson County, MS Map & Demographics
Wilkinson County Map
Wilkinson County Overview
$22,479
PER CAPITA INCOME
$46,290
AVG FAMILY INCOME
$34,928
AVG HOUSEHOLD INCOME
35.7%
WAGE / INCOME GAP [ % ]
64.3¢/ $1
WAGE / INCOME GAP [ $ ]
0.49
INEQUALITY / GINI INDEX
8,531
TOTAL POPULATION
4,588
MALE POPULATION
3,943
FEMALE POPULATION
116.36
MALES / 100 FEMALES
85.94
FEMALES / 100 MALES
38.9
MEDIAN AGE
3.1
AVG FAMILY SIZE
2.3
AVG HOUSEHOLD SIZE
2,984
LABOR FORCE [ PEOPLE ]
42.9%
PERCENT IN LABOR FORCE
6.3%
UNEMPLOYMENT RATE
Income in Wilkinson County
Income Overview in Wilkinson County
Per Capita Income in Wilkinson County is $22,479, while median incomes of families and households are $46,290 and $34,928 respectively.
| Characteristic | Number | Measure |
| Per Capita Income | 8,531 | $22,479 |
| Median Family Income | 1,890 | $46,290 |
| Mean Family Income | 1,890 | $72,590 |
| Median Household Income | 3,264 | $34,928 |
| Mean Household Income | 3,264 | $57,637 |
| Income Deficit | 1,890 | $0 |
| Wage / Income Gap (%) | 8,531 | 35.69% |
| Wage / Income Gap ($) | 8,531 | 64.31¢ per $1 |
| Gini / Inequality Index | 8,531 | 0.49 |
Earnings by Sex in Wilkinson County
Average Earnings in Wilkinson County are $33,379, $45,510 for men and $29,268 for women, a difference of 35.7%.
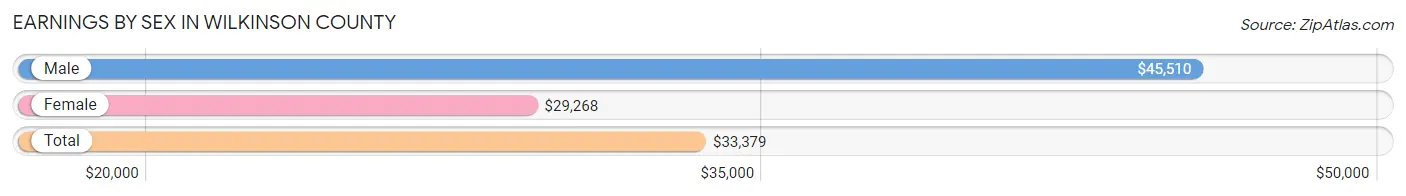
| Sex | Number | Average Earnings |
| Male | 1,551 (48.7%) | $45,510 |
| Female | 1,636 (51.3%) | $29,268 |
| Total | 3,187 (100.0%) | $33,379 |
Earnings by Sex by Income Bracket in Wilkinson County
The most common earnings brackets in Wilkinson County are $7,500 to $9,999 for men (274 | 17.7%) and $30,000 to $34,999 for women (266 | 16.3%).
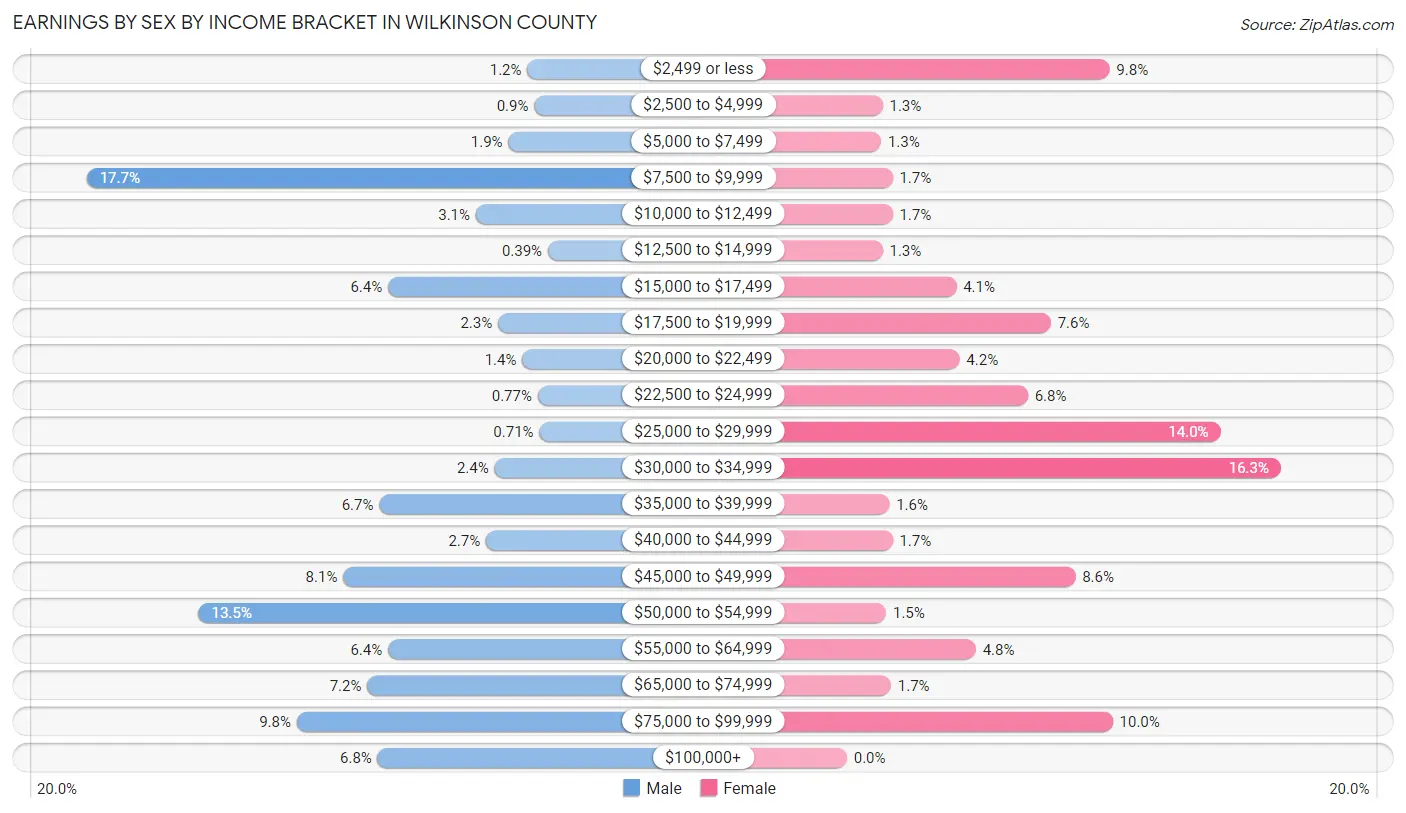
| Income | Male | Female |
| $2,499 or less | 18 (1.2%) | 161 (9.8%) |
| $2,500 to $4,999 | 14 (0.9%) | 22 (1.3%) |
| $5,000 to $7,499 | 29 (1.9%) | 21 (1.3%) |
| $7,500 to $9,999 | 274 (17.7%) | 28 (1.7%) |
| $10,000 to $12,499 | 48 (3.1%) | 28 (1.7%) |
| $12,500 to $14,999 | 6 (0.4%) | 22 (1.3%) |
| $15,000 to $17,499 | 99 (6.4%) | 67 (4.1%) |
| $17,500 to $19,999 | 35 (2.3%) | 125 (7.6%) |
| $20,000 to $22,499 | 21 (1.3%) | 69 (4.2%) |
| $22,500 to $24,999 | 12 (0.8%) | 111 (6.8%) |
| $25,000 to $29,999 | 11 (0.7%) | 229 (14.0%) |
| $30,000 to $34,999 | 37 (2.4%) | 266 (16.3%) |
| $35,000 to $39,999 | 104 (6.7%) | 26 (1.6%) |
| $40,000 to $44,999 | 42 (2.7%) | 28 (1.7%) |
| $45,000 to $49,999 | 125 (8.1%) | 140 (8.6%) |
| $50,000 to $54,999 | 209 (13.5%) | 24 (1.5%) |
| $55,000 to $64,999 | 99 (6.4%) | 79 (4.8%) |
| $65,000 to $74,999 | 111 (7.2%) | 27 (1.7%) |
| $75,000 to $99,999 | 152 (9.8%) | 163 (10.0%) |
| $100,000+ | 105 (6.8%) | 0 (0.0%) |
| Total | 1,551 (100.0%) | 1,636 (100.0%) |
Earnings by Sex by Educational Attainment in Wilkinson County
Average earnings in Wilkinson County are $46,340 for men and $29,991 for women, a difference of 35.3%. Men with an educational attainment of college or associate's degree enjoy the highest average annual earnings of $55,391, while those with less than high school education earn the least with $16,036. Women with an educational attainment of college or associate's degree earn the most with the average annual earnings of $30,257, while those with bachelor's degree education have the smallest earnings of $18,795.
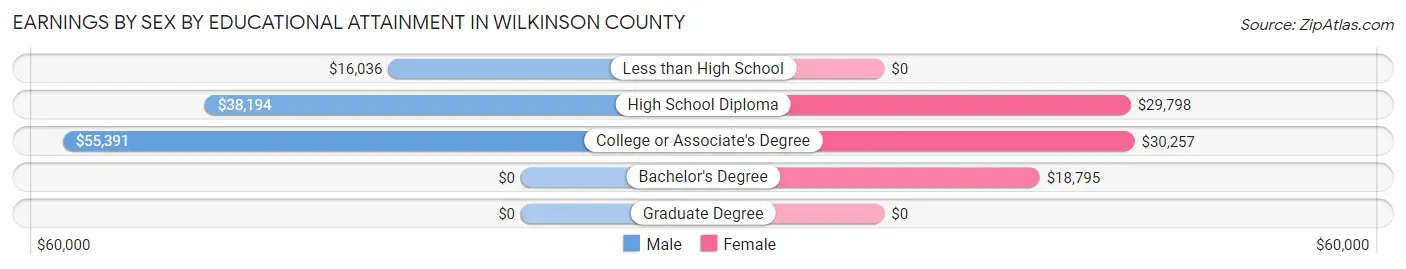
| Educational Attainment | Male Income | Female Income |
| Less than High School | $16,036 | $0 |
| High School Diploma | $38,194 | $29,798 |
| College or Associate's Degree | $55,391 | $30,257 |
| Bachelor's Degree | - | - |
| Graduate Degree | - | - |
| Total | $46,340 | $29,991 |
Family Income in Wilkinson County
Family Income Brackets in Wilkinson County
According to the Wilkinson County family income data, there are 386 families falling into the $15,000 to $24,999 income range, which is the most common income bracket and makes up 20.4% of all families. Conversely, the $150,000 to $199,999 income bracket is the least frequent group with only 23 families (1.2%) belonging to this category.
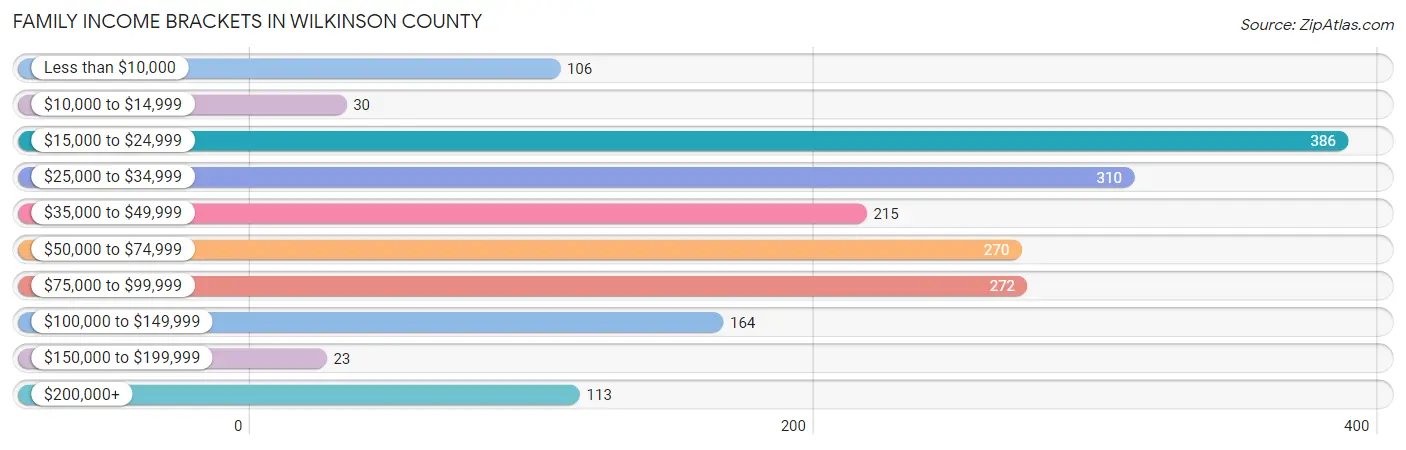
| Income Bracket | # Families | % Families |
| Less than $10,000 | 106 | 5.6% |
| $10,000 to $14,999 | 30 | 1.6% |
| $15,000 to $24,999 | 386 | 20.4% |
| $25,000 to $34,999 | 310 | 16.4% |
| $35,000 to $49,999 | 215 | 11.4% |
| $50,000 to $74,999 | 270 | 14.3% |
| $75,000 to $99,999 | 272 | 14.4% |
| $100,000 to $149,999 | 164 | 8.7% |
| $150,000 to $199,999 | 23 | 1.2% |
| $200,000+ | 113 | 6.0% |
Family Income by Famaliy Size in Wilkinson County
4-person families (234 | 12.4%) account for the highest median family income in Wilkinson County with $89,250 per family, while 4-person families (234 | 12.4%) have the highest median income of $22,312 per family member.
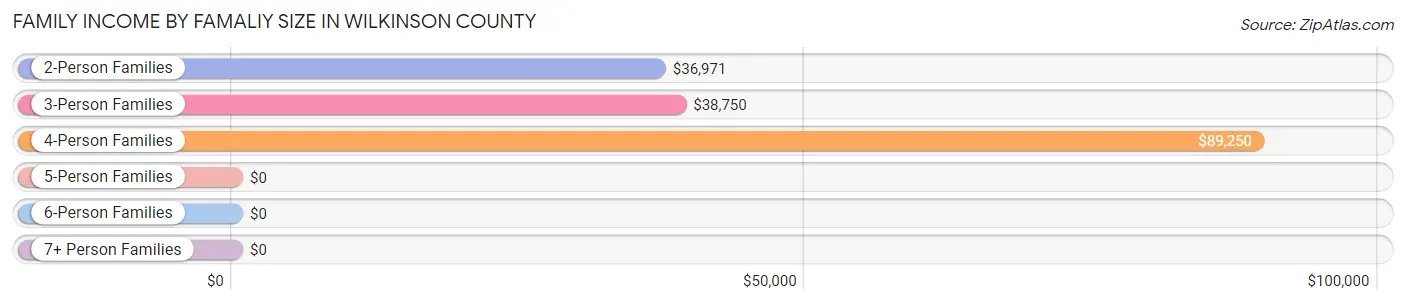
| Income Bracket | # Families | Median Income |
| 2-Person Families | 951 (50.3%) | $36,971 |
| 3-Person Families | 592 (31.3%) | $38,750 |
| 4-Person Families | 234 (12.4%) | $89,250 |
| 5-Person Families | 73 (3.9%) | $0 |
| 6-Person Families | 21 (1.1%) | $0 |
| 7+ Person Families | 19 (1.0%) | $0 |
| Total | 1,890 (100.0%) | $46,290 |
Family Income by Number of Earners in Wilkinson County
The median family income in Wilkinson County is $46,290, with families comprising 3+ earners (53) having the highest median family income of $204,297, while families with no earners (375) have the lowest median family income of $22,564, accounting for 2.8% and 19.8% of families, respectively.
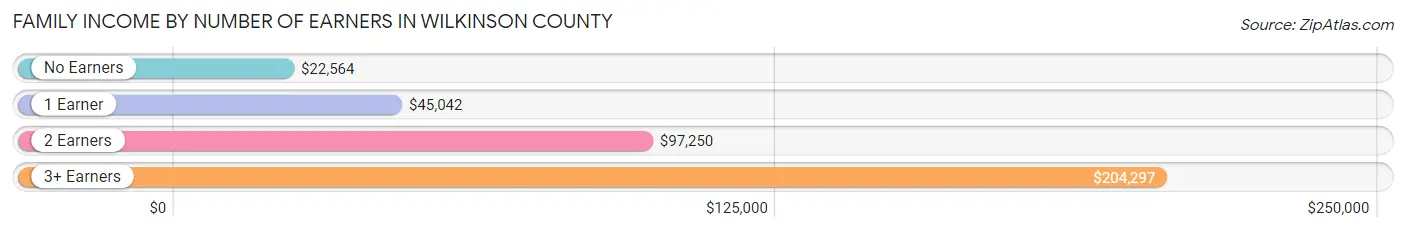
| Number of Earners | # Families | Median Income |
| No Earners | 375 (19.8%) | $22,564 |
| 1 Earner | 884 (46.8%) | $45,042 |
| 2 Earners | 578 (30.6%) | $97,250 |
| 3+ Earners | 53 (2.8%) | $204,297 |
| Total | 1,890 (100.0%) | $46,290 |
Household Income in Wilkinson County
Household Income Brackets in Wilkinson County
With 659 households falling in the category, the $50,000 to $74,999 income range is the most frequent in Wilkinson County, accounting for 20.2% of all households. In contrast, only 23 households (0.7%) fall into the $150,000 to $199,999 income bracket, making it the least populous group.
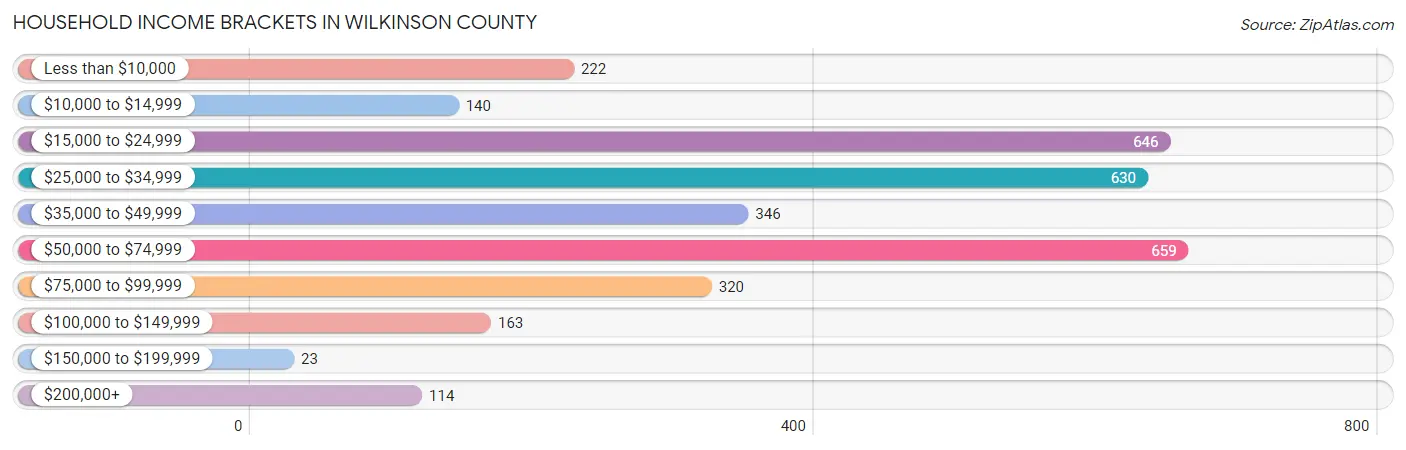
| Income Bracket | # Households | % Households |
| Less than $10,000 | 222 | 6.8% |
| $10,000 to $14,999 | 140 | 4.3% |
| $15,000 to $24,999 | 646 | 19.8% |
| $25,000 to $34,999 | 630 | 19.3% |
| $35,000 to $49,999 | 346 | 10.6% |
| $50,000 to $74,999 | 659 | 20.2% |
| $75,000 to $99,999 | 320 | 9.8% |
| $100,000 to $149,999 | 163 | 5.0% |
| $150,000 to $199,999 | 23 | 0.7% |
| $200,000+ | 114 | 3.5% |
Household Income by Householder Age in Wilkinson County
The median household income in Wilkinson County is $34,928, with the highest median household income of $48,833 found in the 45 to 64 years age bracket for the primary householder. A total of 1,424 households (43.6%) fall into this category. Meanwhile, the 15 to 24 years age bracket for the primary householder has the lowest median household income of $0, with 19 households (0.6%) in this group.
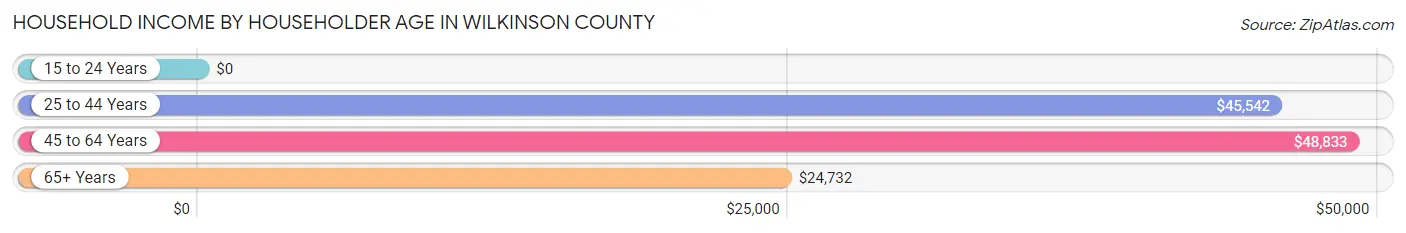
| Income Bracket | # Households | Median Income |
| 15 to 24 Years | 19 (0.6%) | $0 |
| 25 to 44 Years | 856 (26.2%) | $45,542 |
| 45 to 64 Years | 1,424 (43.6%) | $48,833 |
| 65+ Years | 965 (29.6%) | $24,732 |
| Total | 3,264 (100.0%) | $34,928 |
Poverty in Wilkinson County
Income Below Poverty by Sex and Age in Wilkinson County
With 15.1% poverty level for males and 27.4% for females among the residents of Wilkinson County, 15 year old males and 15 year old females are the most vulnerable to poverty, with 56 males (68.3%) and 3 females (100.0%) in their respective age groups living below the poverty level.
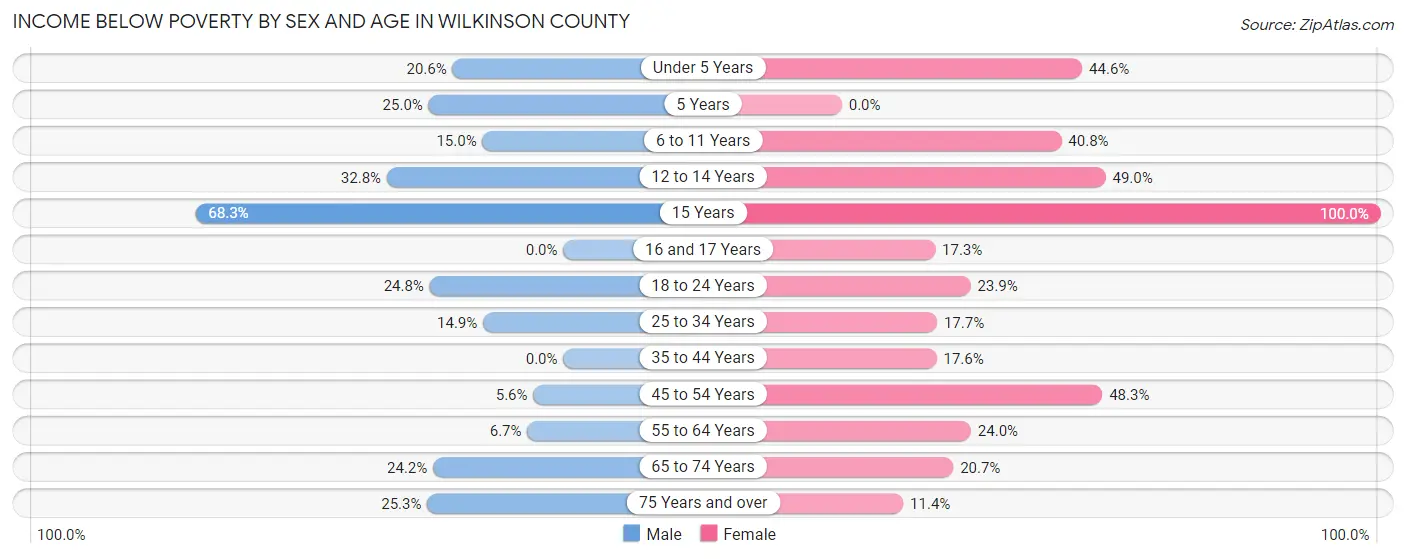
| Age Bracket | Male | Female |
| Under 5 Years | 36 (20.6%) | 112 (44.6%) |
| 5 Years | 14 (25.0%) | 0 (0.0%) |
| 6 to 11 Years | 53 (15.0%) | 139 (40.8%) |
| 12 to 14 Years | 56 (32.8%) | 70 (48.9%) |
| 15 Years | 56 (68.3%) | 3 (100.0%) |
| 16 and 17 Years | 0 (0.0%) | 22 (17.3%) |
| 18 to 24 Years | 66 (24.8%) | 43 (23.9%) |
| 25 to 34 Years | 42 (14.9%) | 94 (17.7%) |
| 35 to 44 Years | 0 (0.0%) | 76 (17.6%) |
| 45 to 54 Years | 27 (5.6%) | 218 (48.3%) |
| 55 to 64 Years | 36 (6.7%) | 146 (24.0%) |
| 65 to 74 Years | 103 (24.2%) | 103 (20.7%) |
| 75 Years and over | 50 (25.3%) | 36 (11.4%) |
| Total | 539 (15.1%) | 1,062 (27.4%) |
Income Above Poverty by Sex and Age in Wilkinson County
According to the poverty statistics in Wilkinson County, males aged 16 and 17 years and females aged 75 years and over are the age groups that are most secure financially, with 100.0% of males and 88.6% of females in these age groups living above the poverty line.
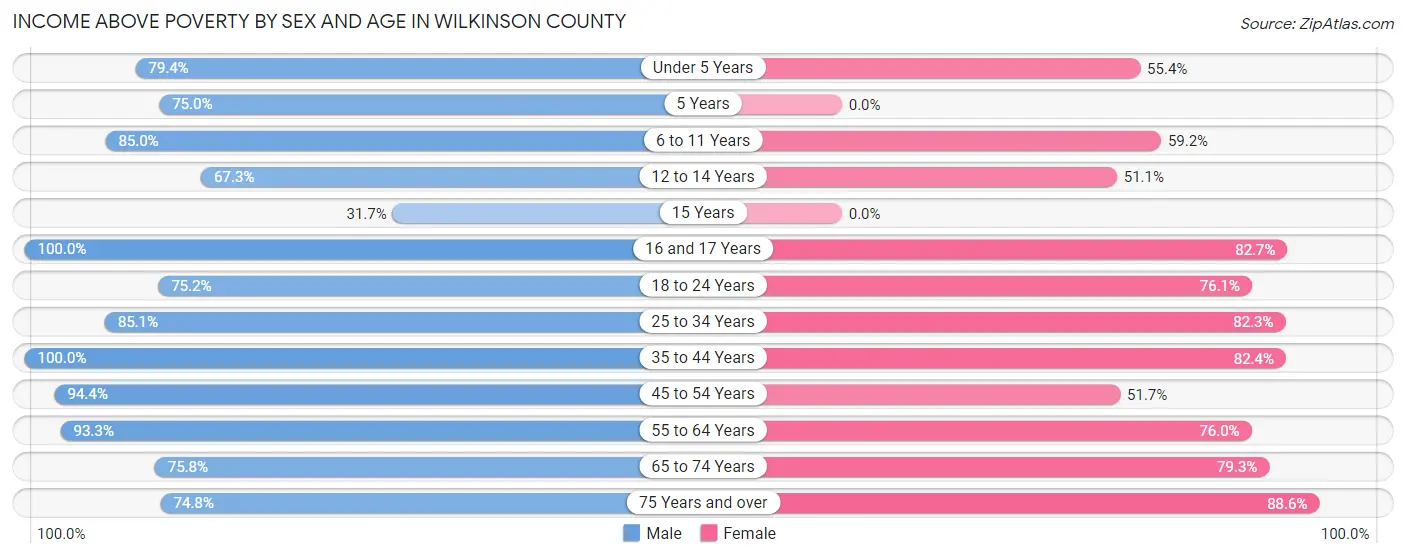
| Age Bracket | Male | Female |
| Under 5 Years | 139 (79.4%) | 139 (55.4%) |
| 5 Years | 42 (75.0%) | 0 (0.0%) |
| 6 to 11 Years | 300 (85.0%) | 202 (59.2%) |
| 12 to 14 Years | 115 (67.2%) | 73 (51.0%) |
| 15 Years | 26 (31.7%) | 0 (0.0%) |
| 16 and 17 Years | 78 (100.0%) | 105 (82.7%) |
| 18 to 24 Years | 200 (75.2%) | 137 (76.1%) |
| 25 to 34 Years | 240 (85.1%) | 438 (82.3%) |
| 35 to 44 Years | 448 (100.0%) | 356 (82.4%) |
| 45 to 54 Years | 458 (94.4%) | 233 (51.7%) |
| 55 to 64 Years | 503 (93.3%) | 463 (76.0%) |
| 65 to 74 Years | 323 (75.8%) | 395 (79.3%) |
| 75 Years and over | 148 (74.8%) | 280 (88.6%) |
| Total | 3,020 (84.9%) | 2,821 (72.7%) |
Income Below Poverty Among Married-Couple Families in Wilkinson County
The poverty statistics for married-couple families in Wilkinson County show that 11.6% or 105 of the total 907 families live below the poverty line. Families with 1 or 2 children have the highest poverty rate of 15.3%, comprising of 42 families. On the other hand, families with 3 or 4 children have the lowest poverty rate of 0.0%, which includes 0 families.
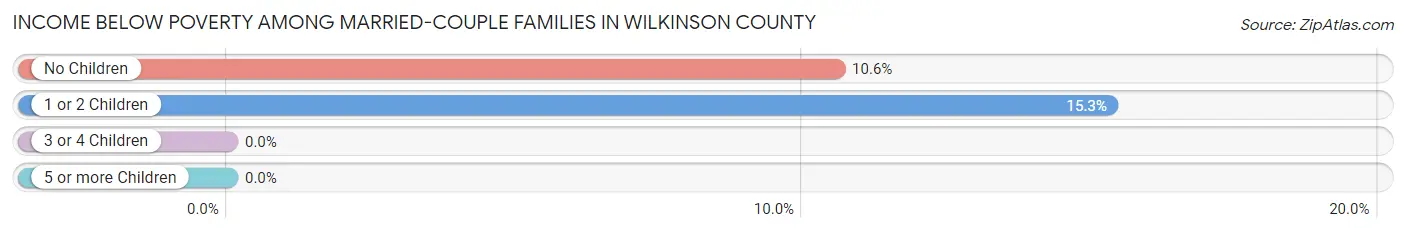
| Children | Above Poverty | Below Poverty |
| No Children | 533 (89.4%) | 63 (10.6%) |
| 1 or 2 Children | 232 (84.7%) | 42 (15.3%) |
| 3 or 4 Children | 27 (100.0%) | 0 (0.0%) |
| 5 or more Children | 10 (100.0%) | 0 (0.0%) |
| Total | 802 (88.4%) | 105 (11.6%) |
Income Below Poverty Among Single-Parent Households in Wilkinson County
According to the poverty data in Wilkinson County, 1.5% or 2 single-father households and 24.6% or 210 single-mother households are living below the poverty line. Among single-father households, those with 1 or 2 children have the highest poverty rate, with 2 households (25.0%) experiencing poverty. Likewise, among single-mother households, those with 5 or more children have the highest poverty rate, with 9 households (100.0%) falling below the poverty line.
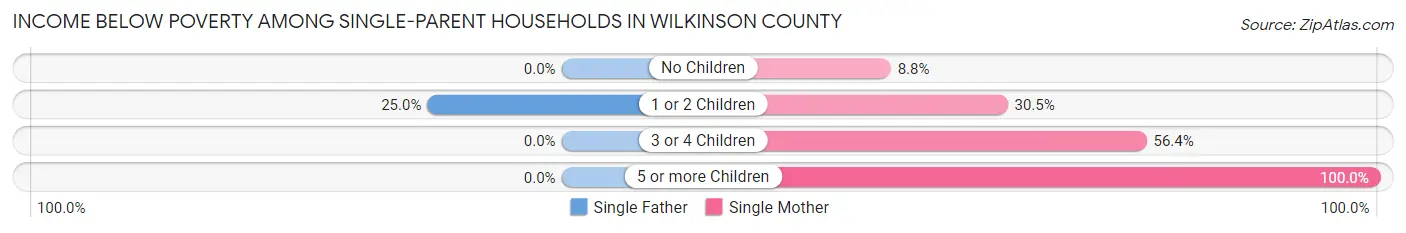
| Children | Single Father | Single Mother |
| No Children | 0 (0.0%) | 27 (8.8%) |
| 1 or 2 Children | 2 (25.0%) | 152 (30.5%) |
| 3 or 4 Children | 0 (0.0%) | 22 (56.4%) |
| 5 or more Children | 0 (0.0%) | 9 (100.0%) |
| Total | 2 (1.5%) | 210 (24.6%) |
Income Below Poverty Among Married-Couple vs Single-Parent Households in Wilkinson County
The poverty data for Wilkinson County shows that 105 of the married-couple family households (11.6%) and 212 of the single-parent households (21.6%) are living below the poverty level. Within the married-couple family households, those with 1 or 2 children have the highest poverty rate, with 42 households (15.3%) falling below the poverty line. Among the single-parent households, those with 5 or more children have the highest poverty rate, with 9 household (100.0%) living below poverty.
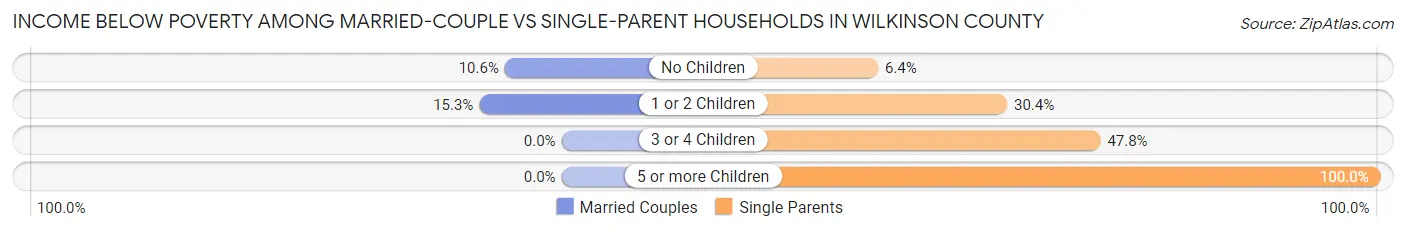
| Children | Married-Couple Families | Single-Parent Households |
| No Children | 63 (10.6%) | 27 (6.4%) |
| 1 or 2 Children | 42 (15.3%) | 154 (30.4%) |
| 3 or 4 Children | 0 (0.0%) | 22 (47.8%) |
| 5 or more Children | 0 (0.0%) | 9 (100.0%) |
| Total | 105 (11.6%) | 212 (21.6%) |
Race in Wilkinson County
The most populous races in Wilkinson County are Black / African American (5,748 | 67.4%), White / Caucasian (2,458 | 28.8%), and Some other Race (196 | 2.3%).
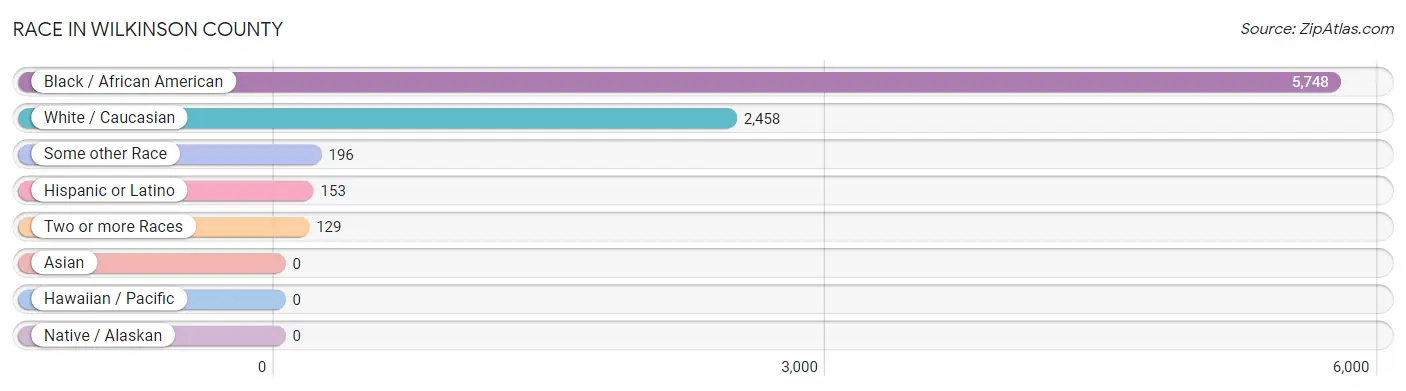
| Race | # Population | % Population |
| Asian | 0 | 0.0% |
| Black / African American | 5,748 | 67.4% |
| Hawaiian / Pacific | 0 | 0.0% |
| Hispanic or Latino | 153 | 1.8% |
| Native / Alaskan | 0 | 0.0% |
| White / Caucasian | 2,458 | 28.8% |
| Two or more Races | 129 | 1.5% |
| Some other Race | 196 | 2.3% |
| Total | 8,531 | 100.0% |
Ancestry in Wilkinson County
The most populous ancestries reported in Wilkinson County are Irish (372 | 4.4%), English (287 | 3.4%), American (278 | 3.3%), German (277 | 3.3%), and African (151 | 1.8%), together accounting for 16.0% of all Wilkinson County residents.
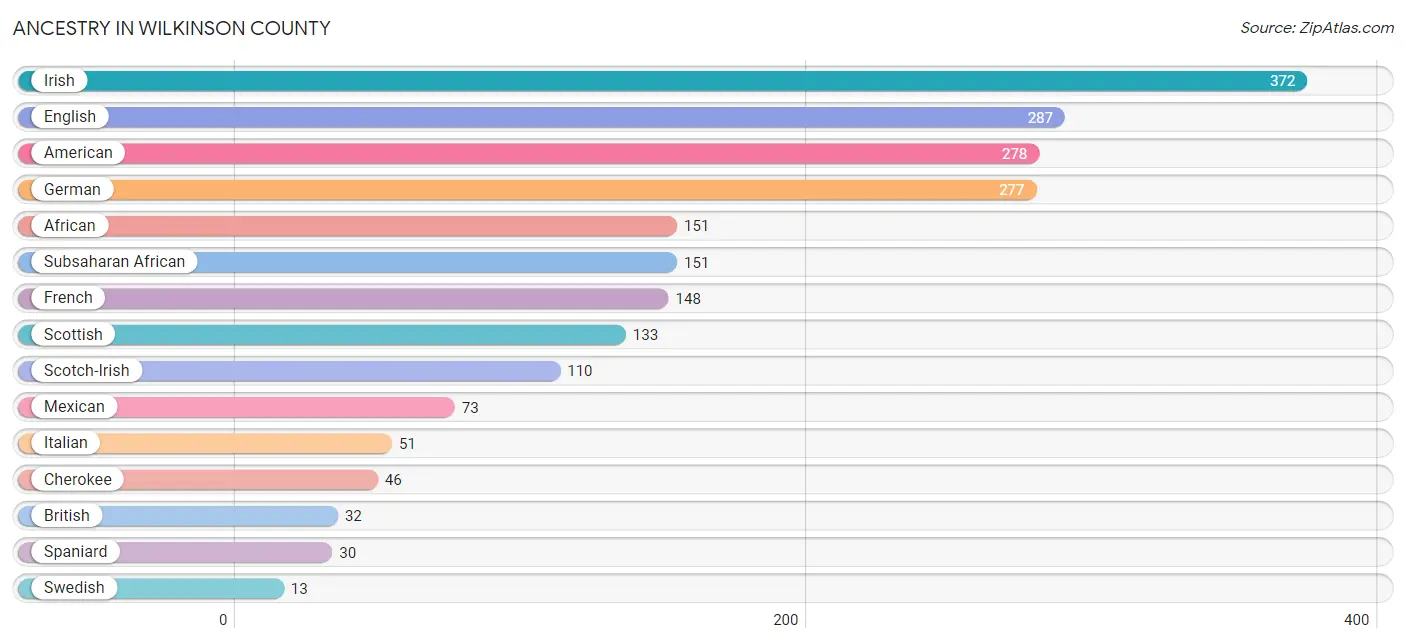
| Ancestry | # Population | % Population |
| African | 151 | 1.8% |
| American | 278 | 3.3% |
| British | 32 | 0.4% |
| Cajun | 4 | 0.1% |
| Cherokee | 46 | 0.5% |
| Dutch | 4 | 0.1% |
| English | 287 | 3.4% |
| European | 9 | 0.1% |
| French | 148 | 1.7% |
| German | 277 | 3.3% |
| Irish | 372 | 4.4% |
| Italian | 51 | 0.6% |
| Mexican | 73 | 0.9% |
| Scotch-Irish | 110 | 1.3% |
| Scottish | 133 | 1.6% |
| Spaniard | 30 | 0.4% |
| Subsaharan African | 151 | 1.8% |
| Swedish | 13 | 0.2% | View All 18 Rows |
Immigrants in Wilkinson County

| Immigration Origin | # Population | % Population | View All 0 Rows |
Sex and Age in Wilkinson County
Sex and Age in Wilkinson County
The most populous age groups in Wilkinson County are 35 to 39 Years (441 | 9.6%) for men and 65 to 69 Years (380 | 9.6%) for women.
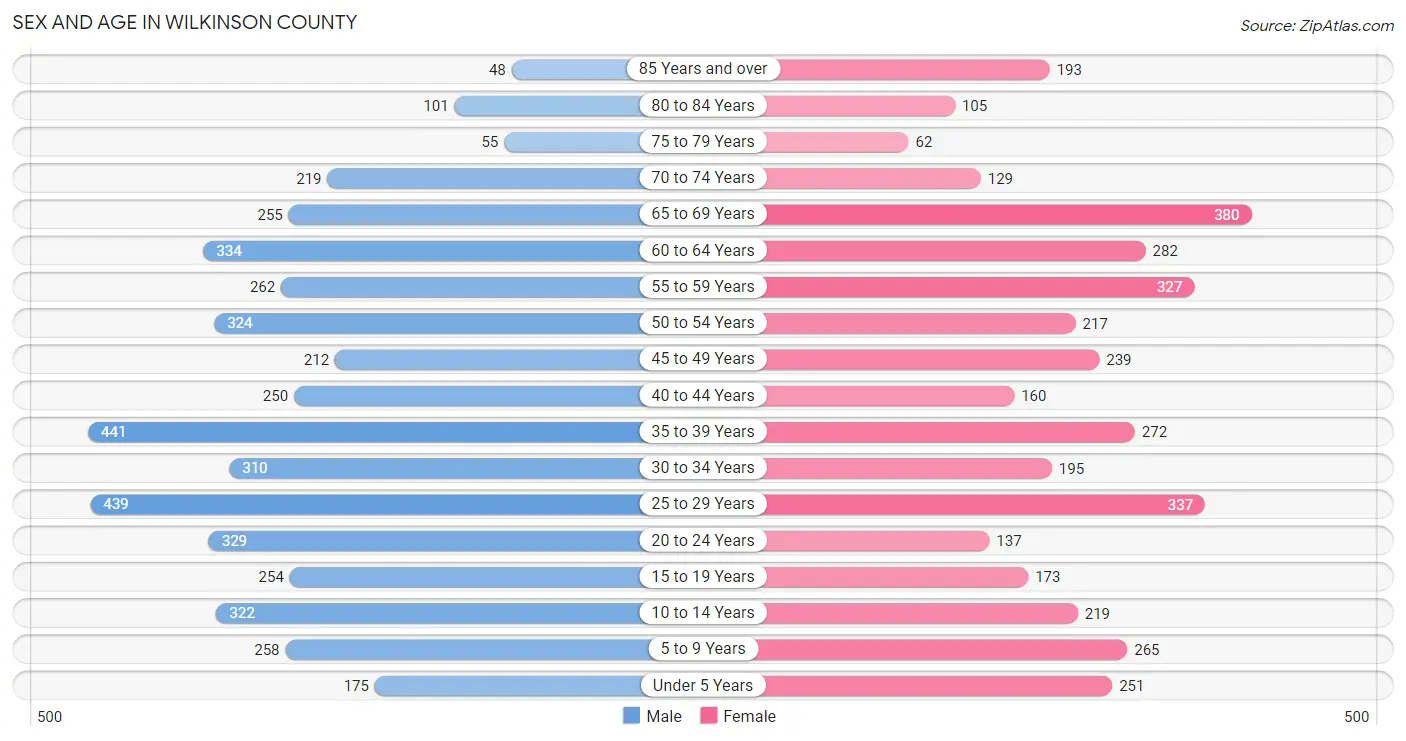
| Age Bracket | Male | Female |
| Under 5 Years | 175 (3.8%) | 251 (6.4%) |
| 5 to 9 Years | 258 (5.6%) | 265 (6.7%) |
| 10 to 14 Years | 322 (7.0%) | 219 (5.6%) |
| 15 to 19 Years | 254 (5.5%) | 173 (4.4%) |
| 20 to 24 Years | 329 (7.2%) | 137 (3.5%) |
| 25 to 29 Years | 439 (9.6%) | 337 (8.6%) |
| 30 to 34 Years | 310 (6.8%) | 195 (5.0%) |
| 35 to 39 Years | 441 (9.6%) | 272 (6.9%) |
| 40 to 44 Years | 250 (5.4%) | 160 (4.1%) |
| 45 to 49 Years | 212 (4.6%) | 239 (6.1%) |
| 50 to 54 Years | 324 (7.1%) | 217 (5.5%) |
| 55 to 59 Years | 262 (5.7%) | 327 (8.3%) |
| 60 to 64 Years | 334 (7.3%) | 282 (7.1%) |
| 65 to 69 Years | 255 (5.6%) | 380 (9.6%) |
| 70 to 74 Years | 219 (4.8%) | 129 (3.3%) |
| 75 to 79 Years | 55 (1.2%) | 62 (1.6%) |
| 80 to 84 Years | 101 (2.2%) | 105 (2.7%) |
| 85 Years and over | 48 (1.1%) | 193 (4.9%) |
| Total | 4,588 (100.0%) | 3,943 (100.0%) |
Families and Households in Wilkinson County
Median Family Size in Wilkinson County
The median family size in Wilkinson County is 3.14 persons per family, with single female/mother families (854 | 45.2%) accounting for the largest median family size of 3.18 persons per family. On the other hand, single male/father families (129 | 6.8%) represent the smallest median family size with 2.60 persons per family.
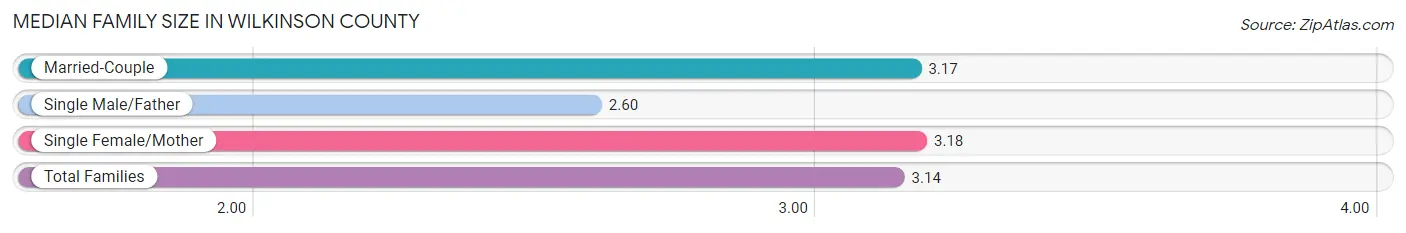
| Family Type | # Families | Family Size |
| Married-Couple | 907 (48.0%) | 3.17 |
| Single Male/Father | 129 (6.8%) | 2.60 |
| Single Female/Mother | 854 (45.2%) | 3.18 |
| Total Families | 1,890 (100.0%) | 3.14 |
Median Household Size in Wilkinson County
The median household size in Wilkinson County is 2.28 persons per household, with single female/mother households (854 | 26.2%) accounting for the largest median household size of 3.27 persons per household. non-family households (1,374 | 42.1%) represent the smallest median household size with 1.05 persons per household.
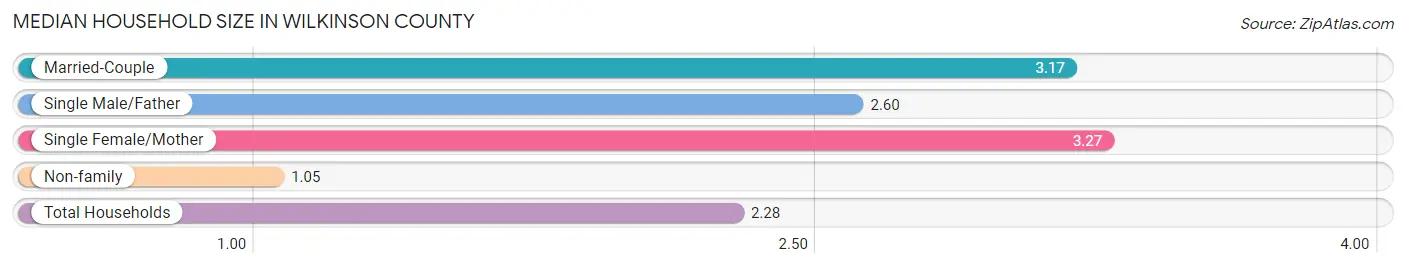
| Household Type | # Households | Household Size |
| Married-Couple | 907 (27.8%) | 3.17 |
| Single Male/Father | 129 (4.0%) | 2.60 |
| Single Female/Mother | 854 (26.2%) | 3.27 |
| Non-family | 1,374 (42.1%) | 1.05 |
| Total Households | 3,264 (100.0%) | 2.28 |
Household Size by Marriage Status in Wilkinson County
Out of a total of 3,264 households in Wilkinson County, 1,890 (57.9%) are family households, while 1,374 (42.1%) are nonfamily households. The most numerous type of family households are 2-person households, comprising 913, and the most common type of nonfamily households are 1-person households, comprising 1,256.
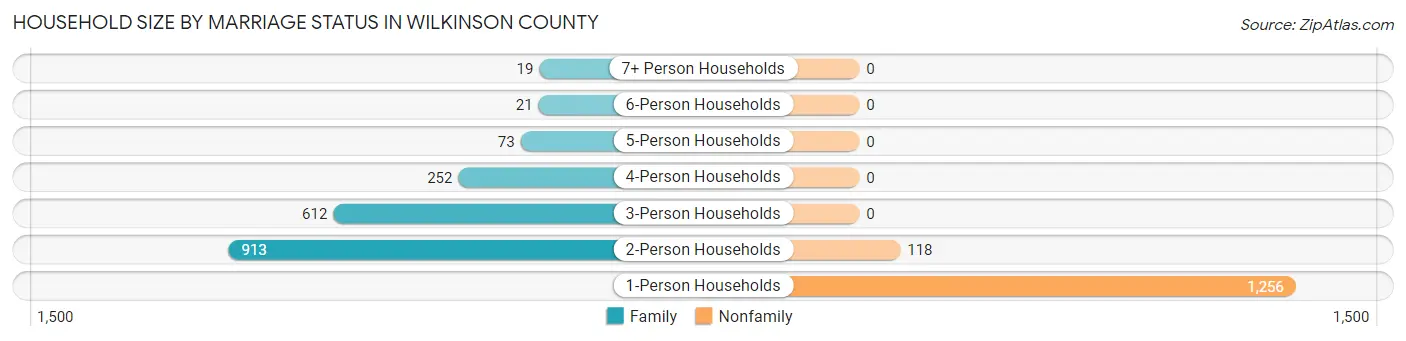
| Household Size | Family Households | Nonfamily Households |
| 1-Person Households | - | 1,256 (38.5%) |
| 2-Person Households | 913 (28.0%) | 118 (3.6%) |
| 3-Person Households | 612 (18.8%) | 0 (0.0%) |
| 4-Person Households | 252 (7.7%) | 0 (0.0%) |
| 5-Person Households | 73 (2.2%) | 0 (0.0%) |
| 6-Person Households | 21 (0.6%) | 0 (0.0%) |
| 7+ Person Households | 19 (0.6%) | 0 (0.0%) |
| Total | 1,890 (57.9%) | 1,374 (42.1%) |
Female Fertility in Wilkinson County
Fertility by Age in Wilkinson County
Average fertility rate in Wilkinson County is 48.0 births per 1,000 women. Women in the age bracket of 20 to 34 years have the highest fertility rate with 57.0 births per 1,000 women. Women in the age bracket of 20 to 34 years acount for 50.0% of all women with births.
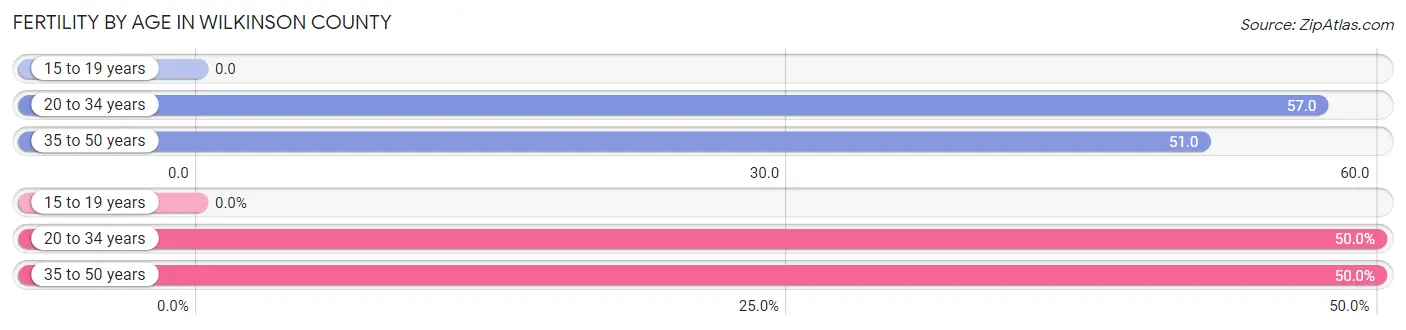
| Age Bracket | Women with Births | Births / 1,000 Women |
| 15 to 19 years | 0 (0.0%) | 0.0 |
| 20 to 34 years | 38 (50.0%) | 57.0 |
| 35 to 50 years | 38 (50.0%) | 51.0 |
| Total | 76 (100.0%) | 48.0 |
Fertility by Age by Marriage Status in Wilkinson County
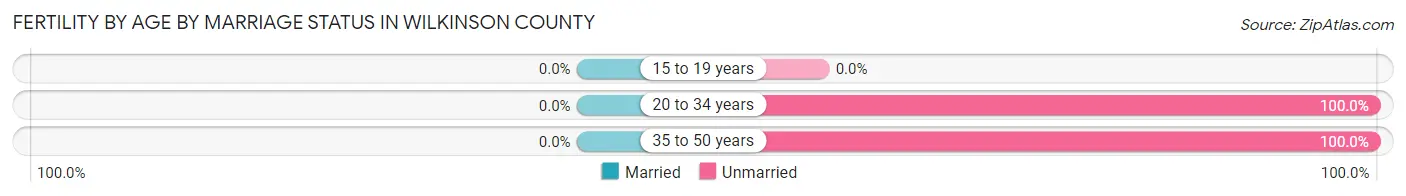
| Age Bracket | Married | Unmarried |
| 15 to 19 years | 0 (0.0%) | 0 (0.0%) |
| 20 to 34 years | 0 (0.0%) | 38 (100.0%) |
| 35 to 50 years | 0 (0.0%) | 38 (100.0%) |
| Total | 0 (0.0%) | 76 (100.0%) |
Fertility by Education in Wilkinson County
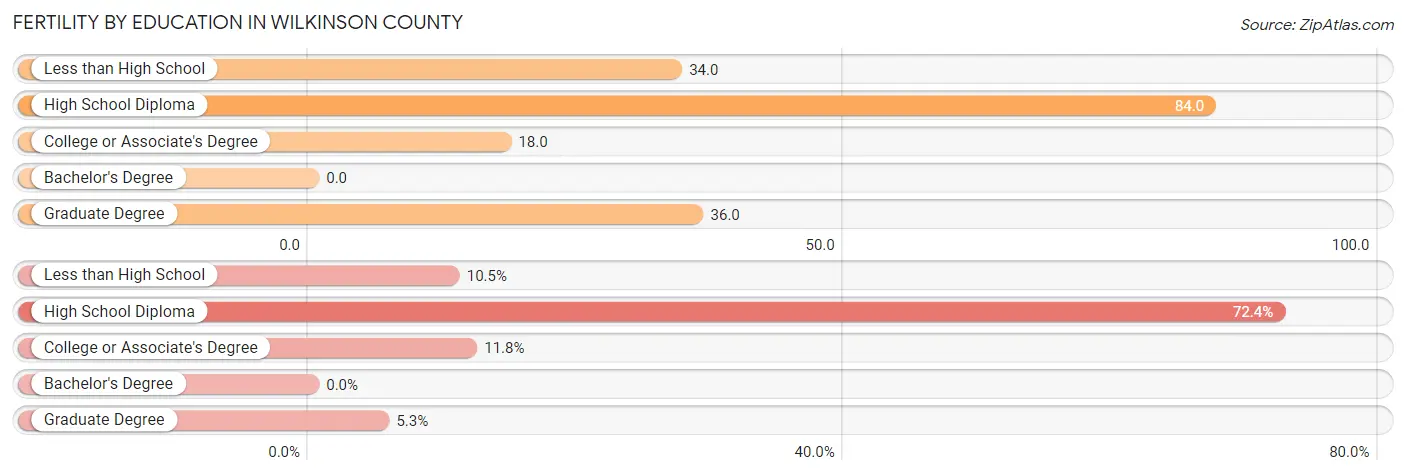
| Educational Attainment | Women with Births | Births / 1,000 Women |
| Less than High School | 8 (10.5%) | 34.0 |
| High School Diploma | 55 (72.4%) | 84.0 |
| College or Associate's Degree | 9 (11.8%) | 18.0 |
| Bachelor's Degree | 0 (0.0%) | 0.0 |
| Graduate Degree | 4 (5.3%) | 36.0 |
| Total | 76 (100.0%) | 48.0 |
Fertility by Education by Marriage Status in Wilkinson County
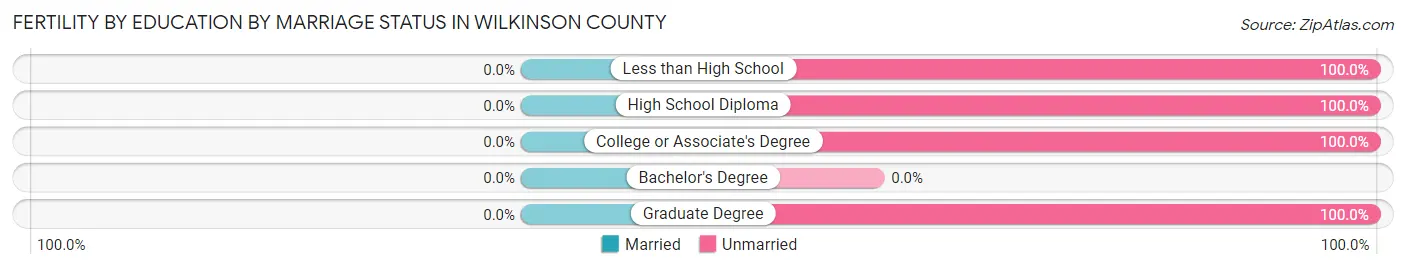
| Educational Attainment | Married | Unmarried |
| Less than High School | 0 (0.0%) | 8 (100.0%) |
| High School Diploma | 0 (0.0%) | 55 (100.0%) |
| College or Associate's Degree | 0 (0.0%) | 9 (100.0%) |
| Bachelor's Degree | 0 (0.0%) | 0 (0.0%) |
| Graduate Degree | 0 (0.0%) | 4 (100.0%) |
| Total | 0 (0.0%) | 76 (100.0%) |
Employment Characteristics in Wilkinson County
Employment by Class of Employer in Wilkinson County
Among the 2,773 employed individuals in Wilkinson County, private company employees (1,682 | 60.7%), state government employees (469 | 16.9%), and self-employed (incorporated) (227 | 8.2%) make up the most common classes of employment.
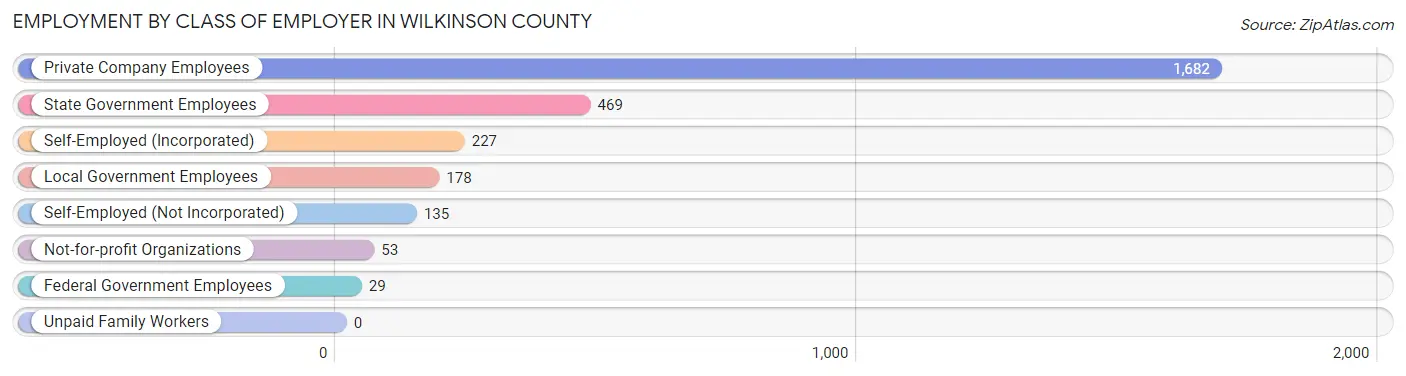
| Employer Class | # Employees | % Employees |
| Private Company Employees | 1,682 | 60.7% |
| Self-Employed (Incorporated) | 227 | 8.2% |
| Self-Employed (Not Incorporated) | 135 | 4.9% |
| Not-for-profit Organizations | 53 | 1.9% |
| Local Government Employees | 178 | 6.4% |
| State Government Employees | 469 | 16.9% |
| Federal Government Employees | 29 | 1.1% |
| Unpaid Family Workers | 0 | 0.0% |
| Total | 2,773 | 100.0% |
Employment Status by Age in Wilkinson County
According to the labor force statistics for Wilkinson County, out of the total population over 16 years of age (6,956), 42.9% or 2,984 individuals are in the labor force, with 6.3% or 188 of them unemployed. The age group with the highest labor force participation rate is 35 to 44 years, with 72.4% or 813 individuals in the labor force. Within the labor force, the 16 to 19 years age range has the highest percentage of unemployed individuals, with 50.0% or 16 of them being unemployed.
| Age Bracket | In Labor Force | Unemployed |
| 16 to 19 Years | 32 (9.4%) | 16 (50.0%) |
| 20 to 24 Years | 271 (58.2%) | 117 (43.2%) |
| 25 to 29 Years | 279 (36.0%) | 3 (1.1%) |
| 30 to 34 Years | 243 (48.1%) | 14 (5.8%) |
| 35 to 44 Years | 813 (72.4%) | 22 (2.7%) |
| 45 to 54 Years | 592 (59.7%) | 11 (1.9%) |
| 55 to 59 Years | 408 (69.3%) | 2 (0.5%) |
| 60 to 64 Years | 197 (32.0%) | 0 (0.0%) |
| 65 to 74 Years | 141 (14.3%) | 3 (2.1%) |
| 75 Years and over | 10 (1.8%) | 0 (0.0%) |
| Total | 2,984 (42.9%) | 188 (6.3%) |
Employment Status by Educational Attainment in Wilkinson County
According to labor force statistics for Wilkinson County, 55.0% of individuals (2,531) out of the total population between 25 and 64 years of age (4,601) are in the labor force, with 2.1% or 53 of them being unemployed. The group with the highest labor force participation rate are those with the educational attainment of bachelor's degree or higher, with 88.5% or 422 individuals in the labor force. Within the labor force, individuals with less than high school education have the highest percentage of unemployment, with 17.7% or 22 of them being unemployed.
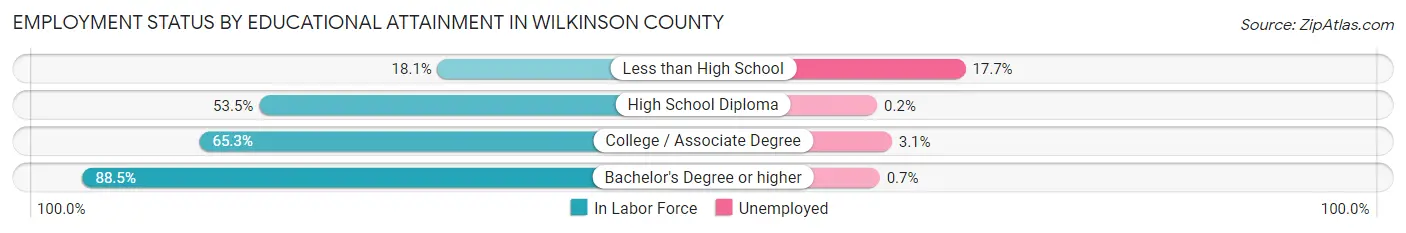
| Educational Attainment | In Labor Force | Unemployed |
| Less than High School | 124 (18.1%) | 121 (17.7%) |
| High School Diploma | 1,178 (53.5%) | 4 (0.2%) |
| College / Associate Degree | 808 (65.3%) | 38 (3.1%) |
| Bachelor's Degree or higher | 422 (88.5%) | 3 (0.7%) |
| Total | 2,531 (55.0%) | 97 (2.1%) |
Employment Occupations by Sex in Wilkinson County
Management, Business, Science and Arts Occupations
The most common Management, Business, Science and Arts occupations in Wilkinson County are Community & Social Service (437 | 15.6%), Arts, Media & Entertainment (198 | 7.1%), Education Instruction & Library (129 | 4.6%), Management (70 | 2.5%), and Legal Services & Support (62 | 2.2%).
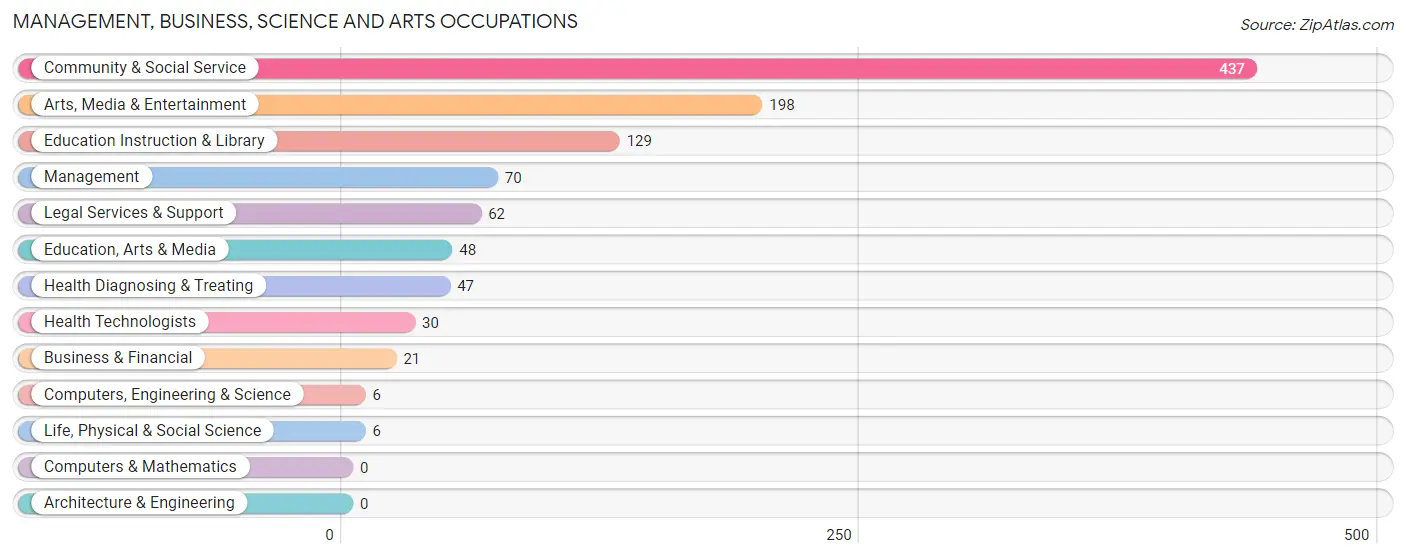
Management, Business, Science and Arts Occupations by Sex
Within the Management, Business, Science and Arts occupations in Wilkinson County, the most male-oriented occupations are Arts, Media & Entertainment (93.4%), Education, Arts & Media (64.6%), and Computers, Engineering & Science (50.0%), while the most female-oriented occupations are Legal Services & Support (100.0%), Education Instruction & Library (100.0%), and Business & Financial (80.9%).
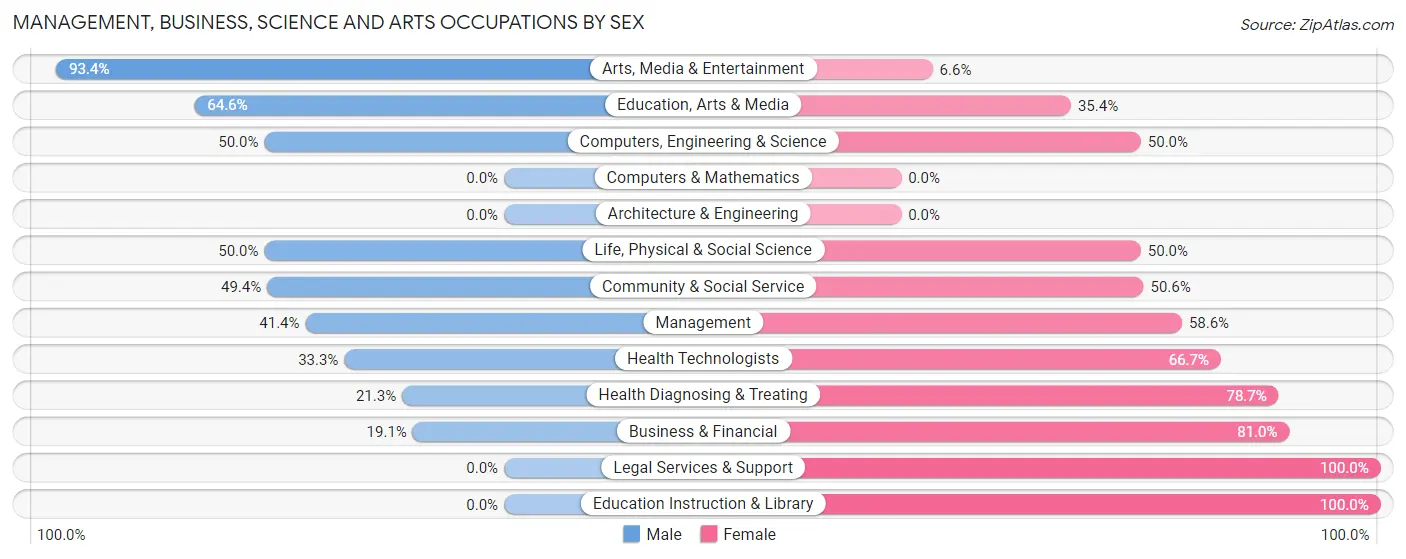
| Occupation | Male | Female |
| Management | 29 (41.4%) | 41 (58.6%) |
| Business & Financial | 4 (19.1%) | 17 (80.9%) |
| Computers, Engineering & Science | 3 (50.0%) | 3 (50.0%) |
| Computers & Mathematics | 0 (0.0%) | 0 (0.0%) |
| Architecture & Engineering | 0 (0.0%) | 0 (0.0%) |
| Life, Physical & Social Science | 3 (50.0%) | 3 (50.0%) |
| Community & Social Service | 216 (49.4%) | 221 (50.6%) |
| Education, Arts & Media | 31 (64.6%) | 17 (35.4%) |
| Legal Services & Support | 0 (0.0%) | 62 (100.0%) |
| Education Instruction & Library | 0 (0.0%) | 129 (100.0%) |
| Arts, Media & Entertainment | 185 (93.4%) | 13 (6.6%) |
| Health Diagnosing & Treating | 10 (21.3%) | 37 (78.7%) |
| Health Technologists | 10 (33.3%) | 20 (66.7%) |
| Total (Category) | 262 (45.1%) | 319 (54.9%) |
| Total (Overall) | 1,353 (48.4%) | 1,445 (51.6%) |
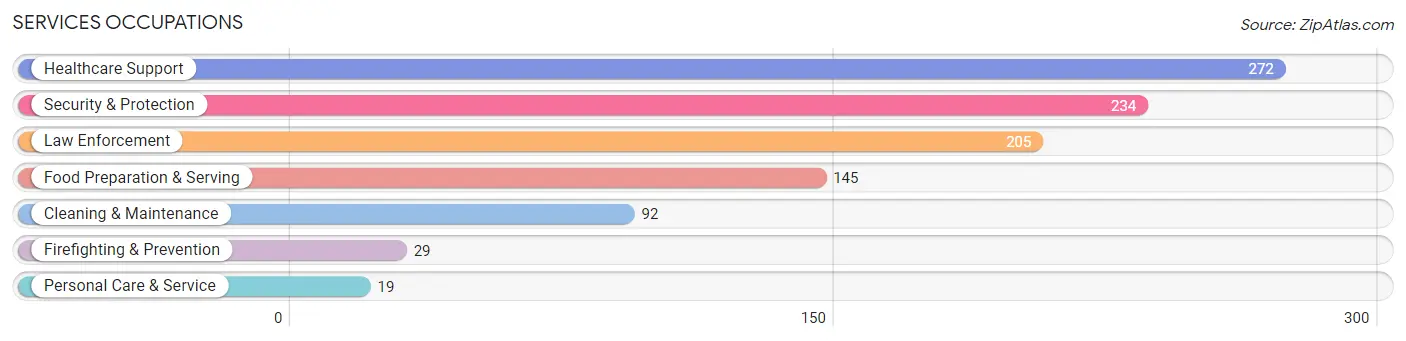
Services Occupations
The most common Services occupations in Wilkinson County are Healthcare Support (272 | 9.7%), Security & Protection (234 | 8.4%), Law Enforcement (205 | 7.3%), Food Preparation & Serving (145 | 5.2%), and Cleaning & Maintenance (92 | 3.3%).
Services Occupations by Sex
Within the Services occupations in Wilkinson County, the most male-oriented occupations are Firefighting & Prevention (69.0%), Food Preparation & Serving (48.3%), and Security & Protection (44.4%), while the most female-oriented occupations are Personal Care & Service (100.0%), Cleaning & Maintenance (93.5%), and Healthcare Support (88.6%).
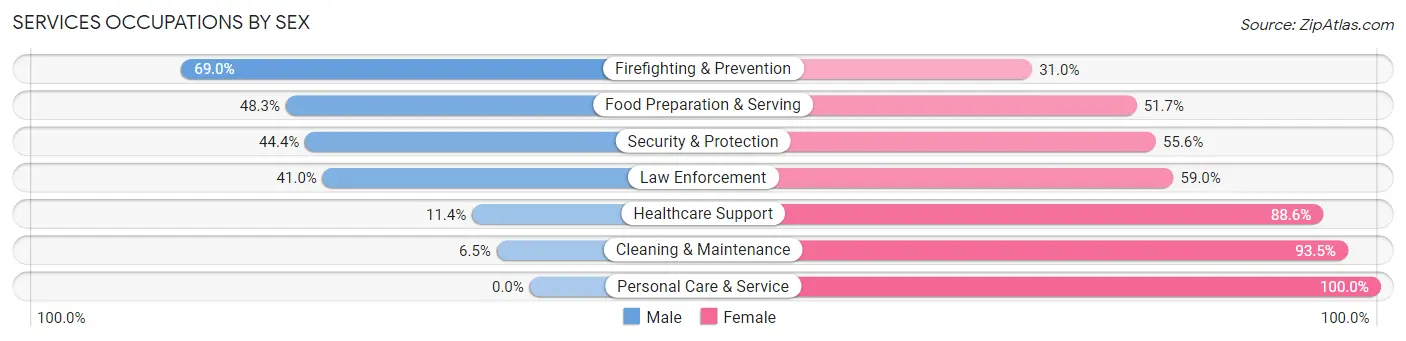
| Occupation | Male | Female |
| Healthcare Support | 31 (11.4%) | 241 (88.6%) |
| Security & Protection | 104 (44.4%) | 130 (55.6%) |
| Firefighting & Prevention | 20 (69.0%) | 9 (31.0%) |
| Law Enforcement | 84 (41.0%) | 121 (59.0%) |
| Food Preparation & Serving | 70 (48.3%) | 75 (51.7%) |
| Cleaning & Maintenance | 6 (6.5%) | 86 (93.5%) |
| Personal Care & Service | 0 (0.0%) | 19 (100.0%) |
| Total (Category) | 211 (27.7%) | 551 (72.3%) |
| Total (Overall) | 1,353 (48.4%) | 1,445 (51.6%) |
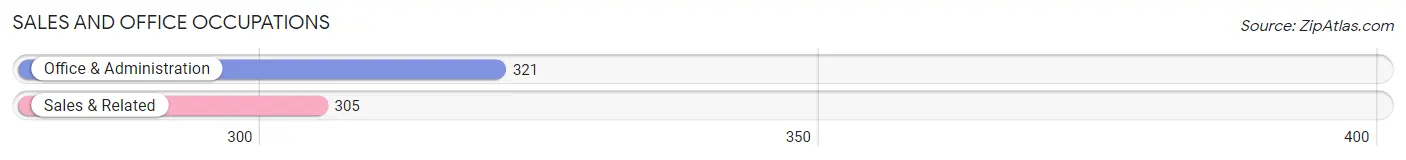
Sales and Office Occupations
The most common Sales and Office occupations in Wilkinson County are Office & Administration (321 | 11.5%), and Sales & Related (305 | 10.9%).
Sales and Office Occupations by Sex
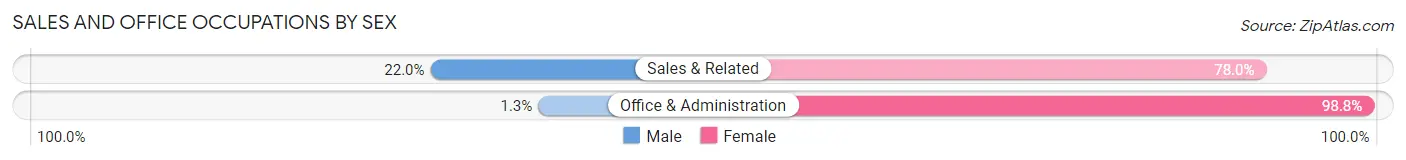
| Occupation | Male | Female |
| Sales & Related | 67 (22.0%) | 238 (78.0%) |
| Office & Administration | 4 (1.3%) | 317 (98.8%) |
| Total (Category) | 71 (11.3%) | 555 (88.7%) |
| Total (Overall) | 1,353 (48.4%) | 1,445 (51.6%) |
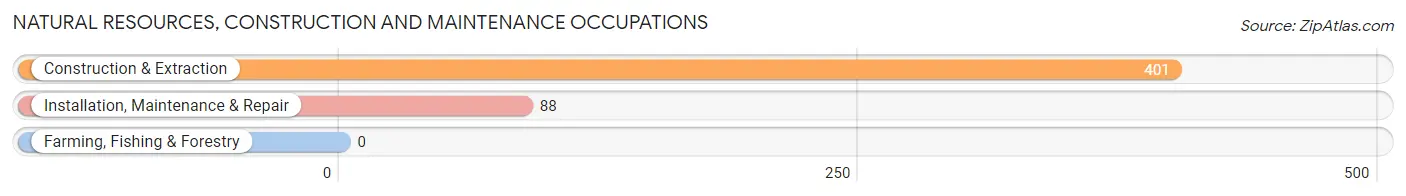
Natural Resources, Construction and Maintenance Occupations
The most common Natural Resources, Construction and Maintenance occupations in Wilkinson County are Construction & Extraction (401 | 14.3%), and Installation, Maintenance & Repair (88 | 3.2%).
Natural Resources, Construction and Maintenance Occupations by Sex
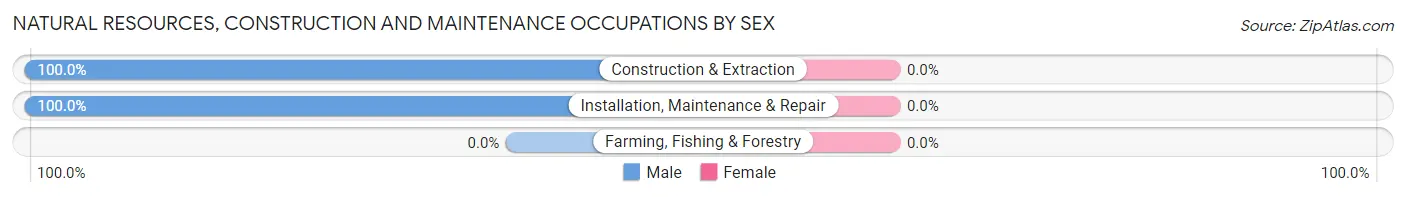
| Occupation | Male | Female |
| Farming, Fishing & Forestry | 0 (0.0%) | 0 (0.0%) |
| Construction & Extraction | 401 (100.0%) | 0 (0.0%) |
| Installation, Maintenance & Repair | 88 (100.0%) | 0 (0.0%) |
| Total (Category) | 489 (100.0%) | 0 (0.0%) |
| Total (Overall) | 1,353 (48.4%) | 1,445 (51.6%) |
Production, Transportation and Moving Occupations
The most common Production, Transportation and Moving occupations in Wilkinson County are Production (165 | 5.9%), Transportation (109 | 3.9%), and Material Moving (66 | 2.4%).
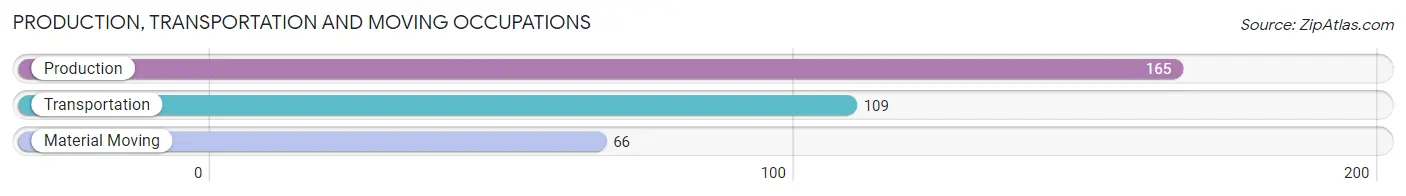
Production, Transportation and Moving Occupations by Sex
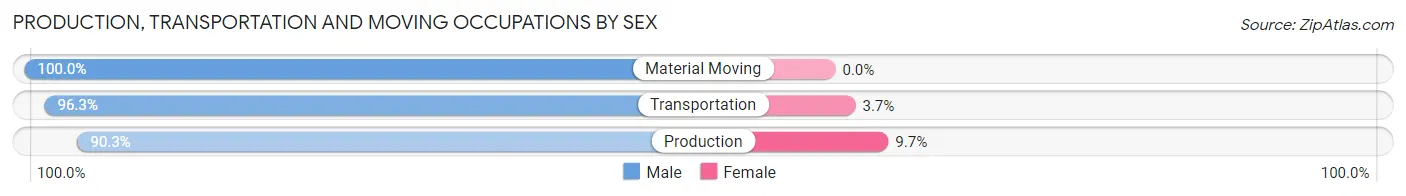
| Occupation | Male | Female |
| Production | 149 (90.3%) | 16 (9.7%) |
| Transportation | 105 (96.3%) | 4 (3.7%) |
| Material Moving | 66 (100.0%) | 0 (0.0%) |
| Total (Category) | 320 (94.1%) | 20 (5.9%) |
| Total (Overall) | 1,353 (48.4%) | 1,445 (51.6%) |
Employment Industries by Sex in Wilkinson County
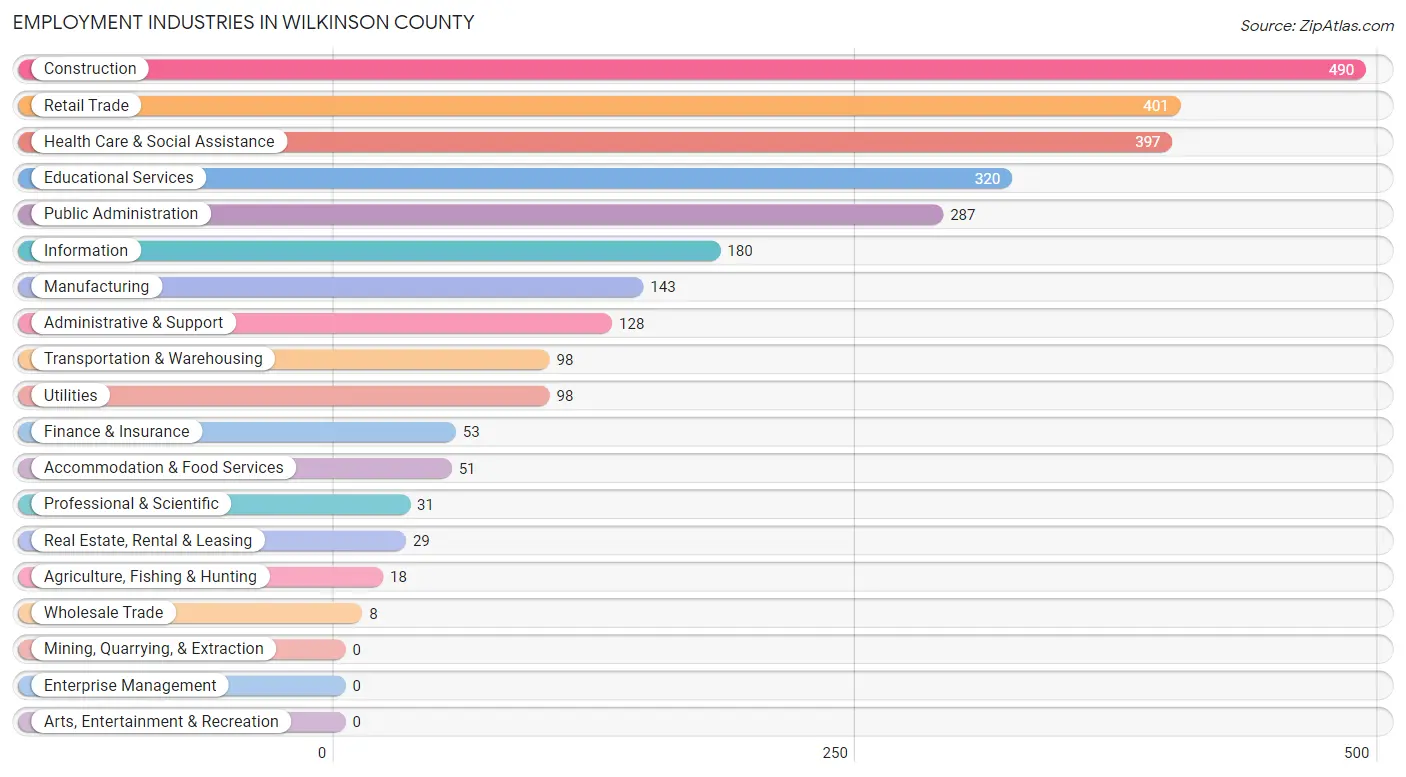
Employment Industries in Wilkinson County
The major employment industries in Wilkinson County include Construction (490 | 17.5%), Retail Trade (401 | 14.3%), Health Care & Social Assistance (397 | 14.2%), Educational Services (320 | 11.4%), and Public Administration (287 | 10.3%).
Employment Industries by Sex in Wilkinson County
The Wilkinson County industries that see more men than women are Manufacturing (100.0%), Wholesale Trade (100.0%), and Transportation & Warehousing (100.0%), whereas the industries that tend to have a higher number of women are Finance & Insurance (100.0%), Accommodation & Food Services (100.0%), and Health Care & Social Assistance (85.6%).
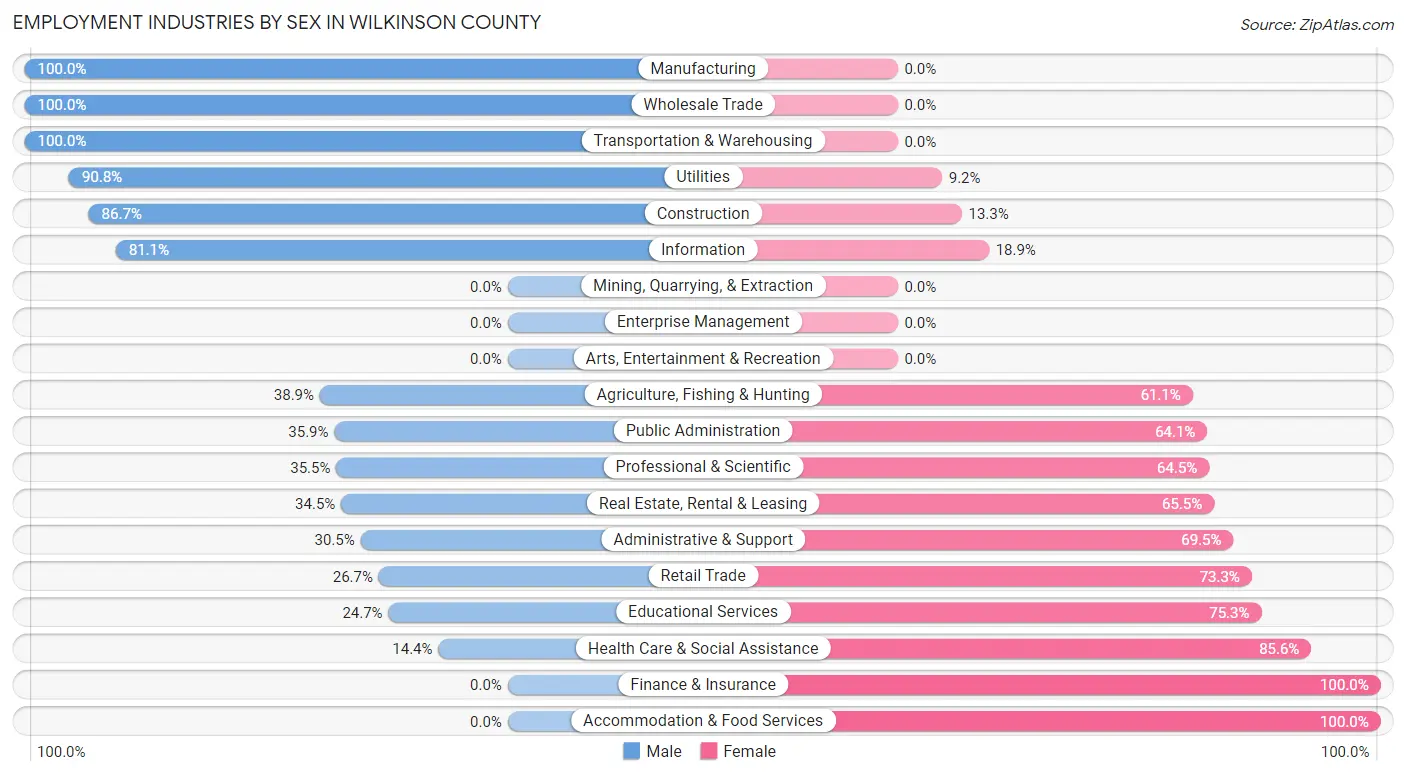
| Industry | Male | Female |
| Agriculture, Fishing & Hunting | 7 (38.9%) | 11 (61.1%) |
| Mining, Quarrying, & Extraction | 0 (0.0%) | 0 (0.0%) |
| Construction | 425 (86.7%) | 65 (13.3%) |
| Manufacturing | 143 (100.0%) | 0 (0.0%) |
| Wholesale Trade | 8 (100.0%) | 0 (0.0%) |
| Retail Trade | 107 (26.7%) | 294 (73.3%) |
| Transportation & Warehousing | 98 (100.0%) | 0 (0.0%) |
| Utilities | 89 (90.8%) | 9 (9.2%) |
| Information | 146 (81.1%) | 34 (18.9%) |
| Finance & Insurance | 0 (0.0%) | 53 (100.0%) |
| Real Estate, Rental & Leasing | 10 (34.5%) | 19 (65.5%) |
| Professional & Scientific | 11 (35.5%) | 20 (64.5%) |
| Enterprise Management | 0 (0.0%) | 0 (0.0%) |
| Administrative & Support | 39 (30.5%) | 89 (69.5%) |
| Educational Services | 79 (24.7%) | 241 (75.3%) |
| Health Care & Social Assistance | 57 (14.4%) | 340 (85.6%) |
| Arts, Entertainment & Recreation | 0 (0.0%) | 0 (0.0%) |
| Accommodation & Food Services | 0 (0.0%) | 51 (100.0%) |
| Public Administration | 103 (35.9%) | 184 (64.1%) |
| Total | 1,353 (48.4%) | 1,445 (51.6%) |
Education in Wilkinson County
School Enrollment in Wilkinson County
The most common levels of schooling among the 1,506 students in Wilkinson County are elementary school (461 | 30.6%), high school (452 | 30.0%), and middle school (356 | 23.6%).
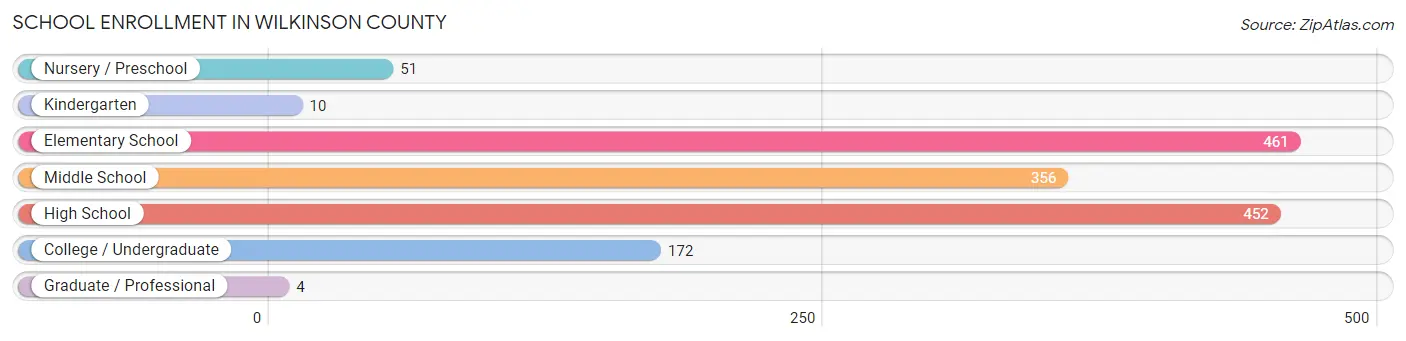
| School Level | # Students | % Students |
| Nursery / Preschool | 51 | 3.4% |
| Kindergarten | 10 | 0.7% |
| Elementary School | 461 | 30.6% |
| Middle School | 356 | 23.6% |
| High School | 452 | 30.0% |
| College / Undergraduate | 172 | 11.4% |
| Graduate / Professional | 4 | 0.3% |
| Total | 1,506 | 100.0% |
School Enrollment by Age by Funding Source in Wilkinson County
Out of a total of 1,506 students who are enrolled in schools in Wilkinson County, 309 (20.5%) attend a private institution, while the remaining 1,197 (79.5%) are enrolled in public schools. The age group of 25 to 34 year olds has the highest likelihood of being enrolled in private schools, with 40 (62.5% in the age bracket) enrolled. Conversely, the age group of 18 to 19 year olds has the lowest likelihood of being enrolled in a private school, with 61 (100.0% in the age bracket) attending a public institution.
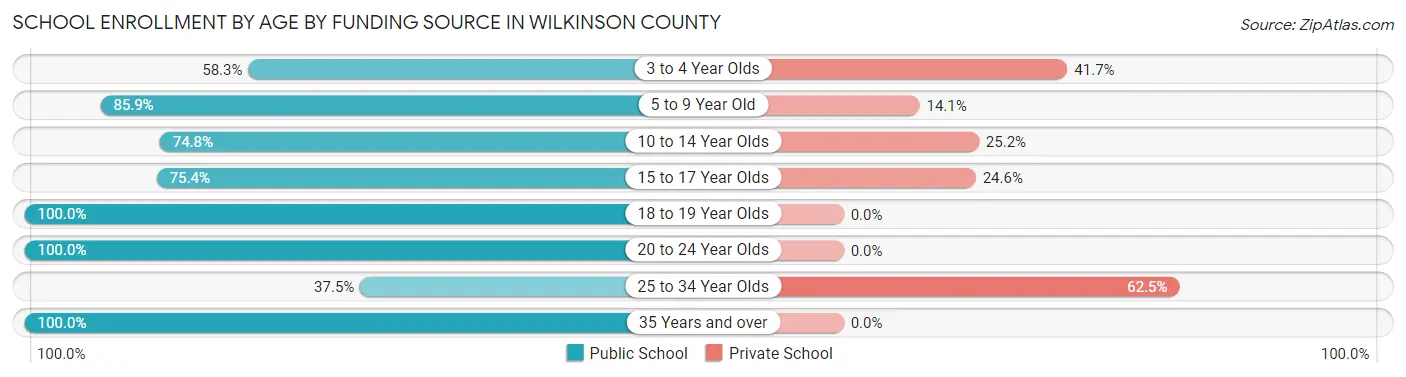
| Age Bracket | Public School | Private School |
| 3 to 4 Year Olds | 14 (58.3%) | 10 (41.7%) |
| 5 to 9 Year Old | 395 (85.9%) | 65 (14.1%) |
| 10 to 14 Year Olds | 395 (74.8%) | 133 (25.2%) |
| 15 to 17 Year Olds | 187 (75.4%) | 61 (24.6%) |
| 18 to 19 Year Olds | 61 (100.0%) | 0 (0.0%) |
| 20 to 24 Year Olds | 20 (100.0%) | 0 (0.0%) |
| 25 to 34 Year Olds | 24 (37.5%) | 40 (62.5%) |
| 35 Years and over | 101 (100.0%) | 0 (0.0%) |
| Total | 1,197 (79.5%) | 309 (20.5%) |
Educational Attainment by Field of Study in Wilkinson County
Business (214 | 29.7%), education (172 | 23.9%), liberal arts & history (80 | 11.1%), science & technology (75 | 10.4%), and computers & mathematics (40 | 5.6%) are the most common fields of study among 720 individuals in Wilkinson County who have obtained a bachelor's degree or higher.
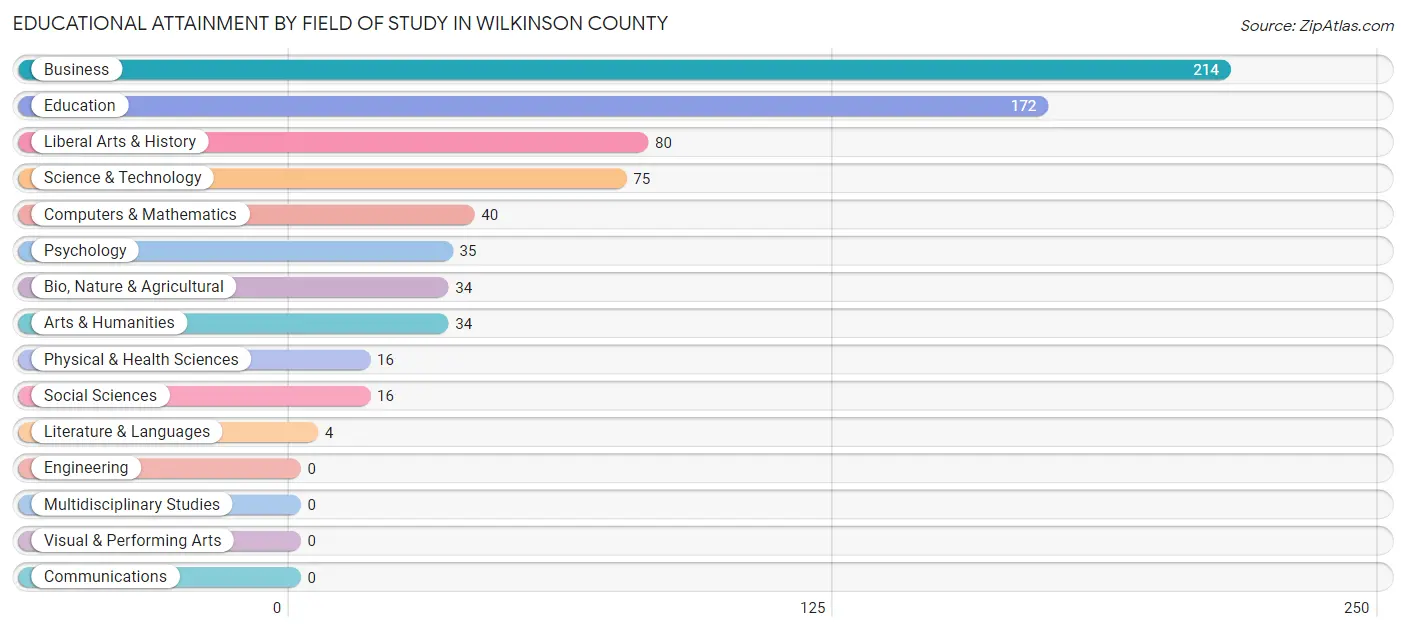
| Field of Study | # Graduates | % Graduates |
| Computers & Mathematics | 40 | 5.6% |
| Bio, Nature & Agricultural | 34 | 4.7% |
| Physical & Health Sciences | 16 | 2.2% |
| Psychology | 35 | 4.9% |
| Social Sciences | 16 | 2.2% |
| Engineering | 0 | 0.0% |
| Multidisciplinary Studies | 0 | 0.0% |
| Science & Technology | 75 | 10.4% |
| Business | 214 | 29.7% |
| Education | 172 | 23.9% |
| Literature & Languages | 4 | 0.6% |
| Liberal Arts & History | 80 | 11.1% |
| Visual & Performing Arts | 0 | 0.0% |
| Communications | 0 | 0.0% |
| Arts & Humanities | 34 | 4.7% |
| Total | 720 | 100.0% |
Transportation & Commute in Wilkinson County
Vehicle Availability by Sex in Wilkinson County
The most prevalent vehicle ownership categories in Wilkinson County are males with 1 vehicle (631, accounting for 47.4%) and females with 1 vehicle (519, making up 43.8%).
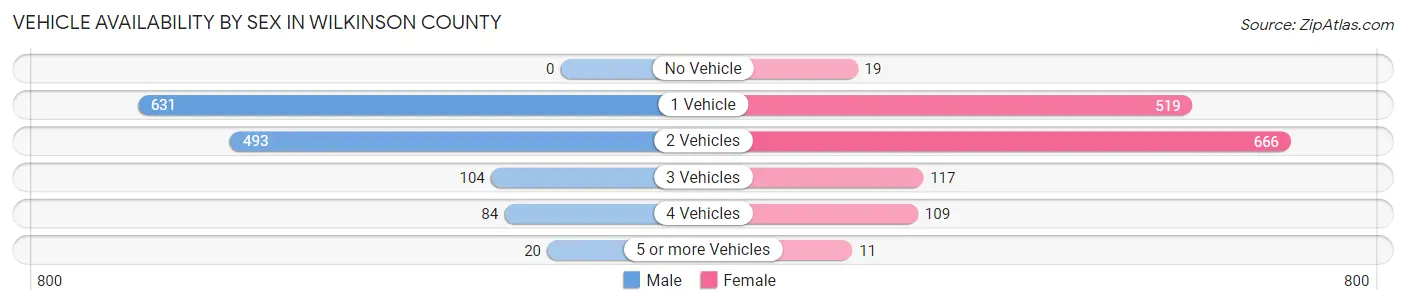
| Vehicles Available | Male | Female |
| No Vehicle | 0 (0.0%) | 19 (1.3%) |
| 1 Vehicle | 631 (47.4%) | 519 (36.0%) |
| 2 Vehicles | 493 (37.0%) | 666 (46.2%) |
| 3 Vehicles | 104 (7.8%) | 117 (8.1%) |
| 4 Vehicles | 84 (6.3%) | 109 (7.6%) |
| 5 or more Vehicles | 20 (1.5%) | 11 (0.8%) |
| Total | 1,332 (100.0%) | 1,441 (100.0%) |
Commute Time in Wilkinson County
The most frequently occuring commute durations in Wilkinson County are 60 to 89 minutes (627 commuters, 25.5%), 5 to 9 minutes (352 commuters, 14.3%), and 35 to 39 minutes (285 commuters, 11.6%).
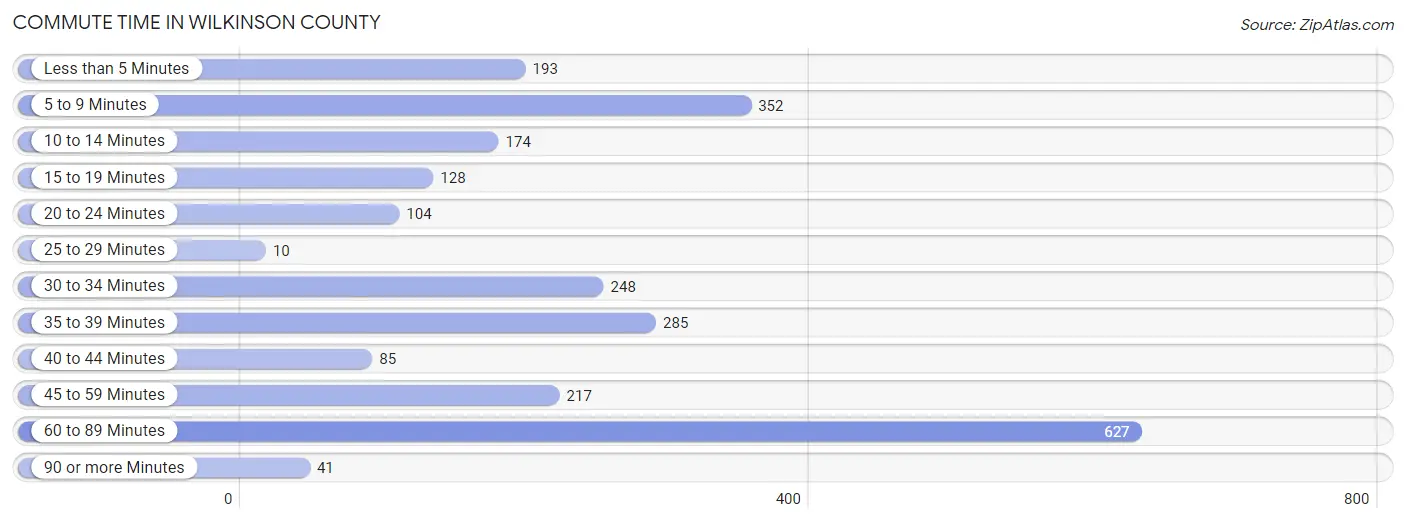
| Commute Time | # Commuters | % Commuters |
| Less than 5 Minutes | 193 | 7.8% |
| 5 to 9 Minutes | 352 | 14.3% |
| 10 to 14 Minutes | 174 | 7.1% |
| 15 to 19 Minutes | 128 | 5.2% |
| 20 to 24 Minutes | 104 | 4.2% |
| 25 to 29 Minutes | 10 | 0.4% |
| 30 to 34 Minutes | 248 | 10.1% |
| 35 to 39 Minutes | 285 | 11.6% |
| 40 to 44 Minutes | 85 | 3.5% |
| 45 to 59 Minutes | 217 | 8.8% |
| 60 to 89 Minutes | 627 | 25.5% |
| 90 or more Minutes | 41 | 1.7% |
Commute Time by Sex in Wilkinson County
The most common commute times in Wilkinson County are 60 to 89 minutes (443 commuters, 33.3%) for males and 60 to 89 minutes (184 commuters, 16.2%) for females.
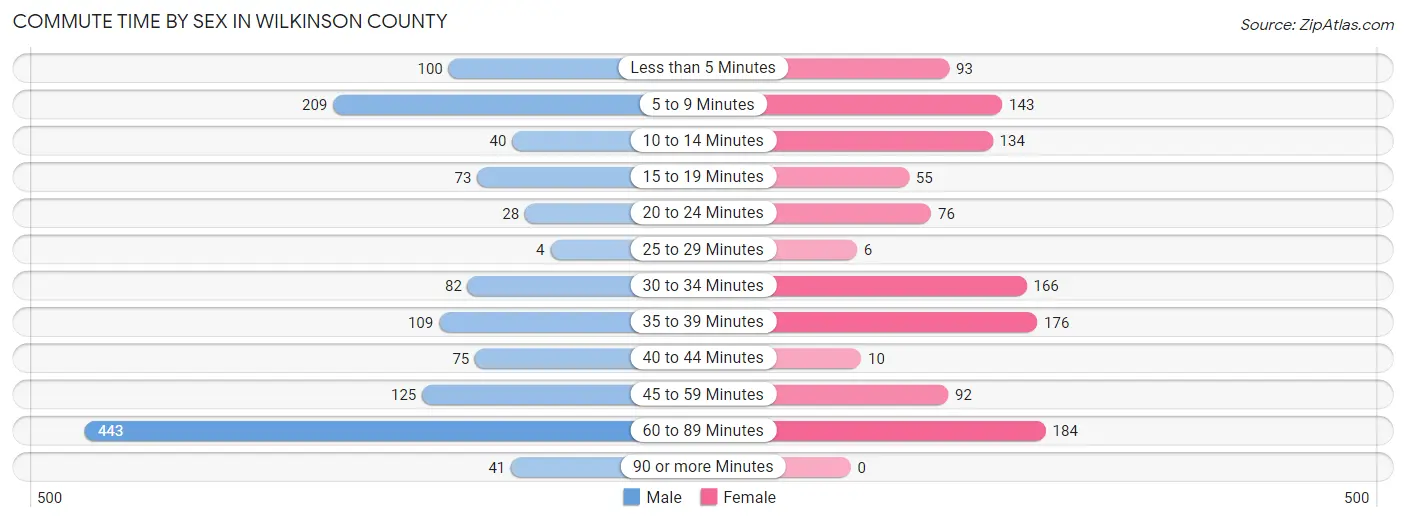
| Commute Time | Male | Female |
| Less than 5 Minutes | 100 (7.5%) | 93 (8.2%) |
| 5 to 9 Minutes | 209 (15.7%) | 143 (12.6%) |
| 10 to 14 Minutes | 40 (3.0%) | 134 (11.8%) |
| 15 to 19 Minutes | 73 (5.5%) | 55 (4.9%) |
| 20 to 24 Minutes | 28 (2.1%) | 76 (6.7%) |
| 25 to 29 Minutes | 4 (0.3%) | 6 (0.5%) |
| 30 to 34 Minutes | 82 (6.2%) | 166 (14.6%) |
| 35 to 39 Minutes | 109 (8.2%) | 176 (15.5%) |
| 40 to 44 Minutes | 75 (5.6%) | 10 (0.9%) |
| 45 to 59 Minutes | 125 (9.4%) | 92 (8.1%) |
| 60 to 89 Minutes | 443 (33.3%) | 184 (16.2%) |
| 90 or more Minutes | 41 (3.1%) | 0 (0.0%) |
Time of Departure to Work by Sex in Wilkinson County
The most frequent times of departure to work in Wilkinson County are 5:00 AM to 5:29 AM (368, 27.7%) for males and 6:00 AM to 6:29 AM (240, 21.1%) for females.
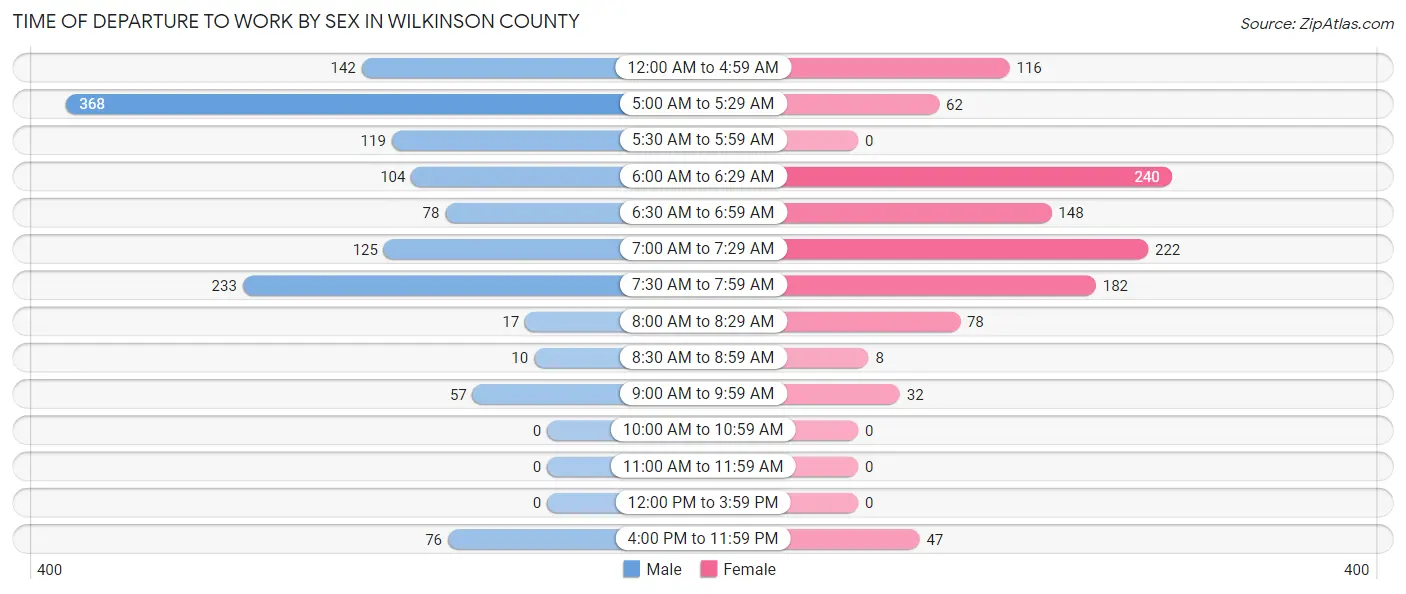
| Time of Departure | Male | Female |
| 12:00 AM to 4:59 AM | 142 (10.7%) | 116 (10.2%) |
| 5:00 AM to 5:29 AM | 368 (27.7%) | 62 (5.5%) |
| 5:30 AM to 5:59 AM | 119 (8.9%) | 0 (0.0%) |
| 6:00 AM to 6:29 AM | 104 (7.8%) | 240 (21.1%) |
| 6:30 AM to 6:59 AM | 78 (5.9%) | 148 (13.0%) |
| 7:00 AM to 7:29 AM | 125 (9.4%) | 222 (19.6%) |
| 7:30 AM to 7:59 AM | 233 (17.5%) | 182 (16.0%) |
| 8:00 AM to 8:29 AM | 17 (1.3%) | 78 (6.9%) |
| 8:30 AM to 8:59 AM | 10 (0.7%) | 8 (0.7%) |
| 9:00 AM to 9:59 AM | 57 (4.3%) | 32 (2.8%) |
| 10:00 AM to 10:59 AM | 0 (0.0%) | 0 (0.0%) |
| 11:00 AM to 11:59 AM | 0 (0.0%) | 0 (0.0%) |
| 12:00 PM to 3:59 PM | 0 (0.0%) | 0 (0.0%) |
| 4:00 PM to 11:59 PM | 76 (5.7%) | 47 (4.1%) |
| Total | 1,329 (100.0%) | 1,135 (100.0%) |
Housing Occupancy in Wilkinson County
Occupancy by Ownership in Wilkinson County
Of the total 3,264 dwellings in Wilkinson County, owner-occupied units account for 2,680 (82.1%), while renter-occupied units make up 584 (17.9%).
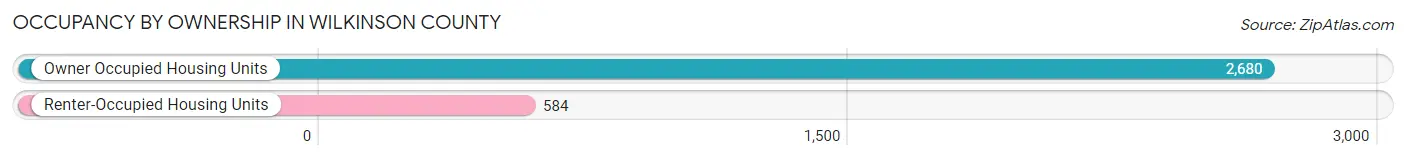
| Occupancy | # Housing Units | % Housing Units |
| Owner Occupied Housing Units | 2,680 | 82.1% |
| Renter-Occupied Housing Units | 584 | 17.9% |
| Total Occupied Housing Units | 3,264 | 100.0% |
Occupancy by Household Size in Wilkinson County
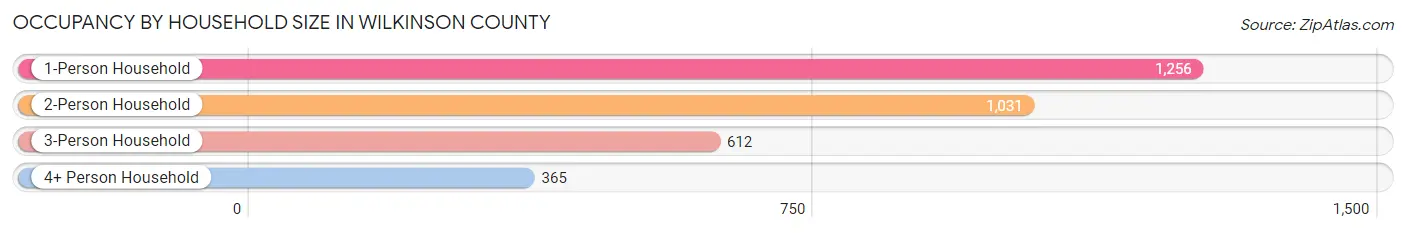
| Household Size | # Housing Units | % Housing Units |
| 1-Person Household | 1,256 | 38.5% |
| 2-Person Household | 1,031 | 31.6% |
| 3-Person Household | 612 | 18.8% |
| 4+ Person Household | 365 | 11.2% |
| Total Housing Units | 3,264 | 100.0% |
Occupancy by Ownership by Household Size in Wilkinson County
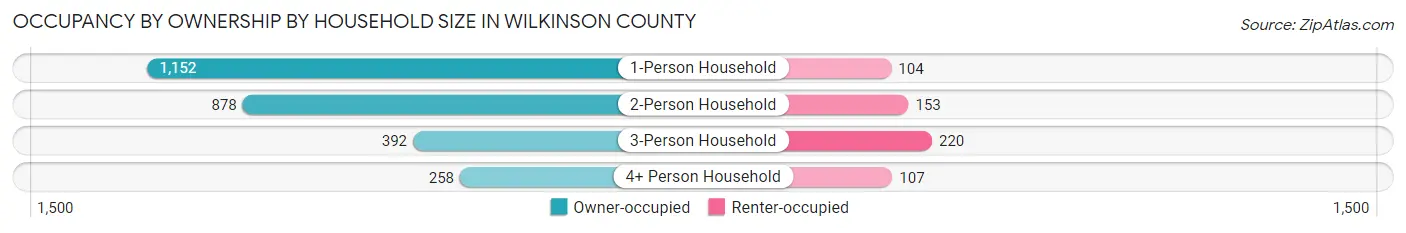
| Household Size | Owner-occupied | Renter-occupied |
| 1-Person Household | 1,152 (91.7%) | 104 (8.3%) |
| 2-Person Household | 878 (85.2%) | 153 (14.8%) |
| 3-Person Household | 392 (64.0%) | 220 (35.9%) |
| 4+ Person Household | 258 (70.7%) | 107 (29.3%) |
| Total Housing Units | 2,680 (82.1%) | 584 (17.9%) |
Occupancy by Educational Attainment in Wilkinson County
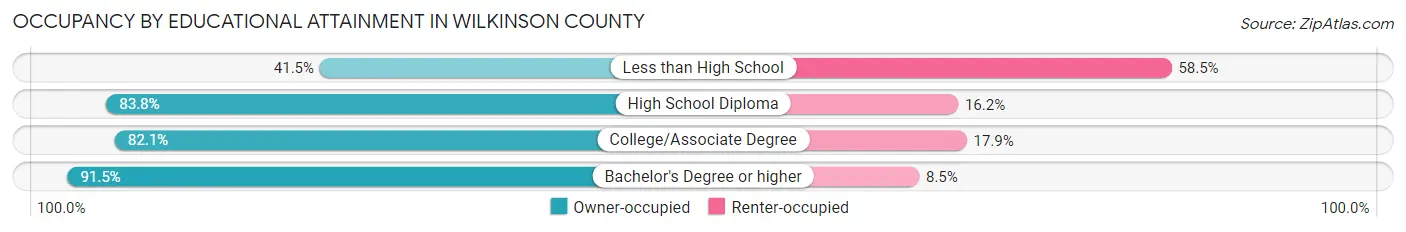
| Household Size | Owner-occupied | Renter-occupied |
| Less than High School | 68 (41.5%) | 96 (58.5%) |
| High School Diploma | 1,410 (83.8%) | 273 (16.2%) |
| College/Associate Degree | 825 (82.1%) | 180 (17.9%) |
| Bachelor's Degree or higher | 377 (91.5%) | 35 (8.5%) |
Occupancy by Age of Householder in Wilkinson County
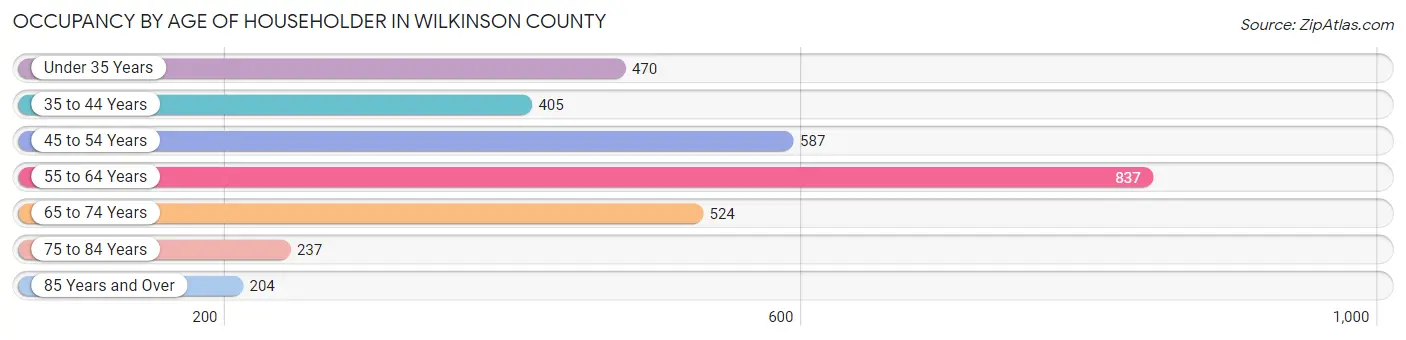
| Age Bracket | # Households | % Households |
| Under 35 Years | 470 | 14.4% |
| 35 to 44 Years | 405 | 12.4% |
| 45 to 54 Years | 587 | 18.0% |
| 55 to 64 Years | 837 | 25.6% |
| 65 to 74 Years | 524 | 16.1% |
| 75 to 84 Years | 237 | 7.3% |
| 85 Years and Over | 204 | 6.2% |
| Total | 3,264 | 100.0% |
Housing Finances in Wilkinson County
Median Income by Occupancy in Wilkinson County
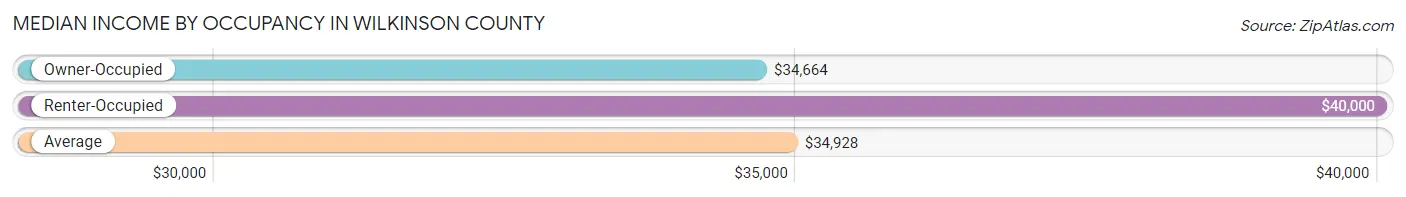
| Occupancy Type | # Households | Median Income |
| Owner-Occupied | 2,680 (82.1%) | $34,664 |
| Renter-Occupied | 584 (17.9%) | $40,000 |
| Average | 3,264 (100.0%) | $34,928 |
Occupancy by Householder Income Bracket in Wilkinson County
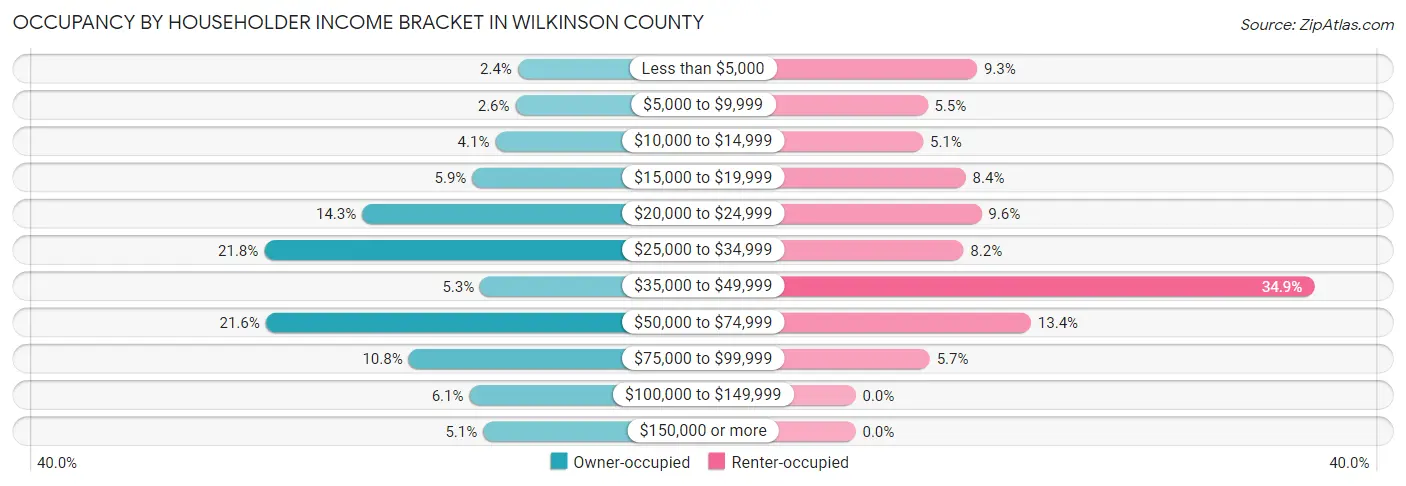
| Income Bracket | Owner-occupied | Renter-occupied |
| Less than $5,000 | 65 (2.4%) | 54 (9.2%) |
| $5,000 to $9,999 | 70 (2.6%) | 32 (5.5%) |
| $10,000 to $14,999 | 111 (4.1%) | 30 (5.1%) |
| $15,000 to $19,999 | 158 (5.9%) | 49 (8.4%) |
| $20,000 to $24,999 | 383 (14.3%) | 56 (9.6%) |
| $25,000 to $34,999 | 583 (21.7%) | 48 (8.2%) |
| $35,000 to $49,999 | 142 (5.3%) | 204 (34.9%) |
| $50,000 to $74,999 | 580 (21.6%) | 78 (13.4%) |
| $75,000 to $99,999 | 288 (10.7%) | 33 (5.7%) |
| $100,000 to $149,999 | 164 (6.1%) | 0 (0.0%) |
| $150,000 or more | 136 (5.1%) | 0 (0.0%) |
| Total | 2,680 (100.0%) | 584 (100.0%) |
Monthly Housing Cost Tiers in Wilkinson County
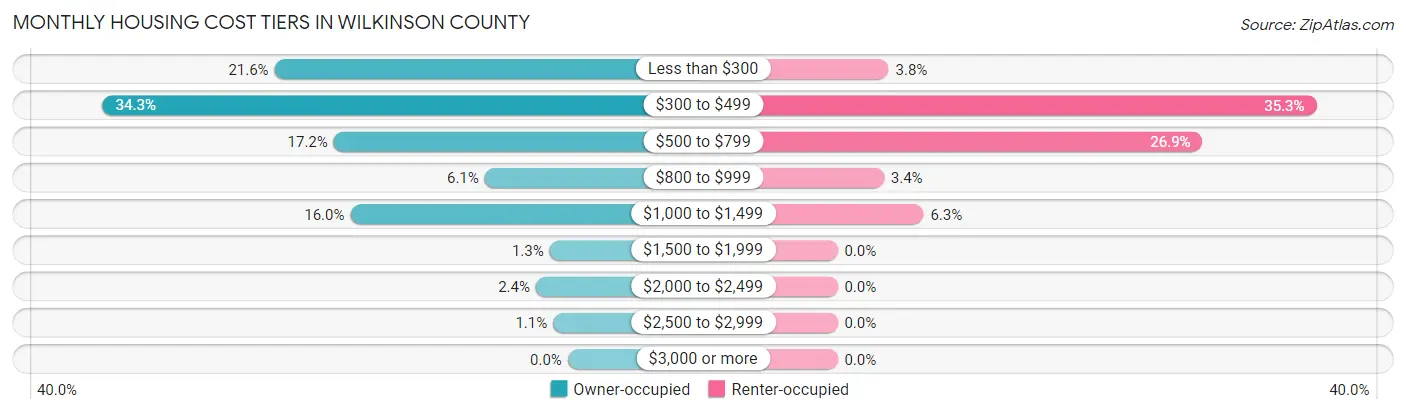
| Monthly Cost | Owner-occupied | Renter-occupied |
| Less than $300 | 579 (21.6%) | 22 (3.8%) |
| $300 to $499 | 918 (34.3%) | 206 (35.3%) |
| $500 to $799 | 462 (17.2%) | 157 (26.9%) |
| $800 to $999 | 164 (6.1%) | 20 (3.4%) |
| $1,000 to $1,499 | 429 (16.0%) | 37 (6.3%) |
| $1,500 to $1,999 | 36 (1.3%) | 0 (0.0%) |
| $2,000 to $2,499 | 63 (2.4%) | 0 (0.0%) |
| $2,500 to $2,999 | 29 (1.1%) | 0 (0.0%) |
| $3,000 or more | 0 (0.0%) | 0 (0.0%) |
| Total | 2,680 (100.0%) | 584 (100.0%) |
Physical Housing Characteristics in Wilkinson County
Housing Structures in Wilkinson County
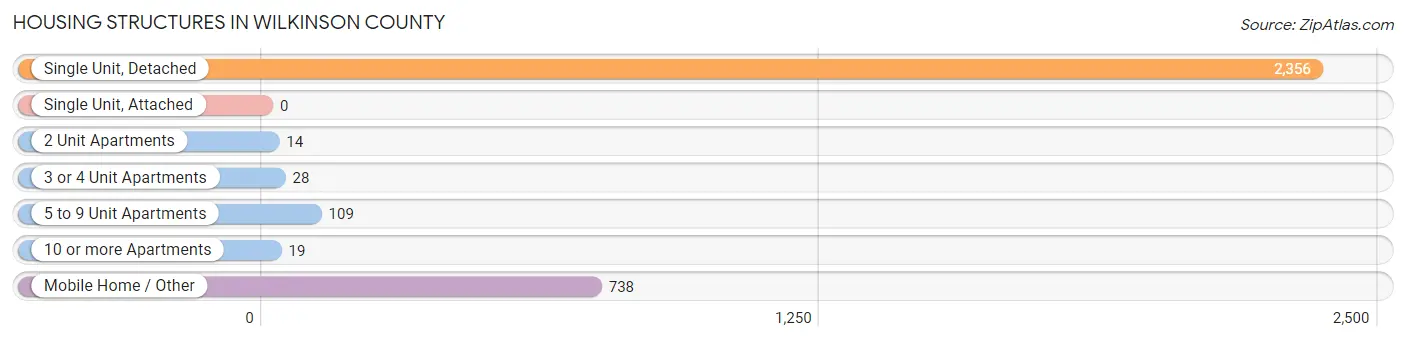
| Structure Type | # Housing Units | % Housing Units |
| Single Unit, Detached | 2,356 | 72.2% |
| Single Unit, Attached | 0 | 0.0% |
| 2 Unit Apartments | 14 | 0.4% |
| 3 or 4 Unit Apartments | 28 | 0.9% |
| 5 to 9 Unit Apartments | 109 | 3.3% |
| 10 or more Apartments | 19 | 0.6% |
| Mobile Home / Other | 738 | 22.6% |
| Total | 3,264 | 100.0% |
Housing Structures by Occupancy in Wilkinson County
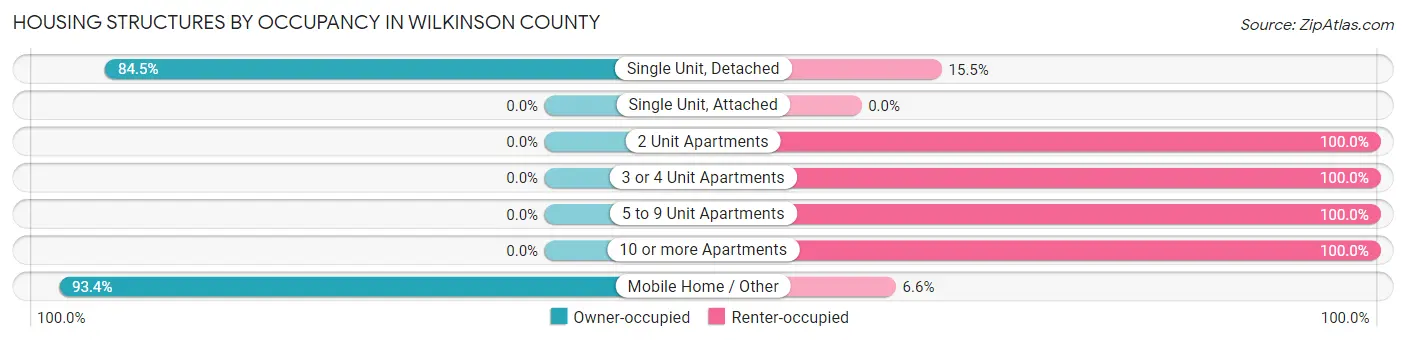
| Structure Type | Owner-occupied | Renter-occupied |
| Single Unit, Detached | 1,991 (84.5%) | 365 (15.5%) |
| Single Unit, Attached | 0 (0.0%) | 0 (0.0%) |
| 2 Unit Apartments | 0 (0.0%) | 14 (100.0%) |
| 3 or 4 Unit Apartments | 0 (0.0%) | 28 (100.0%) |
| 5 to 9 Unit Apartments | 0 (0.0%) | 109 (100.0%) |
| 10 or more Apartments | 0 (0.0%) | 19 (100.0%) |
| Mobile Home / Other | 689 (93.4%) | 49 (6.6%) |
| Total | 2,680 (82.1%) | 584 (17.9%) |
Housing Structures by Number of Rooms in Wilkinson County
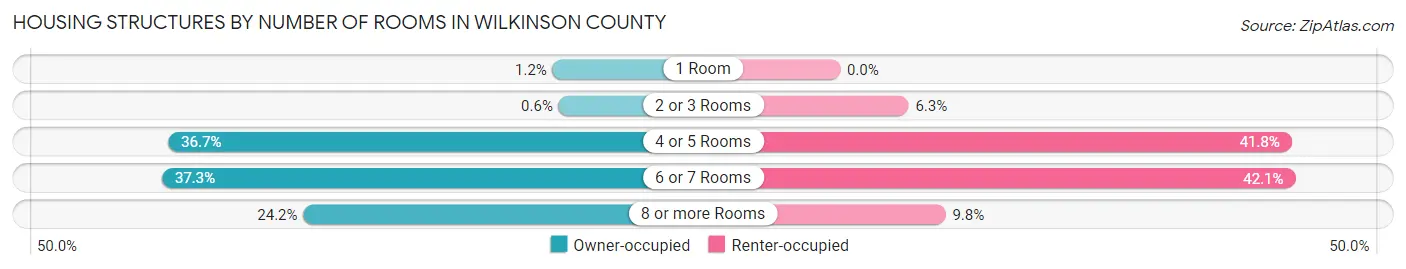
| Number of Rooms | Owner-occupied | Renter-occupied |
| 1 Room | 31 (1.2%) | 0 (0.0%) |
| 2 or 3 Rooms | 16 (0.6%) | 37 (6.3%) |
| 4 or 5 Rooms | 984 (36.7%) | 244 (41.8%) |
| 6 or 7 Rooms | 1,000 (37.3%) | 246 (42.1%) |
| 8 or more Rooms | 649 (24.2%) | 57 (9.8%) |
| Total | 2,680 (100.0%) | 584 (100.0%) |
Housing Structure by Heating Type in Wilkinson County
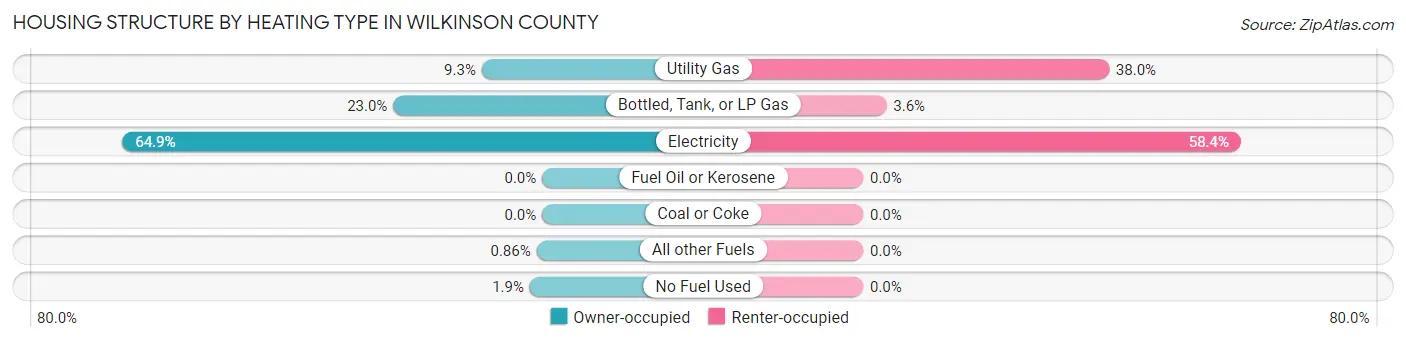
| Heating Type | Owner-occupied | Renter-occupied |
| Utility Gas | 250 (9.3%) | 222 (38.0%) |
| Bottled, Tank, or LP Gas | 617 (23.0%) | 21 (3.6%) |
| Electricity | 1,739 (64.9%) | 341 (58.4%) |
| Fuel Oil or Kerosene | 0 (0.0%) | 0 (0.0%) |
| Coal or Coke | 0 (0.0%) | 0 (0.0%) |
| All other Fuels | 23 (0.9%) | 0 (0.0%) |
| No Fuel Used | 51 (1.9%) | 0 (0.0%) |
| Total | 2,680 (100.0%) | 584 (100.0%) |
Household Vehicle Usage in Wilkinson County
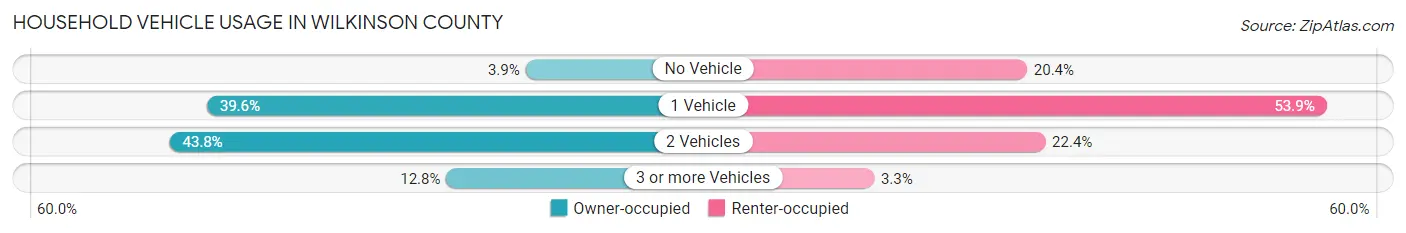
| Vehicles per Household | Owner-occupied | Renter-occupied |
| No Vehicle | 104 (3.9%) | 119 (20.4%) |
| 1 Vehicle | 1,061 (39.6%) | 315 (53.9%) |
| 2 Vehicles | 1,173 (43.8%) | 131 (22.4%) |
| 3 or more Vehicles | 342 (12.8%) | 19 (3.3%) |
| Total | 2,680 (100.0%) | 584 (100.0%) |
Real Estate & Mortgages in Wilkinson County
Real Estate and Mortgage Overview in Wilkinson County
| Characteristic | Without Mortgage | With Mortgage |
| Housing Units | 1,828 | 852 |
| Median Property Value | $73,700 | $107,600 |
| Median Household Income | $29,407 | $73 |
| Monthly Housing Costs | $374 | $0 |
| Real Estate Taxes | $494 | $159 |
Property Value by Mortgage Status in Wilkinson County
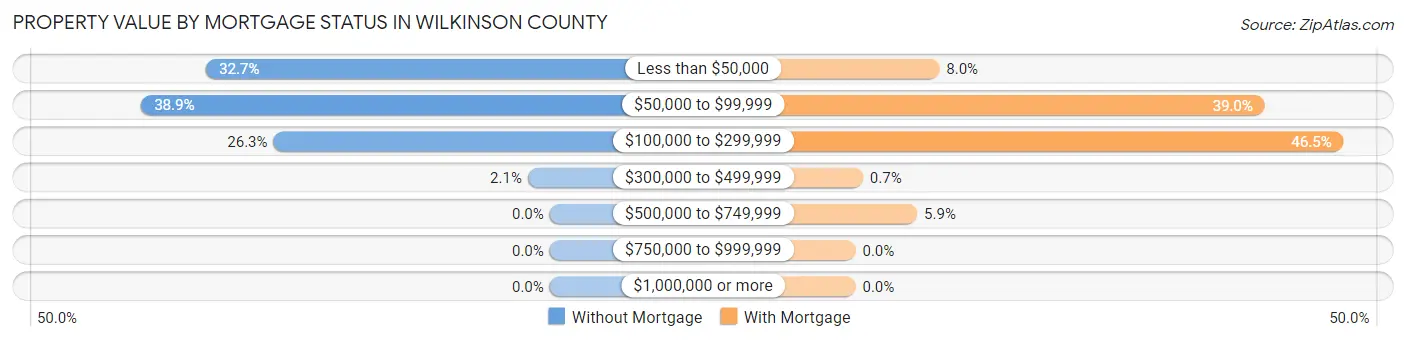
| Property Value | Without Mortgage | With Mortgage |
| Less than $50,000 | 598 (32.7%) | 68 (8.0%) |
| $50,000 to $99,999 | 711 (38.9%) | 332 (39.0%) |
| $100,000 to $299,999 | 481 (26.3%) | 396 (46.5%) |
| $300,000 to $499,999 | 38 (2.1%) | 6 (0.7%) |
| $500,000 to $749,999 | 0 (0.0%) | 50 (5.9%) |
| $750,000 to $999,999 | 0 (0.0%) | 0 (0.0%) |
| $1,000,000 or more | 0 (0.0%) | 0 (0.0%) |
| Total | 1,828 (100.0%) | 852 (100.0%) |
Household Income by Mortgage Status in Wilkinson County
| Household Income | Without Mortgage | With Mortgage |
| Less than $10,000 | 125 (6.8%) | 0 (0.0%) |
| $10,000 to $24,999 | 509 (27.8%) | 10 (1.2%) |
| $25,000 to $34,999 | 479 (26.2%) | 143 (16.8%) |
| $35,000 to $49,999 | 110 (6.0%) | 104 (12.2%) |
| $50,000 to $74,999 | 349 (19.1%) | 32 (3.8%) |
| $75,000 to $99,999 | 129 (7.1%) | 231 (27.1%) |
| $100,000 to $149,999 | 64 (3.5%) | 159 (18.7%) |
| $150,000 or more | 63 (3.5%) | 100 (11.7%) |
| Total | 1,828 (100.0%) | 852 (100.0%) |
Property Value to Household Income Ratio in Wilkinson County
| Value-to-Income Ratio | Without Mortgage | With Mortgage |
| Less than 2.0x | 842 (46.1%) | 54,682 (6,418.1%) |
| 2.0x to 2.9x | 270 (14.8%) | 437 (51.3%) |
| 3.0x to 3.9x | 359 (19.6%) | 226 (26.5%) |
| 4.0x or more | 348 (19.0%) | 124 (14.5%) |
| Total | 1,828 (100.0%) | 852 (100.0%) |
Real Estate Taxes by Mortgage Status in Wilkinson County
| Property Taxes | Without Mortgage | With Mortgage |
| Less than $800 | 789 (43.2%) | 10 (1.2%) |
| $800 to $1,499 | 176 (9.6%) | 356 (41.8%) |
| $800 to $1,499 | 147 (8.0%) | 205 (24.1%) |
| Total | 1,828 (100.0%) | 852 (100.0%) |
Health & Disability in Wilkinson County
Health Insurance Coverage by Age in Wilkinson County
| Age Bracket | With Coverage | Without Coverage |
| Under 6 Years | 482 (100.0%) | 0 (0.0%) |
| 6 to 18 Years | 1,359 (98.6%) | 20 (1.5%) |
| 19 to 25 Years | 287 (68.8%) | 130 (31.2%) |
| 26 to 34 Years | 528 (69.3%) | 234 (30.7%) |
| 35 to 44 Years | 717 (81.5%) | 163 (18.5%) |
| 45 to 54 Years | 907 (96.9%) | 29 (3.1%) |
| 55 to 64 Years | 992 (86.4%) | 156 (13.6%) |
| 65 to 74 Years | 923 (99.9%) | 1 (0.1%) |
| 75 Years and older | 514 (100.0%) | 0 (0.0%) |
| Total | 6,709 (90.1%) | 733 (9.9%) |
Health Insurance Coverage by Citizenship Status in Wilkinson County
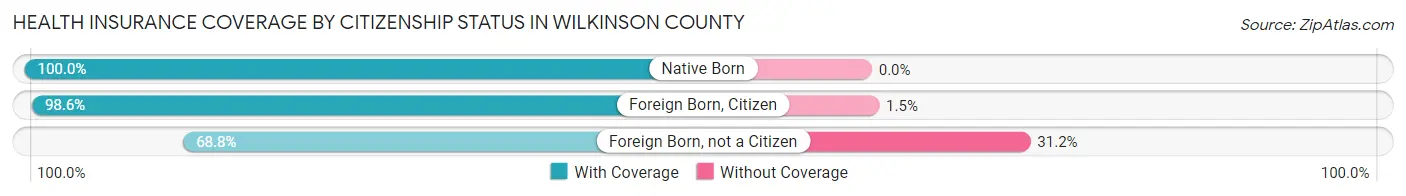
| Citizenship Status | With Coverage | Without Coverage |
| Native Born | 482 (100.0%) | 0 (0.0%) |
| Foreign Born, Citizen | 1,359 (98.6%) | 20 (1.5%) |
| Foreign Born, not a Citizen | 287 (68.8%) | 130 (31.2%) |
Health Insurance Coverage by Household Income in Wilkinson County
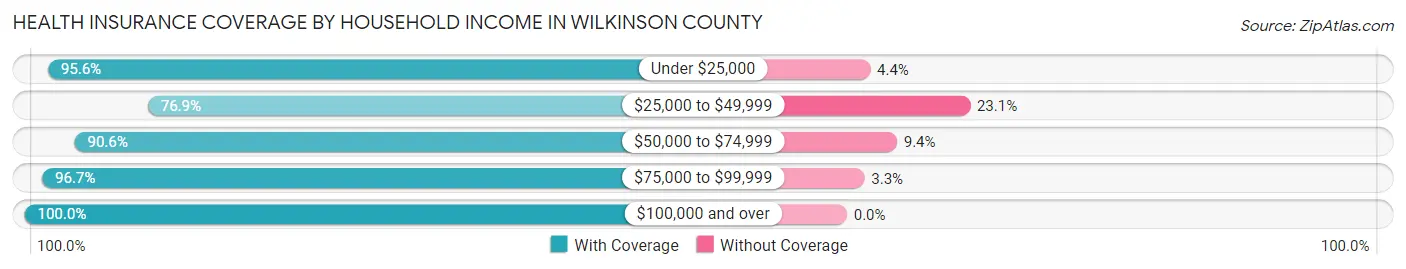
| Household Income | With Coverage | Without Coverage |
| Under $25,000 | 1,991 (95.6%) | 91 (4.4%) |
| $25,000 to $49,999 | 1,610 (76.9%) | 483 (23.1%) |
| $50,000 to $74,999 | 1,229 (90.6%) | 127 (9.4%) |
| $75,000 to $99,999 | 941 (96.7%) | 32 (3.3%) |
| $100,000 and over | 938 (100.0%) | 0 (0.0%) |
Public vs Private Health Insurance Coverage by Age in Wilkinson County
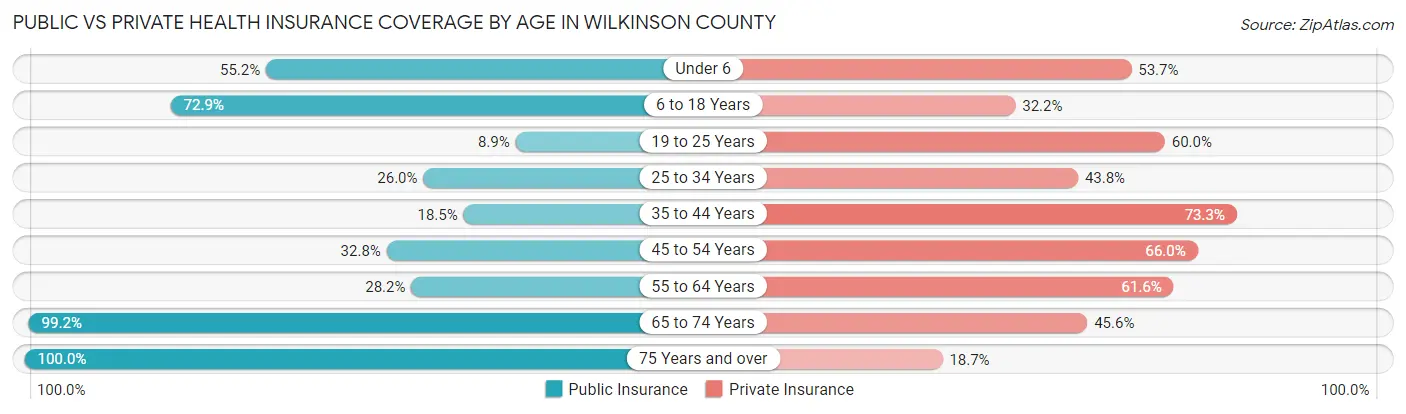
| Age Bracket | Public Insurance | Private Insurance |
| Under 6 | 266 (55.2%) | 259 (53.7%) |
| 6 to 18 Years | 1,005 (72.9%) | 444 (32.2%) |
| 19 to 25 Years | 37 (8.9%) | 250 (60.0%) |
| 25 to 34 Years | 198 (26.0%) | 334 (43.8%) |
| 35 to 44 Years | 163 (18.5%) | 645 (73.3%) |
| 45 to 54 Years | 307 (32.8%) | 618 (66.0%) |
| 55 to 64 Years | 324 (28.2%) | 707 (61.6%) |
| 65 to 74 Years | 917 (99.2%) | 421 (45.6%) |
| 75 Years and over | 514 (100.0%) | 96 (18.7%) |
| Total | 3,731 (50.1%) | 3,774 (50.7%) |
Disability Status by Sex by Age in Wilkinson County
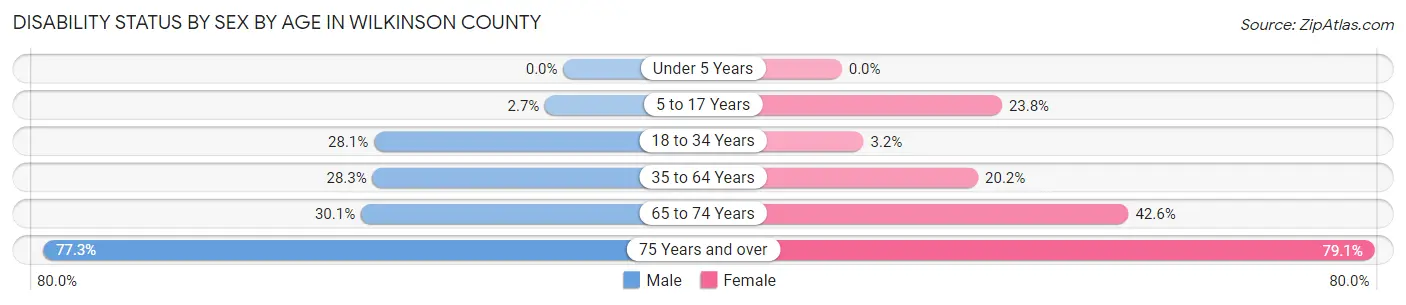
| Age Bracket | Male | Female |
| Under 5 Years | 0 (0.0%) | 0 (0.0%) |
| 5 to 17 Years | 20 (2.7%) | 146 (23.8%) |
| 18 to 34 Years | 154 (28.1%) | 23 (3.2%) |
| 35 to 64 Years | 417 (28.3%) | 302 (20.2%) |
| 65 to 74 Years | 128 (30.0%) | 212 (42.6%) |
| 75 Years and over | 153 (77.3%) | 250 (79.1%) |
Disability Class by Sex by Age in Wilkinson County
Disability Class: Hearing Difficulty
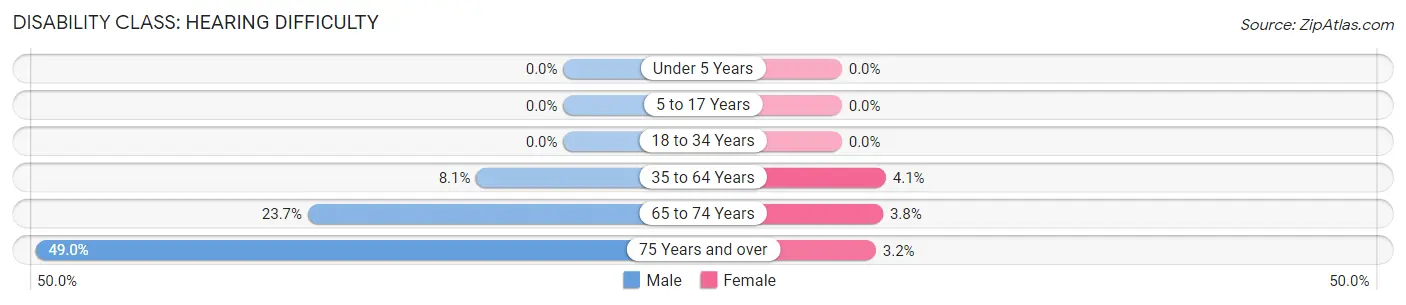
| Age Bracket | Male | Female |
| Under 5 Years | 0 (0.0%) | 0 (0.0%) |
| 5 to 17 Years | 0 (0.0%) | 0 (0.0%) |
| 18 to 34 Years | 0 (0.0%) | 0 (0.0%) |
| 35 to 64 Years | 119 (8.1%) | 61 (4.1%) |
| 65 to 74 Years | 101 (23.7%) | 19 (3.8%) |
| 75 Years and over | 97 (49.0%) | 10 (3.2%) |
Disability Class: Vision Difficulty
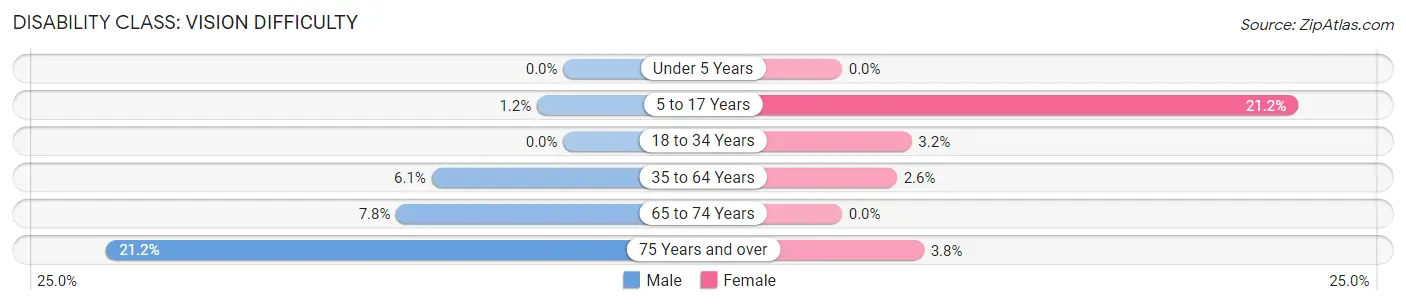
| Age Bracket | Male | Female |
| Under 5 Years | 0 (0.0%) | 0 (0.0%) |
| 5 to 17 Years | 9 (1.2%) | 130 (21.2%) |
| 18 to 34 Years | 0 (0.0%) | 23 (3.2%) |
| 35 to 64 Years | 90 (6.1%) | 38 (2.5%) |
| 65 to 74 Years | 33 (7.7%) | 0 (0.0%) |
| 75 Years and over | 42 (21.2%) | 12 (3.8%) |
Disability Class: Cognitive Difficulty
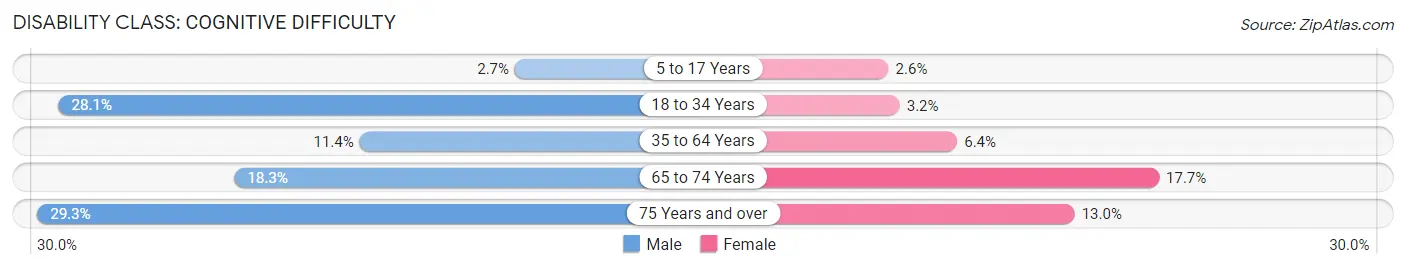
| Age Bracket | Male | Female |
| 5 to 17 Years | 20 (2.7%) | 16 (2.6%) |
| 18 to 34 Years | 154 (28.1%) | 23 (3.2%) |
| 35 to 64 Years | 167 (11.4%) | 96 (6.4%) |
| 65 to 74 Years | 78 (18.3%) | 88 (17.7%) |
| 75 Years and over | 58 (29.3%) | 41 (13.0%) |
Disability Class: Ambulatory Difficulty
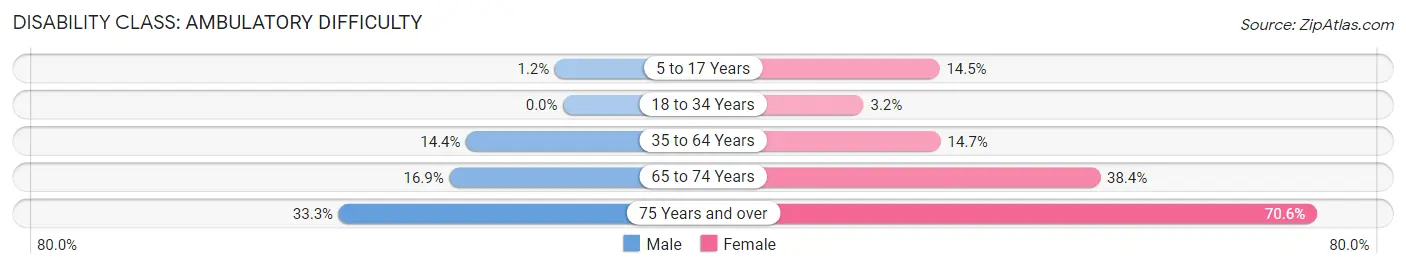
| Age Bracket | Male | Female |
| 5 to 17 Years | 9 (1.2%) | 89 (14.5%) |
| 18 to 34 Years | 0 (0.0%) | 23 (3.2%) |
| 35 to 64 Years | 212 (14.4%) | 219 (14.7%) |
| 65 to 74 Years | 72 (16.9%) | 191 (38.4%) |
| 75 Years and over | 66 (33.3%) | 223 (70.6%) |
Disability Class: Self-Care Difficulty
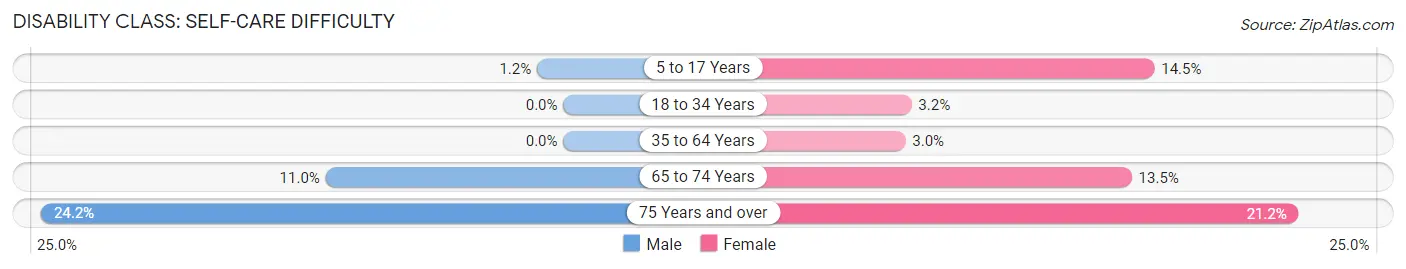
| Age Bracket | Male | Female |
| 5 to 17 Years | 9 (1.2%) | 89 (14.5%) |
| 18 to 34 Years | 0 (0.0%) | 23 (3.2%) |
| 35 to 64 Years | 0 (0.0%) | 44 (2.9%) |
| 65 to 74 Years | 47 (11.0%) | 67 (13.5%) |
| 75 Years and over | 48 (24.2%) | 67 (21.2%) |
Technology Access in Wilkinson County
Computing Device Access in Wilkinson County
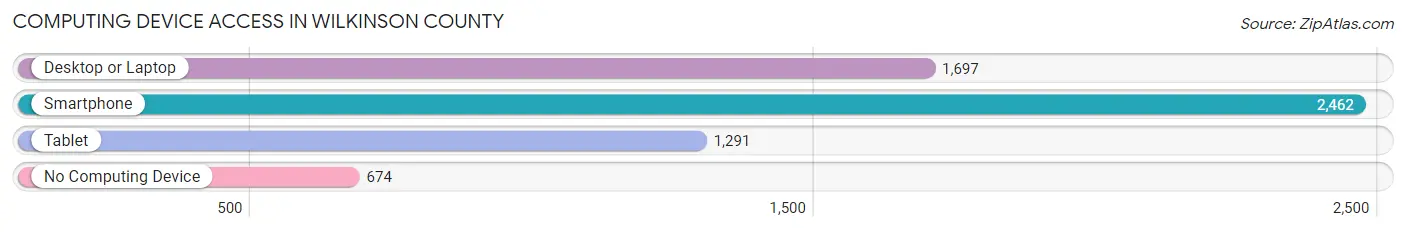
| Device Type | # Households | % Households |
| Desktop or Laptop | 1,697 | 52.0% |
| Smartphone | 2,462 | 75.4% |
| Tablet | 1,291 | 39.6% |
| No Computing Device | 674 | 20.6% |
| Total | 3,264 | 100.0% |
Internet Access in Wilkinson County
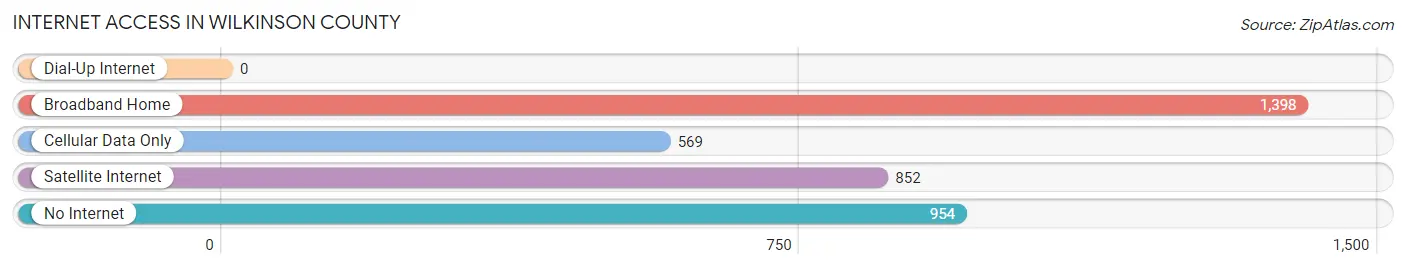
| Internet Type | # Households | % Households |
| Dial-Up Internet | 0 | 0.0% |
| Broadband Home | 1,398 | 42.8% |
| Cellular Data Only | 569 | 17.4% |
| Satellite Internet | 852 | 26.1% |
| No Internet | 954 | 29.2% |
| Total | 3,264 | 100.0% |
Wilkinson County Summary
Wilkinson County, Mississippi is located in the southwestern part of the state, and is bordered by Amite, Franklin, Adams, and Amite counties. The county seat is Woodville, and the county has a total area of 545 square miles. As of the 2010 census, the population was 9,878, making it the second least populous county in the state.
History
Wilkinson County was established in 1802, and was named for James Wilkinson, a Revolutionary War general and the first Governor of the Louisiana Territory. The county was originally part of the Natchez District, and was later divided into two counties, Wilkinson and Amite. The county was divided again in 1809, when Amite County was created.
The county was home to several Native American tribes, including the Choctaw, Chickasaw, and Natchez. The first European settlers arrived in the area in the late 1700s, and the county was officially established in 1802.
The county was home to several plantations, and the economy was largely based on agriculture. Cotton was the main crop, and the county was home to several large plantations. The county was also home to several small towns, including Woodville, which was established in 1810 and is now the county seat.
Geography
Wilkinson County is located in the southwestern part of the state, and is bordered by Amite, Franklin, Adams, and Amite counties. The county has a total area of 545 square miles, and is mostly rural. The terrain is mostly flat, with some rolling hills in the northern part of the county. The county is drained by the Pearl River, which flows through the county from north to south.
The county is home to several state parks, including Percy Quin State Park, which is located in the northern part of the county. The park is home to several lakes, and offers camping, fishing, and other recreational activities.
Economy
The economy of Wilkinson County is largely based on agriculture. The county is home to several large farms, and the main crops are cotton, corn, soybeans, and wheat. The county is also home to several small businesses, including restaurants, retail stores, and service providers.
The county is home to several manufacturing companies, including a paper mill and a furniture factory. The county is also home to several timber companies, and the timber industry is a major contributor to the local economy.
Demographics
As of the 2010 census, the population of Wilkinson County was 9,878. The population is mostly white, with African Americans making up the largest minority group. The median household income is $35,945, and the median age is 41.
The county is home to several small towns, including Woodville, which is the county seat. The town has a population of 1,845, and is home to several restaurants, retail stores, and service providers. The town is also home to several churches, and is the site of the annual Woodville Watermelon Festival.
Common Questions
What is Per Capita Income in Wilkinson County?
Per Capita income in Wilkinson County is $22,479.
What is the Median Family Income in Wilkinson County?
Median Family Income in Wilkinson County is $46,290.
What is the Median Household income in Wilkinson County?
Median Household Income in Wilkinson County is $34,928.
What is Income or Wage Gap in Wilkinson County?
Income or Wage Gap in Wilkinson County is 35.7%.
Women in Wilkinson County earn 64.3 cents for every dollar earned by a man.
What is Inequality or Gini Index in Wilkinson County?
Inequality or Gini Index in Wilkinson County is 0.49.
What is the Total Population of Wilkinson County?
Total Population of Wilkinson County is 8,531.
What is the Total Male Population of Wilkinson County?
Total Male Population of Wilkinson County is 4,588.
What is the Total Female Population of Wilkinson County?
Total Female Population of Wilkinson County is 3,943.
What is the Ratio of Males per 100 Females in Wilkinson County?
There are 116.36 Males per 100 Females in Wilkinson County.
What is the Ratio of Females per 100 Males in Wilkinson County?
There are 85.94 Females per 100 Males in Wilkinson County.
What is the Median Population Age in Wilkinson County?
Median Population Age in Wilkinson County is 38.9 Years.
What is the Average Family Size in Wilkinson County
Average Family Size in Wilkinson County is 3.1 People.
What is the Average Household Size in Wilkinson County
Average Household Size in Wilkinson County is 2.3 People.
How Large is the Labor Force in Wilkinson County?
There are 2,984 People in the Labor Forcein in Wilkinson County.
What is the Percentage of People in the Labor Force in Wilkinson County?
42.9% of People are in the Labor Force in Wilkinson County.
What is the Unemployment Rate in Wilkinson County?
Unemployment Rate in Wilkinson County is 6.3%.