Perry County, MS Map & Demographics
Perry County Map
Perry County Overview
$24,935
PER CAPITA INCOME
$49,703
AVG FAMILY INCOME
$48,333
AVG HOUSEHOLD INCOME
46.3%
WAGE / INCOME GAP [ % ]
53.7¢/ $1
WAGE / INCOME GAP [ $ ]
$7,138
FAMILY INCOME DEFICIT
0.41
INEQUALITY / GINI INDEX
11,511
TOTAL POPULATION
5,766
MALE POPULATION
5,745
FEMALE POPULATION
100.37
MALES / 100 FEMALES
99.64
FEMALES / 100 MALES
42.3
MEDIAN AGE
3.2
AVG FAMILY SIZE
2.5
AVG HOUSEHOLD SIZE
4,524
LABOR FORCE [ PEOPLE ]
48.5%
PERCENT IN LABOR FORCE
6.3%
UNEMPLOYMENT RATE
Income in Perry County
Income Overview in Perry County
Per Capita Income in Perry County is $24,935, while median incomes of families and households are $49,703 and $48,333 respectively.
| Characteristic | Number | Measure |
| Per Capita Income | 11,511 | $24,935 |
| Median Family Income | 2,832 | $49,703 |
| Mean Family Income | 2,832 | $67,549 |
| Median Household Income | 4,462 | $48,333 |
| Mean Household Income | 4,462 | $61,035 |
| Income Deficit | 2,832 | $7,138 |
| Wage / Income Gap (%) | 11,511 | 46.33% |
| Wage / Income Gap ($) | 11,511 | 53.67¢ per $1 |
| Gini / Inequality Index | 11,511 | 0.41 |
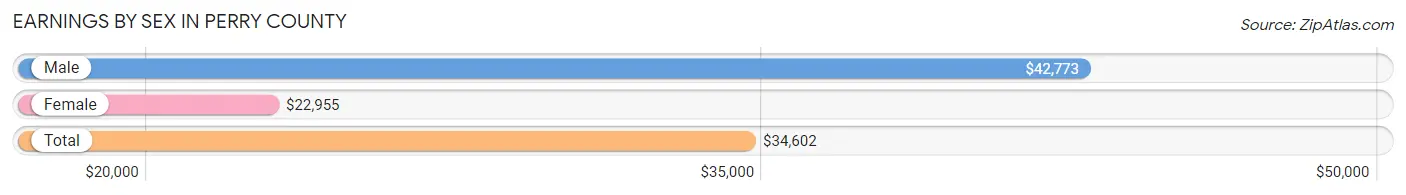
Earnings by Sex in Perry County
Average Earnings in Perry County are $34,602, $42,773 for men and $22,955 for women, a difference of 46.3%.
| Sex | Number | Average Earnings |
| Male | 2,838 (60.7%) | $42,773 |
| Female | 1,840 (39.3%) | $22,955 |
| Total | 4,678 (100.0%) | $34,602 |
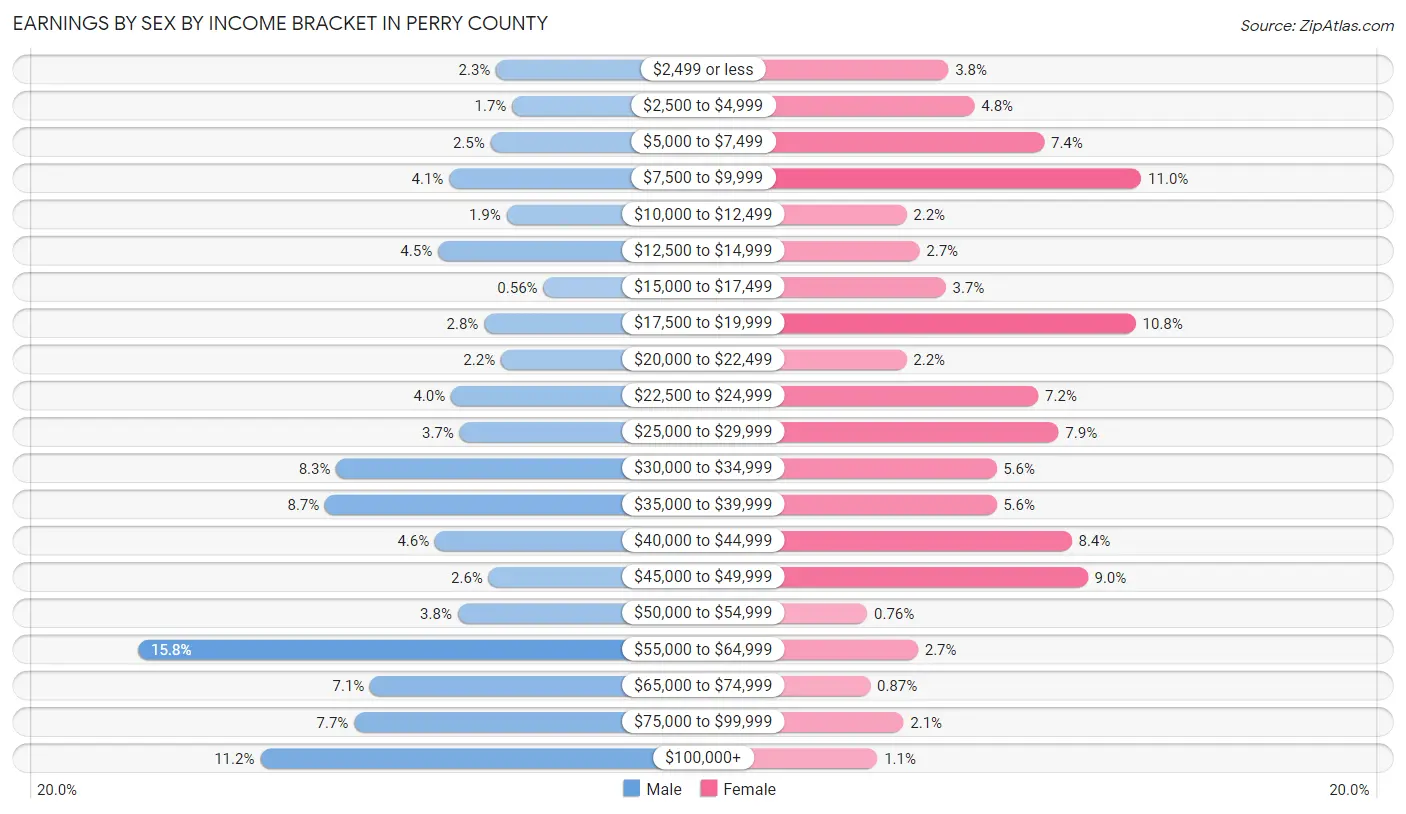
Earnings by Sex by Income Bracket in Perry County
The most common earnings brackets in Perry County are $55,000 to $64,999 for men (447 | 15.8%) and $7,500 to $9,999 for women (203 | 11.0%).
| Income | Male | Female |
| $2,499 or less | 66 (2.3%) | 70 (3.8%) |
| $2,500 to $4,999 | 49 (1.7%) | 88 (4.8%) |
| $5,000 to $7,499 | 72 (2.5%) | 136 (7.4%) |
| $7,500 to $9,999 | 116 (4.1%) | 203 (11.0%) |
| $10,000 to $12,499 | 55 (1.9%) | 41 (2.2%) |
| $12,500 to $14,999 | 128 (4.5%) | 50 (2.7%) |
| $15,000 to $17,499 | 16 (0.6%) | 68 (3.7%) |
| $17,500 to $19,999 | 79 (2.8%) | 199 (10.8%) |
| $20,000 to $22,499 | 61 (2.1%) | 41 (2.2%) |
| $22,500 to $24,999 | 114 (4.0%) | 132 (7.2%) |
| $25,000 to $29,999 | 105 (3.7%) | 146 (7.9%) |
| $30,000 to $34,999 | 236 (8.3%) | 103 (5.6%) |
| $35,000 to $39,999 | 248 (8.7%) | 103 (5.6%) |
| $40,000 to $44,999 | 131 (4.6%) | 155 (8.4%) |
| $45,000 to $49,999 | 74 (2.6%) | 166 (9.0%) |
| $50,000 to $54,999 | 107 (3.8%) | 14 (0.8%) |
| $55,000 to $64,999 | 447 (15.8%) | 49 (2.7%) |
| $65,000 to $74,999 | 200 (7.0%) | 16 (0.9%) |
| $75,000 to $99,999 | 217 (7.6%) | 39 (2.1%) |
| $100,000+ | 317 (11.2%) | 21 (1.1%) |
| Total | 2,838 (100.0%) | 1,840 (100.0%) |
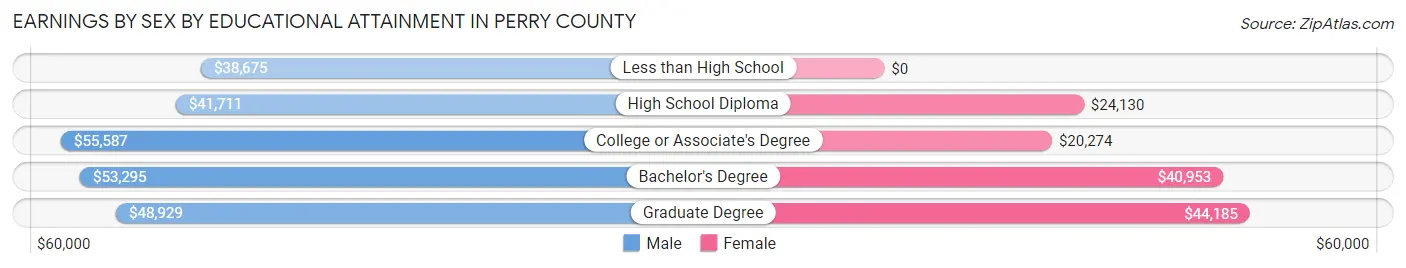
Earnings by Sex by Educational Attainment in Perry County
Average earnings in Perry County are $47,368 for men and $27,804 for women, a difference of 41.3%. Men with an educational attainment of college or associate's degree enjoy the highest average annual earnings of $55,587, while those with less than high school education earn the least with $38,675. Women with an educational attainment of graduate degree earn the most with the average annual earnings of $44,185, while those with college or associate's degree education have the smallest earnings of $20,274.
| Educational Attainment | Male Income | Female Income |
| Less than High School | $38,675 | $0 |
| High School Diploma | $41,711 | $24,130 |
| College or Associate's Degree | $55,587 | $20,274 |
| Bachelor's Degree | $53,295 | $40,953 |
| Graduate Degree | $48,929 | $44,185 |
| Total | $47,368 | $27,804 |
Family Income in Perry County
Family Income Brackets in Perry County
According to the Perry County family income data, there are 527 families falling into the $50,000 to $74,999 income range, which is the most common income bracket and makes up 18.6% of all families. Conversely, the $200,000+ income bracket is the least frequent group with only 48 families (1.7%) belonging to this category.
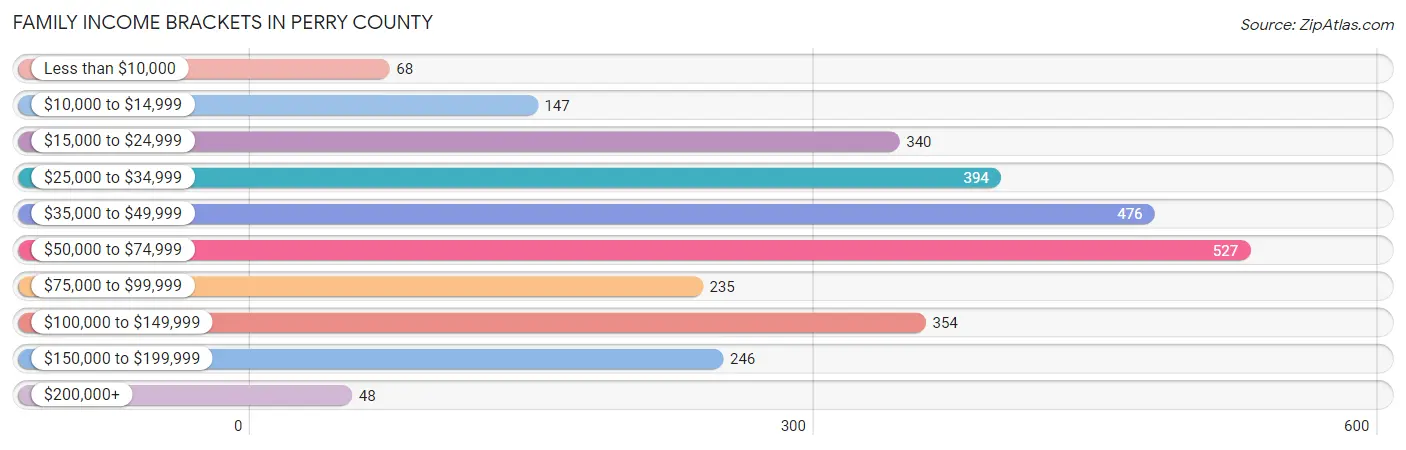
| Income Bracket | # Families | % Families |
| Less than $10,000 | 68 | 2.4% |
| $10,000 to $14,999 | 147 | 5.2% |
| $15,000 to $24,999 | 340 | 12.0% |
| $25,000 to $34,999 | 394 | 13.9% |
| $35,000 to $49,999 | 476 | 16.8% |
| $50,000 to $74,999 | 527 | 18.6% |
| $75,000 to $99,999 | 235 | 8.3% |
| $100,000 to $149,999 | 354 | 12.5% |
| $150,000 to $199,999 | 246 | 8.7% |
| $200,000+ | 48 | 1.7% |
Family Income by Famaliy Size in Perry County
6-person families (112 | 4.0%) account for the highest median family income in Perry County with $111,429 per family, while 2-person families (1,569 | 55.4%) have the highest median income of $26,676 per family member.
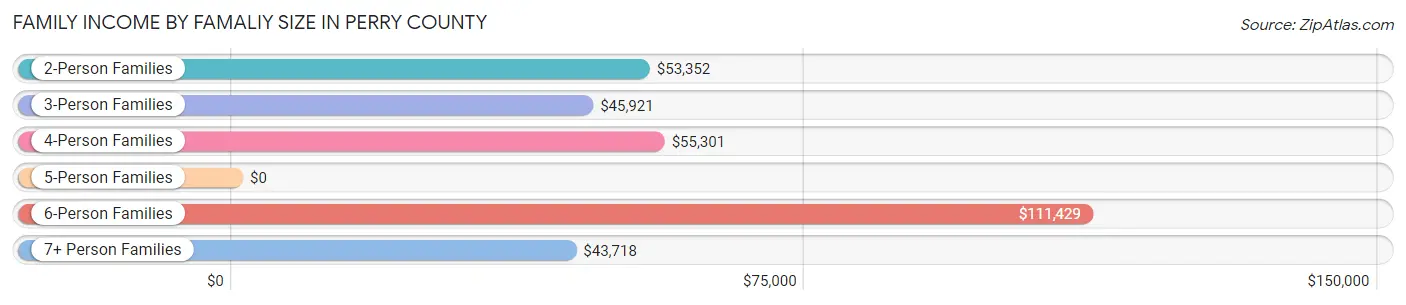
| Income Bracket | # Families | Median Income |
| 2-Person Families | 1,569 (55.4%) | $53,352 |
| 3-Person Families | 742 (26.2%) | $45,921 |
| 4-Person Families | 238 (8.4%) | $55,301 |
| 5-Person Families | 59 (2.1%) | $0 |
| 6-Person Families | 112 (4.0%) | $111,429 |
| 7+ Person Families | 112 (4.0%) | $43,718 |
| Total | 2,832 (100.0%) | $49,703 |
Family Income by Number of Earners in Perry County
The median family income in Perry County is $49,703, with families comprising 3+ earners (133) having the highest median family income of $117,708, while families with no earners (896) have the lowest median family income of $35,943, accounting for 4.7% and 31.6% of families, respectively.
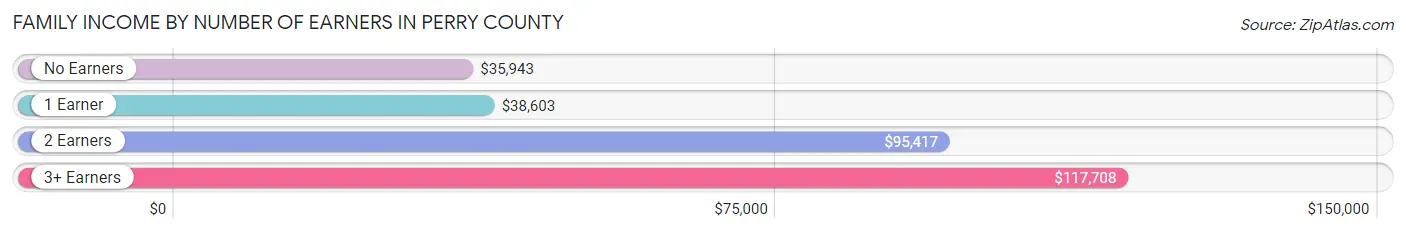
| Number of Earners | # Families | Median Income |
| No Earners | 896 (31.6%) | $35,943 |
| 1 Earner | 1,051 (37.1%) | $38,603 |
| 2 Earners | 752 (26.6%) | $95,417 |
| 3+ Earners | 133 (4.7%) | $117,708 |
| Total | 2,832 (100.0%) | $49,703 |
Household Income in Perry County
Household Income Brackets in Perry County
With 790 households falling in the category, the $50,000 to $74,999 income range is the most frequent in Perry County, accounting for 17.7% of all households. In contrast, only 49 households (1.1%) fall into the $200,000+ income bracket, making it the least populous group.
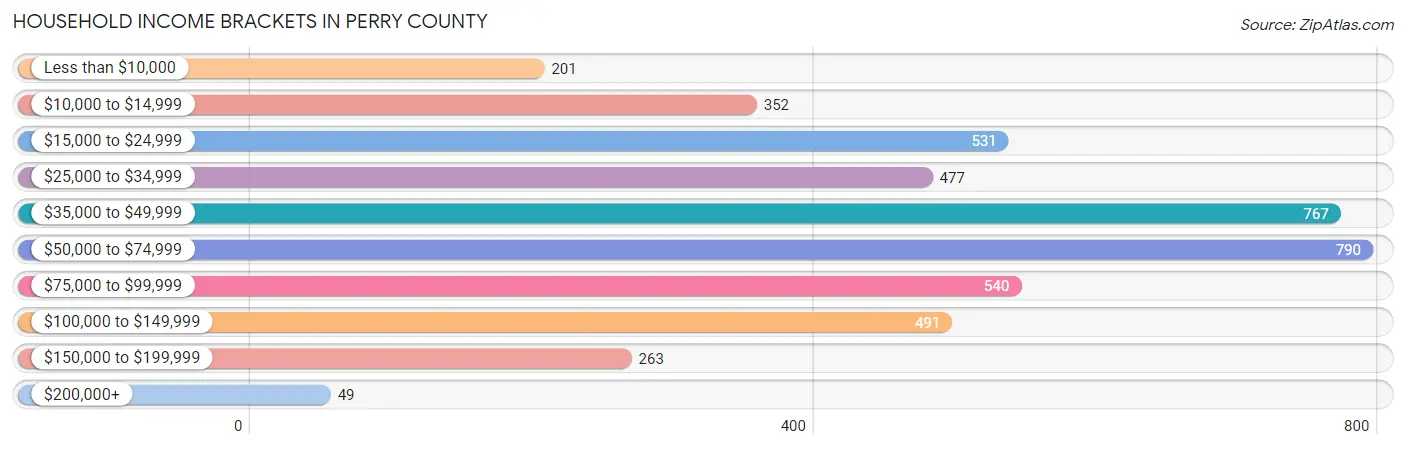
| Income Bracket | # Households | % Households |
| Less than $10,000 | 201 | 4.5% |
| $10,000 to $14,999 | 352 | 7.9% |
| $15,000 to $24,999 | 531 | 11.9% |
| $25,000 to $34,999 | 477 | 10.7% |
| $35,000 to $49,999 | 767 | 17.2% |
| $50,000 to $74,999 | 790 | 17.7% |
| $75,000 to $99,999 | 540 | 12.1% |
| $100,000 to $149,999 | 491 | 11.0% |
| $150,000 to $199,999 | 263 | 5.9% |
| $200,000+ | 49 | 1.1% |
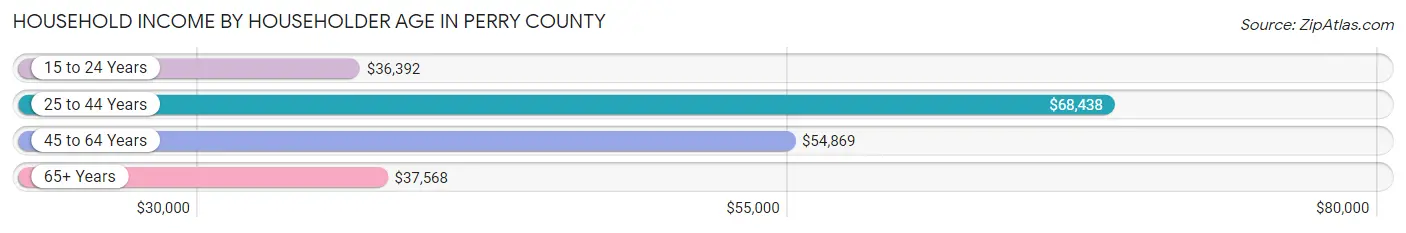
Household Income by Householder Age in Perry County
The median household income in Perry County is $48,333, with the highest median household income of $68,438 found in the 25 to 44 years age bracket for the primary householder. A total of 1,283 households (28.7%) fall into this category. Meanwhile, the 15 to 24 years age bracket for the primary householder has the lowest median household income of $36,392, with 216 households (4.8%) in this group.
| Income Bracket | # Households | Median Income |
| 15 to 24 Years | 216 (4.8%) | $36,392 |
| 25 to 44 Years | 1,283 (28.7%) | $68,438 |
| 45 to 64 Years | 1,593 (35.7%) | $54,869 |
| 65+ Years | 1,370 (30.7%) | $37,568 |
| Total | 4,462 (100.0%) | $48,333 |
Poverty in Perry County
Income Below Poverty by Sex and Age in Perry County
With 16.2% poverty level for males and 25.1% for females among the residents of Perry County, 12 to 14 year old males and 16 and 17 year old females are the most vulnerable to poverty, with 145 males (41.9%) and 34 females (63.0%) in their respective age groups living below the poverty level.
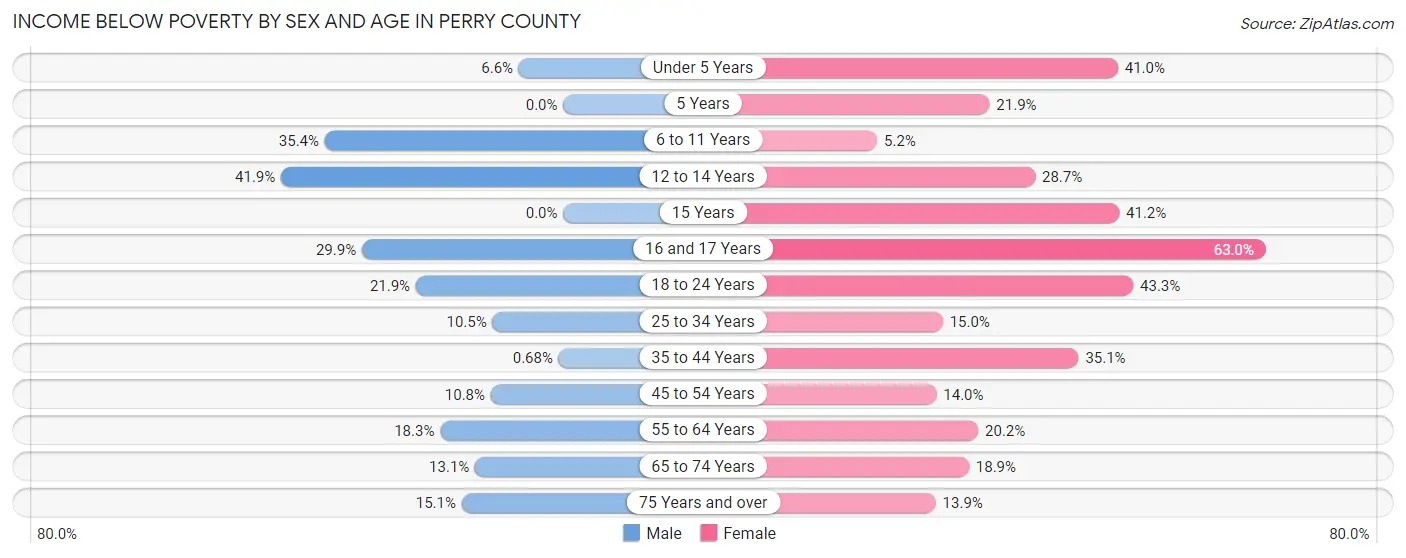
| Age Bracket | Male | Female |
| Under 5 Years | 13 (6.6%) | 109 (41.0%) |
| 5 Years | 0 (0.0%) | 16 (21.9%) |
| 6 to 11 Years | 148 (35.4%) | 13 (5.2%) |
| 12 to 14 Years | 145 (41.9%) | 68 (28.7%) |
| 15 Years | 0 (0.0%) | 35 (41.2%) |
| 16 and 17 Years | 93 (29.9%) | 34 (63.0%) |
| 18 to 24 Years | 111 (21.9%) | 308 (43.3%) |
| 25 to 34 Years | 52 (10.5%) | 65 (15.0%) |
| 35 to 44 Years | 6 (0.7%) | 291 (35.1%) |
| 45 to 54 Years | 72 (10.8%) | 91 (14.0%) |
| 55 to 64 Years | 145 (18.3%) | 168 (20.2%) |
| 65 to 74 Years | 76 (13.1%) | 124 (18.9%) |
| 75 Years and over | 57 (15.1%) | 64 (13.9%) |
| Total | 918 (16.2%) | 1,386 (25.1%) |
Income Above Poverty by Sex and Age in Perry County
According to the poverty statistics in Perry County, males aged 5 years and females aged 6 to 11 years are the age groups that are most secure financially, with 100.0% of males and 94.8% of females in these age groups living above the poverty line.
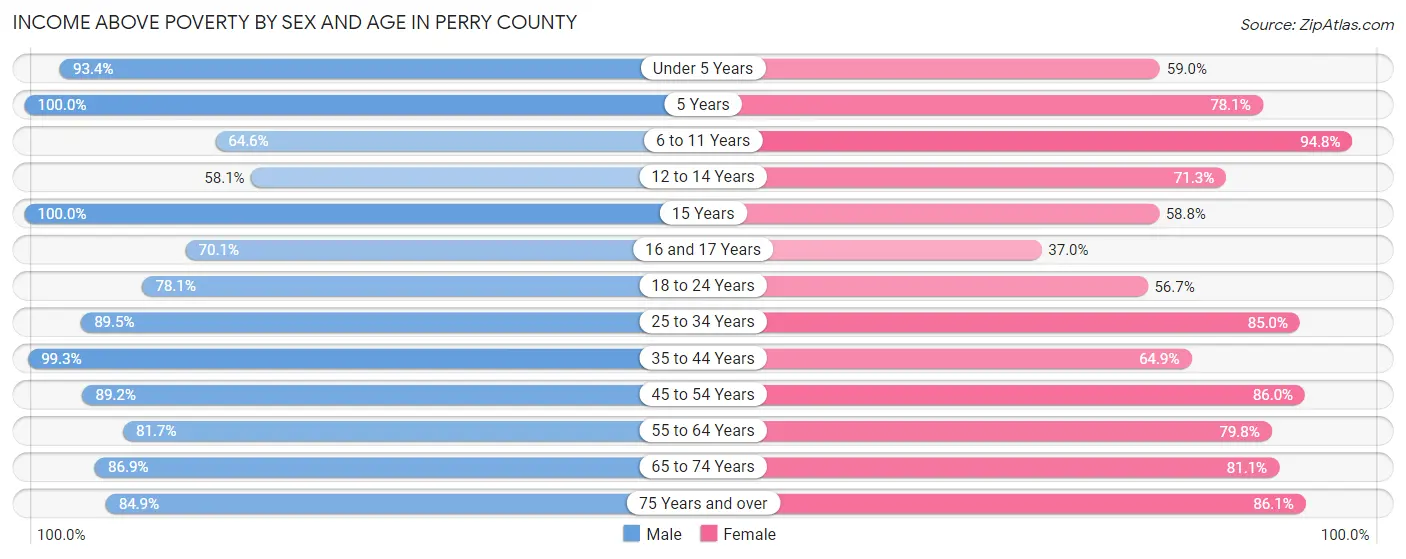
| Age Bracket | Male | Female |
| Under 5 Years | 184 (93.4%) | 157 (59.0%) |
| 5 Years | 10 (100.0%) | 57 (78.1%) |
| 6 to 11 Years | 270 (64.6%) | 235 (94.8%) |
| 12 to 14 Years | 201 (58.1%) | 169 (71.3%) |
| 15 Years | 69 (100.0%) | 50 (58.8%) |
| 16 and 17 Years | 218 (70.1%) | 20 (37.0%) |
| 18 to 24 Years | 396 (78.1%) | 404 (56.7%) |
| 25 to 34 Years | 443 (89.5%) | 369 (85.0%) |
| 35 to 44 Years | 882 (99.3%) | 537 (64.9%) |
| 45 to 54 Years | 597 (89.2%) | 557 (86.0%) |
| 55 to 64 Years | 648 (81.7%) | 662 (79.8%) |
| 65 to 74 Years | 504 (86.9%) | 533 (81.1%) |
| 75 Years and over | 321 (84.9%) | 395 (86.1%) |
| Total | 4,743 (83.8%) | 4,145 (74.9%) |
Income Below Poverty Among Married-Couple Families in Perry County
The poverty statistics for married-couple families in Perry County show that 10.5% or 210 of the total 1,991 families live below the poverty line. Families with 3 or 4 children have the highest poverty rate of 57.4%, comprising of 66 families. On the other hand, families with 5 or more children have the lowest poverty rate of 0.0%, which includes 0 families.
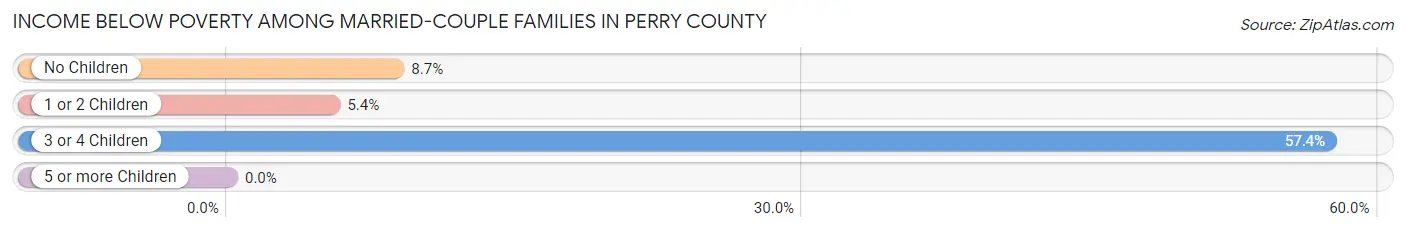
| Children | Above Poverty | Below Poverty |
| No Children | 1,208 (91.3%) | 115 (8.7%) |
| 1 or 2 Children | 513 (94.7%) | 29 (5.3%) |
| 3 or 4 Children | 49 (42.6%) | 66 (57.4%) |
| 5 or more Children | 11 (100.0%) | 0 (0.0%) |
| Total | 1,781 (89.4%) | 210 (10.5%) |
Income Below Poverty Among Single-Parent Households in Perry County
According to the poverty data in Perry County, 20.8% or 42 single-father households and 35.2% or 225 single-mother households are living below the poverty line. Among single-father households, those with no children have the highest poverty rate, with 34 households (41.5%) experiencing poverty. Likewise, among single-mother households, those with 5 or more children have the highest poverty rate, with 6 households (60.0%) falling below the poverty line.
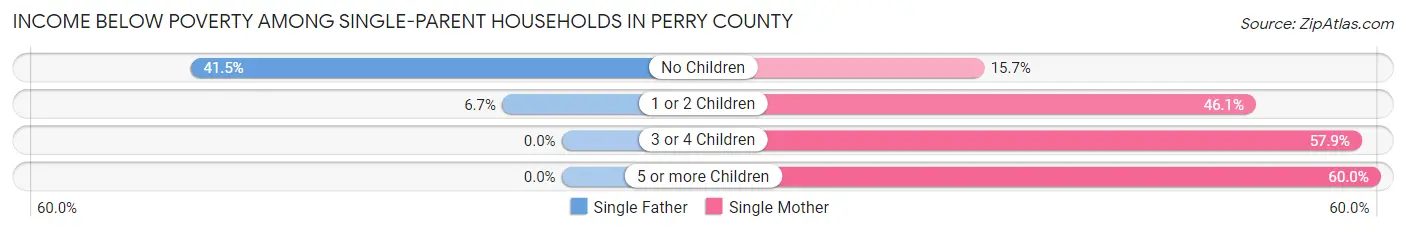
| Children | Single Father | Single Mother |
| No Children | 34 (41.5%) | 41 (15.7%) |
| 1 or 2 Children | 8 (6.7%) | 134 (46.1%) |
| 3 or 4 Children | 0 (0.0%) | 44 (57.9%) |
| 5 or more Children | 0 (0.0%) | 6 (60.0%) |
| Total | 42 (20.8%) | 225 (35.2%) |
Income Below Poverty Among Married-Couple vs Single-Parent Households in Perry County
The poverty data for Perry County shows that 210 of the married-couple family households (10.5%) and 267 of the single-parent households (31.8%) are living below the poverty level. Within the married-couple family households, those with 3 or 4 children have the highest poverty rate, with 66 households (57.4%) falling below the poverty line. Among the single-parent households, those with 5 or more children have the highest poverty rate, with 6 household (60.0%) living below poverty.
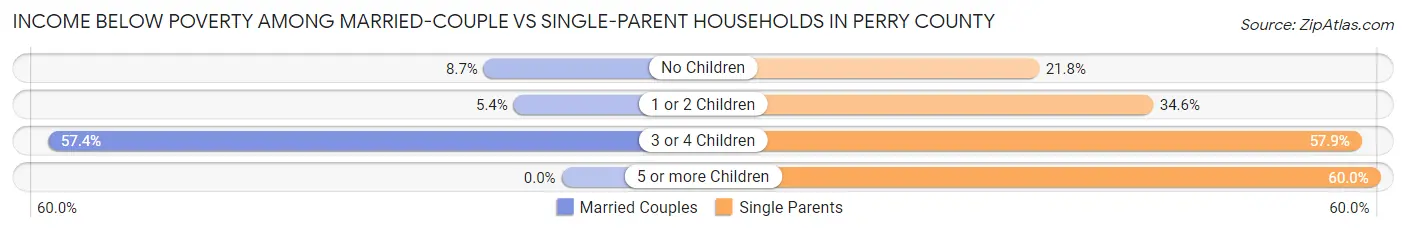
| Children | Married-Couple Families | Single-Parent Households |
| No Children | 115 (8.7%) | 75 (21.8%) |
| 1 or 2 Children | 29 (5.3%) | 142 (34.5%) |
| 3 or 4 Children | 66 (57.4%) | 44 (57.9%) |
| 5 or more Children | 0 (0.0%) | 6 (60.0%) |
| Total | 210 (10.5%) | 267 (31.8%) |
Race in Perry County
The most populous races in Perry County are White / Caucasian (9,253 | 80.4%), Black / African American (1,333 | 11.6%), and Hispanic or Latino (808 | 7.0%).
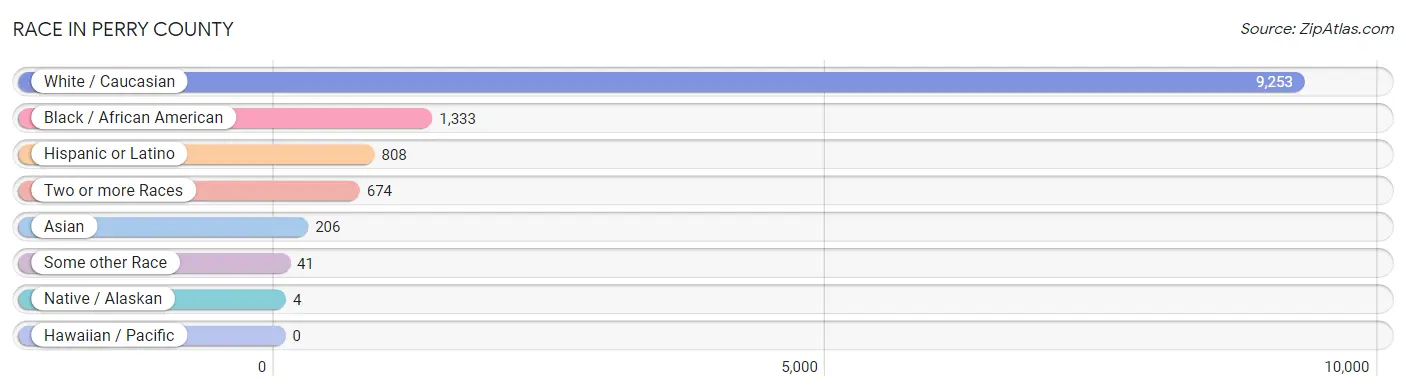
| Race | # Population | % Population |
| Asian | 206 | 1.8% |
| Black / African American | 1,333 | 11.6% |
| Hawaiian / Pacific | 0 | 0.0% |
| Hispanic or Latino | 808 | 7.0% |
| Native / Alaskan | 4 | 0.0% |
| White / Caucasian | 9,253 | 80.4% |
| Two or more Races | 674 | 5.9% |
| Some other Race | 41 | 0.4% |
| Total | 11,511 | 100.0% |
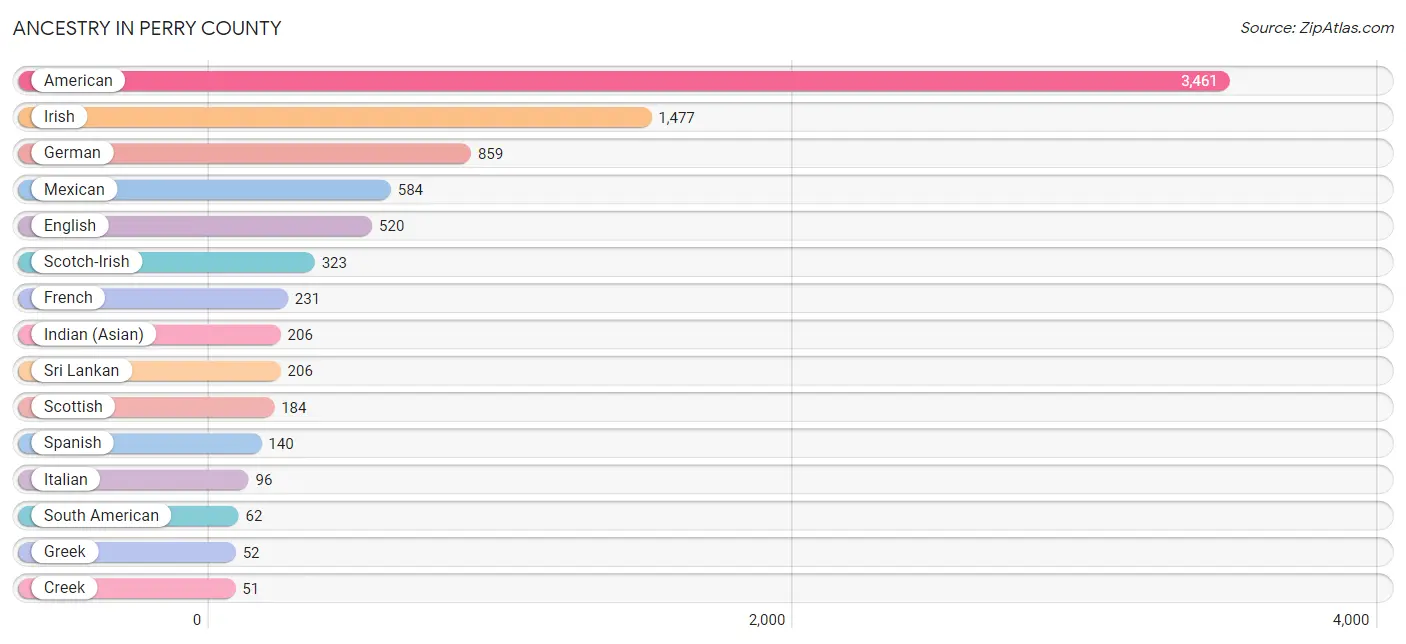
Ancestry in Perry County
The most populous ancestries reported in Perry County are American (3,461 | 30.1%), Irish (1,477 | 12.8%), German (859 | 7.5%), Mexican (584 | 5.1%), and English (520 | 4.5%), together accounting for 60.0% of all Perry County residents.
| Ancestry | # Population | % Population |
| American | 3,461 | 30.1% |
| Arab | 3 | 0.0% |
| Cherokee | 25 | 0.2% |
| Choctaw | 2 | 0.0% |
| Colombian | 20 | 0.2% |
| Creek | 51 | 0.4% |
| Dutch | 38 | 0.3% |
| Eastern European | 26 | 0.2% |
| English | 520 | 4.5% |
| European | 32 | 0.3% |
| French | 231 | 2.0% |
| German | 859 | 7.5% |
| Greek | 52 | 0.4% |
| Indian (Asian) | 206 | 1.8% |
| Irish | 1,477 | 12.8% |
| Italian | 96 | 0.8% |
| Korean | 8 | 0.1% |
| Lebanese | 3 | 0.0% |
| Mexican | 584 | 5.1% |
| Norwegian | 47 | 0.4% |
| Polish | 27 | 0.2% |
| Scotch-Irish | 323 | 2.8% |
| Scottish | 184 | 1.6% |
| South American | 62 | 0.5% |
| Spaniard | 6 | 0.1% |
| Spanish | 140 | 1.2% |
| Sri Lankan | 206 | 1.8% |
| Swedish | 2 | 0.0% |
| Venezuelan | 42 | 0.4% |
| Welsh | 6 | 0.1% | View All 30 Rows |
Immigrants in Perry County
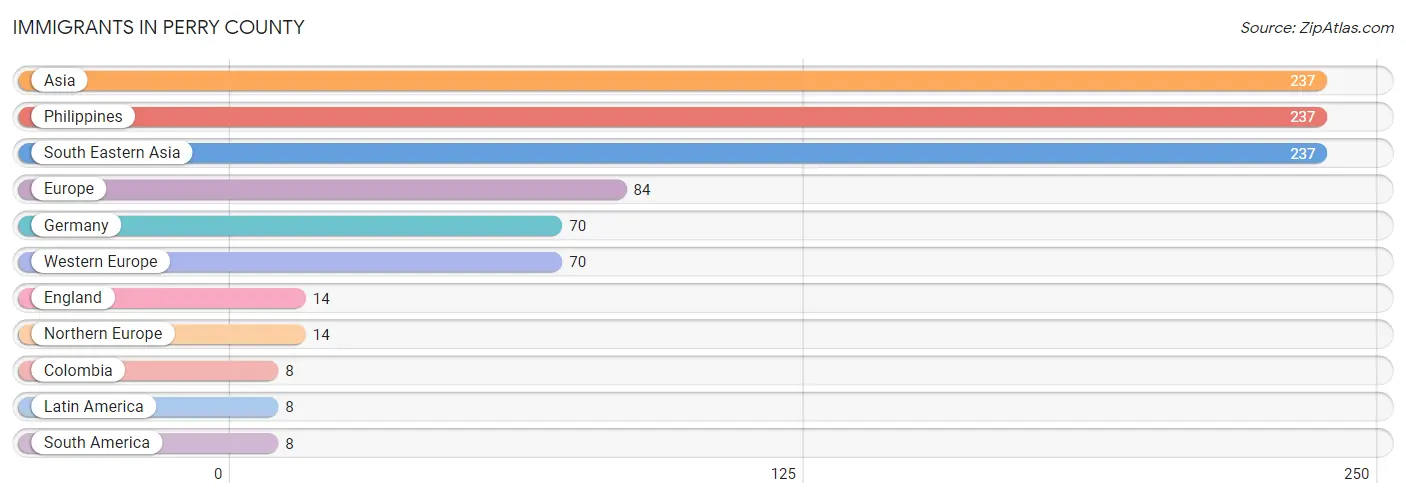
The most numerous immigrant groups reported in Perry County came from Asia (237 | 2.1%), Philippines (237 | 2.1%), South Eastern Asia (237 | 2.1%), Europe (84 | 0.7%), and Germany (70 | 0.6%), together accounting for 7.5% of all Perry County residents.
| Immigration Origin | # Population | % Population |
| Asia | 237 | 2.1% |
| Colombia | 8 | 0.1% |
| England | 14 | 0.1% |
| Europe | 84 | 0.7% |
| Germany | 70 | 0.6% |
| Latin America | 8 | 0.1% |
| Northern Europe | 14 | 0.1% |
| Philippines | 237 | 2.1% |
| South America | 8 | 0.1% |
| South Eastern Asia | 237 | 2.1% |
| Western Europe | 70 | 0.6% | View All 11 Rows |
Sex and Age in Perry County
Sex and Age in Perry County
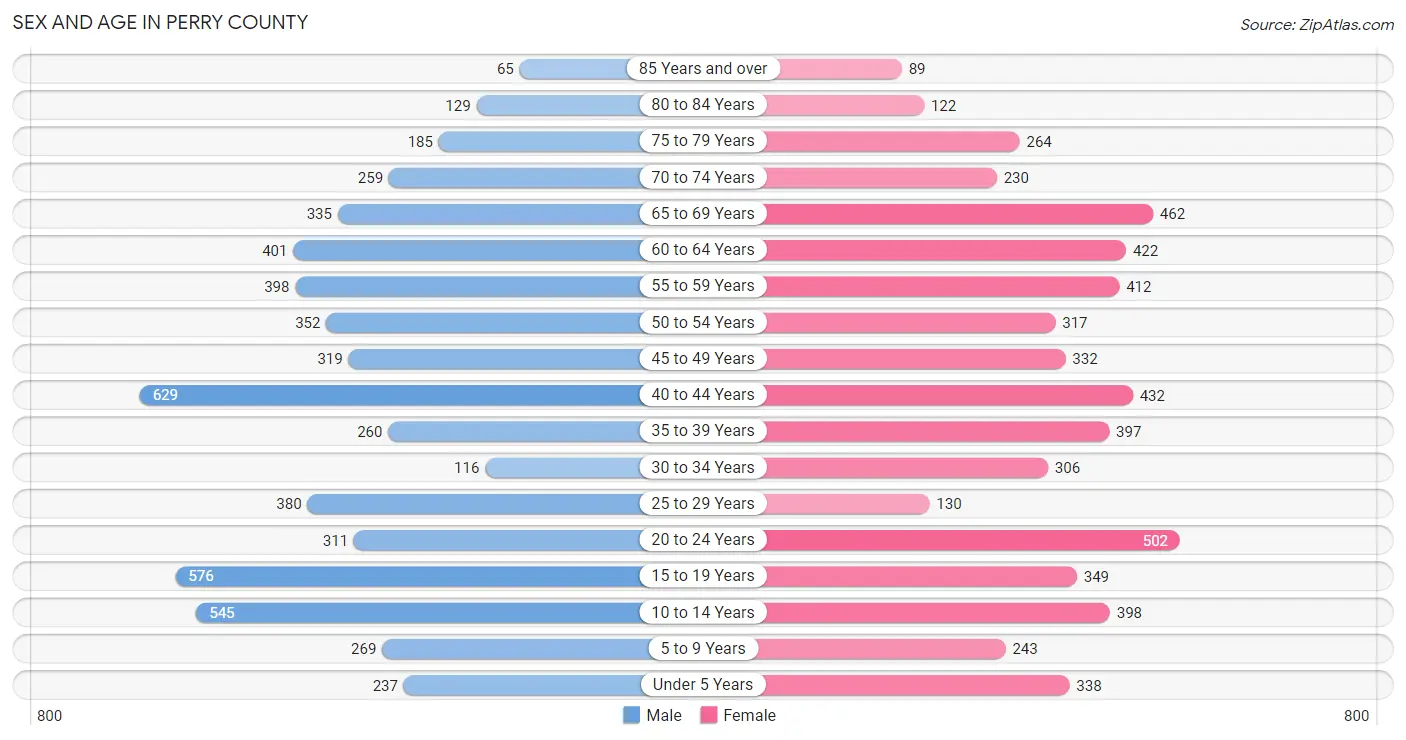
The most populous age groups in Perry County are 40 to 44 Years (629 | 10.9%) for men and 20 to 24 Years (502 | 8.7%) for women.
| Age Bracket | Male | Female |
| Under 5 Years | 237 (4.1%) | 338 (5.9%) |
| 5 to 9 Years | 269 (4.7%) | 243 (4.2%) |
| 10 to 14 Years | 545 (9.5%) | 398 (6.9%) |
| 15 to 19 Years | 576 (10.0%) | 349 (6.1%) |
| 20 to 24 Years | 311 (5.4%) | 502 (8.7%) |
| 25 to 29 Years | 380 (6.6%) | 130 (2.3%) |
| 30 to 34 Years | 116 (2.0%) | 306 (5.3%) |
| 35 to 39 Years | 260 (4.5%) | 397 (6.9%) |
| 40 to 44 Years | 629 (10.9%) | 432 (7.5%) |
| 45 to 49 Years | 319 (5.5%) | 332 (5.8%) |
| 50 to 54 Years | 352 (6.1%) | 317 (5.5%) |
| 55 to 59 Years | 398 (6.9%) | 412 (7.2%) |
| 60 to 64 Years | 401 (7.0%) | 422 (7.3%) |
| 65 to 69 Years | 335 (5.8%) | 462 (8.0%) |
| 70 to 74 Years | 259 (4.5%) | 230 (4.0%) |
| 75 to 79 Years | 185 (3.2%) | 264 (4.6%) |
| 80 to 84 Years | 129 (2.2%) | 122 (2.1%) |
| 85 Years and over | 65 (1.1%) | 89 (1.5%) |
| Total | 5,766 (100.0%) | 5,745 (100.0%) |
Families and Households in Perry County
Median Family Size in Perry County
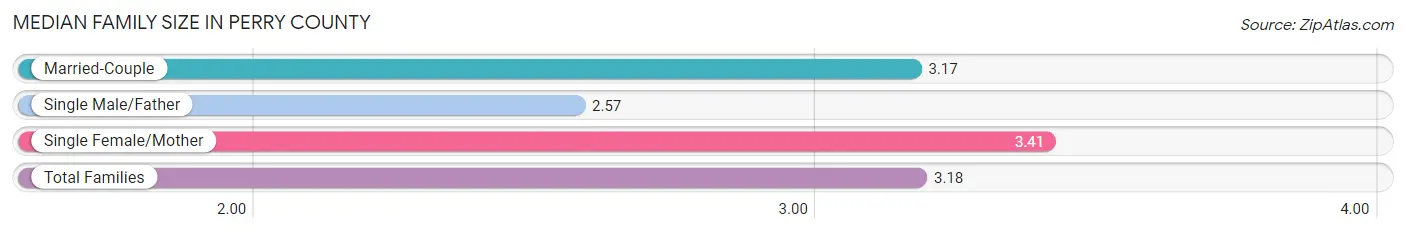
The median family size in Perry County is 3.18 persons per family, with single female/mother families (639 | 22.6%) accounting for the largest median family size of 3.41 persons per family. On the other hand, single male/father families (202 | 7.1%) represent the smallest median family size with 2.57 persons per family.
| Family Type | # Families | Family Size |
| Married-Couple | 1,991 (70.3%) | 3.17 |
| Single Male/Father | 202 (7.1%) | 2.57 |
| Single Female/Mother | 639 (22.6%) | 3.41 |
| Total Families | 2,832 (100.0%) | 3.18 |
Median Household Size in Perry County
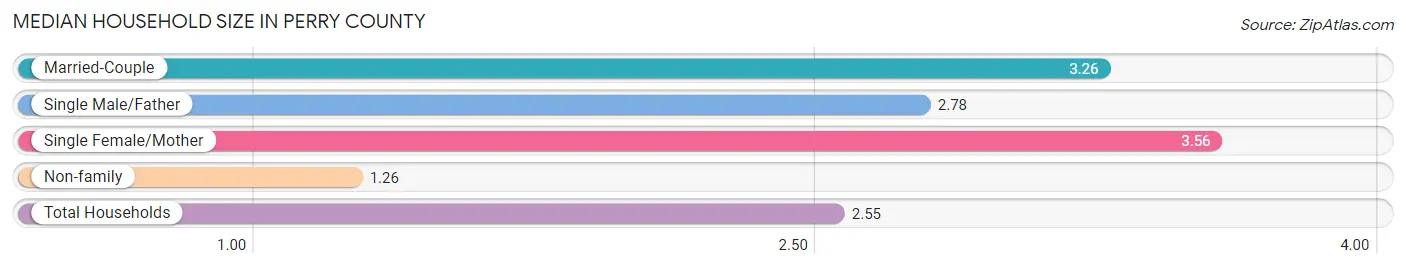
The median household size in Perry County is 2.55 persons per household, with single female/mother households (639 | 14.3%) accounting for the largest median household size of 3.56 persons per household. non-family households (1,630 | 36.5%) represent the smallest median household size with 1.26 persons per household.
| Household Type | # Households | Household Size |
| Married-Couple | 1,991 (44.6%) | 3.26 |
| Single Male/Father | 202 (4.5%) | 2.78 |
| Single Female/Mother | 639 (14.3%) | 3.56 |
| Non-family | 1,630 (36.5%) | 1.26 |
| Total Households | 4,462 (100.0%) | 2.55 |
Household Size by Marriage Status in Perry County
Out of a total of 4,462 households in Perry County, 2,832 (63.5%) are family households, while 1,630 (36.5%) are nonfamily households. The most numerous type of family households are 2-person households, comprising 1,496, and the most common type of nonfamily households are 1-person households, comprising 1,187.
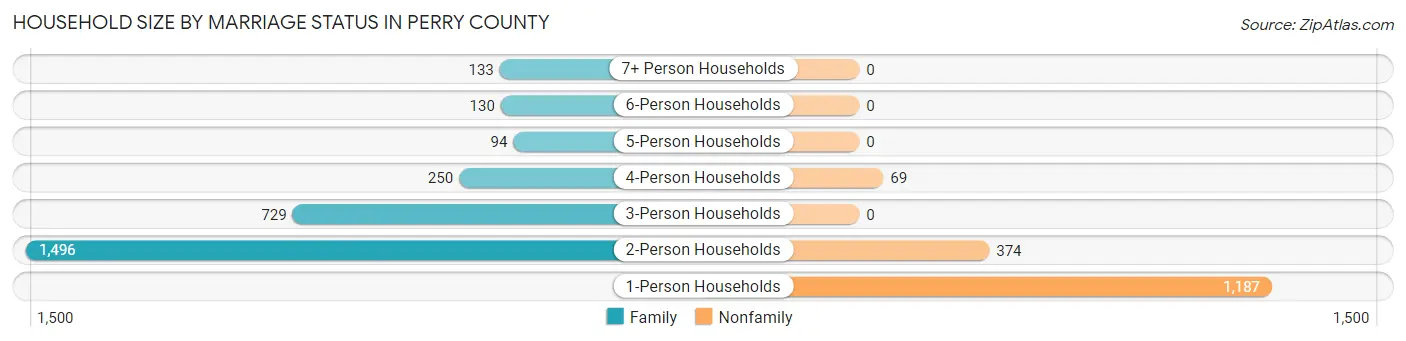
| Household Size | Family Households | Nonfamily Households |
| 1-Person Households | - | 1,187 (26.6%) |
| 2-Person Households | 1,496 (33.5%) | 374 (8.4%) |
| 3-Person Households | 729 (16.3%) | 0 (0.0%) |
| 4-Person Households | 250 (5.6%) | 69 (1.5%) |
| 5-Person Households | 94 (2.1%) | 0 (0.0%) |
| 6-Person Households | 130 (2.9%) | 0 (0.0%) |
| 7+ Person Households | 133 (3.0%) | 0 (0.0%) |
| Total | 2,832 (63.5%) | 1,630 (36.5%) |
Female Fertility in Perry County
Fertility by Age in Perry County
Average fertility rate in Perry County is 41.0 births per 1,000 women. Women in the age bracket of 15 to 19 years have the highest fertility rate with 97.0 births per 1,000 women. Women in the age bracket of 20 to 34 years acount for 37.5% of all women with births.
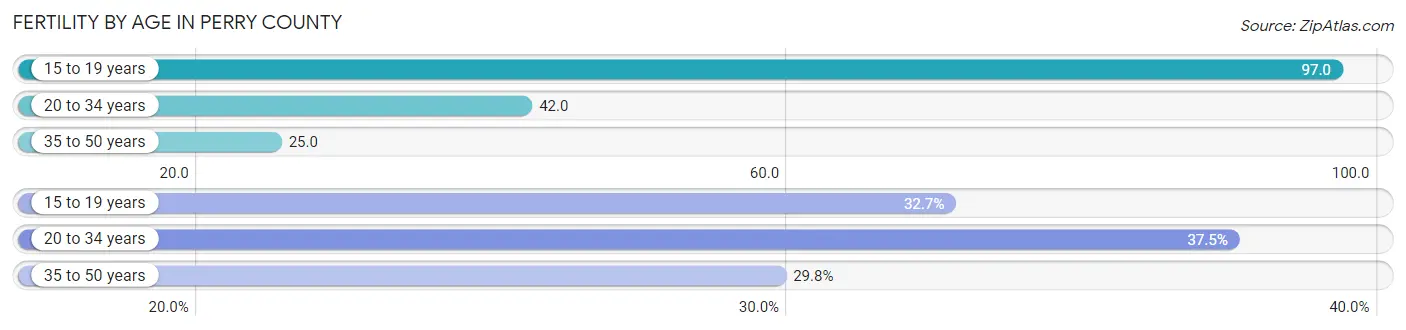
| Age Bracket | Women with Births | Births / 1,000 Women |
| 15 to 19 years | 34 (32.7%) | 97.0 |
| 20 to 34 years | 39 (37.5%) | 42.0 |
| 35 to 50 years | 31 (29.8%) | 25.0 |
| Total | 104 (100.0%) | 41.0 |
Fertility by Age by Marriage Status in Perry County
48.1% of women with births (104) in Perry County are married. The highest percentage of unmarried women with births falls into 15 to 19 years age bracket with 100.0% of them unmarried at the time of birth, while the lowest percentage of unmarried women with births belong to 35 to 50 years age bracket with 0.0% of them unmarried.
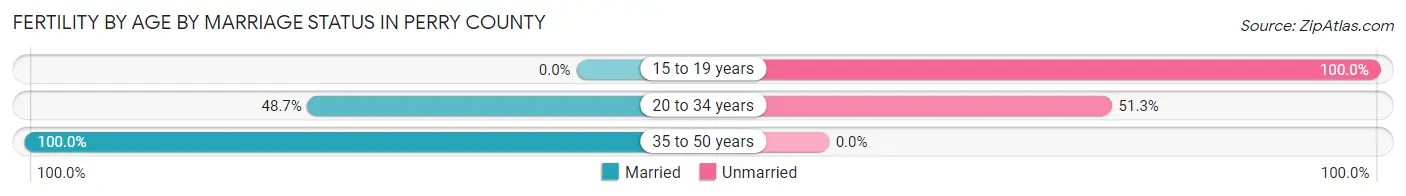
| Age Bracket | Married | Unmarried |
| 15 to 19 years | 0 (0.0%) | 34 (100.0%) |
| 20 to 34 years | 19 (48.7%) | 20 (51.3%) |
| 35 to 50 years | 31 (100.0%) | 0 (0.0%) |
| Total | 50 (48.1%) | 54 (51.9%) |
Fertility by Education in Perry County
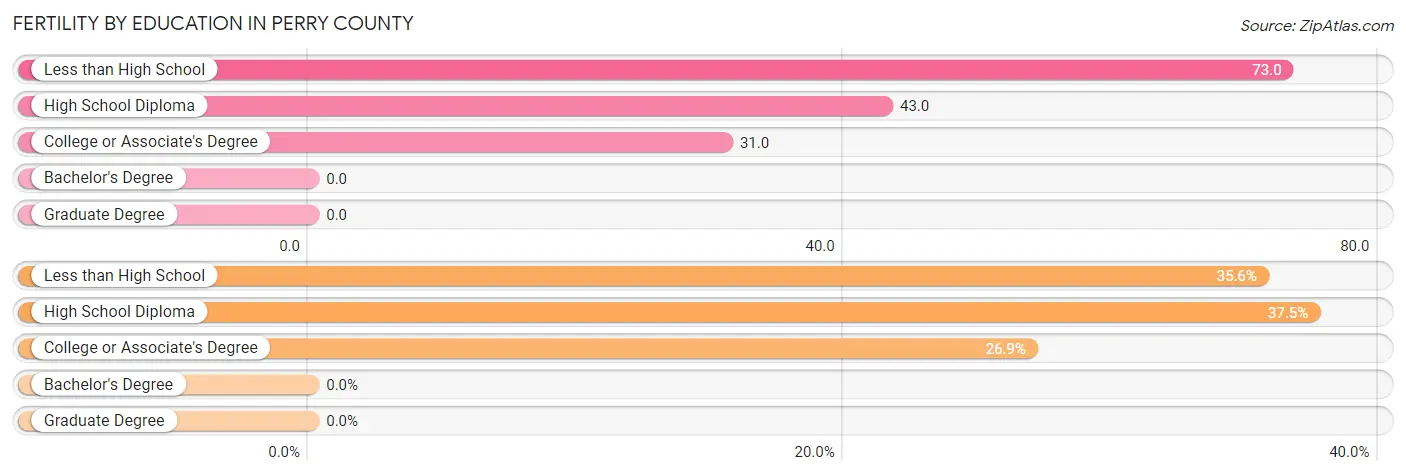
| Educational Attainment | Women with Births | Births / 1,000 Women |
| Less than High School | 37 (35.6%) | 73.0 |
| High School Diploma | 39 (37.5%) | 43.0 |
| College or Associate's Degree | 28 (26.9%) | 31.0 |
| Bachelor's Degree | 0 (0.0%) | 0.0 |
| Graduate Degree | 0 (0.0%) | 0.0 |
| Total | 104 (100.0%) | 41.0 |
Fertility by Education by Marriage Status in Perry County
51.9% of women with births in Perry County are unmarried. Women with the educational attainment of high school diploma are most likely to be married with 89.7% of them married at childbirth, while women with the educational attainment of less than high school are least likely to be married with 100.0% of them unmarried at childbirth.
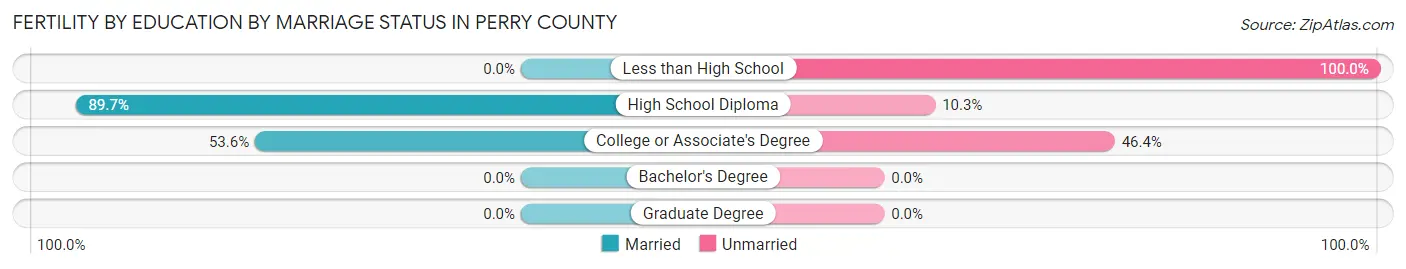
| Educational Attainment | Married | Unmarried |
| Less than High School | 0 (0.0%) | 37 (100.0%) |
| High School Diploma | 35 (89.7%) | 4 (10.3%) |
| College or Associate's Degree | 15 (53.6%) | 13 (46.4%) |
| Bachelor's Degree | 0 (0.0%) | 0 (0.0%) |
| Graduate Degree | 0 (0.0%) | 0 (0.0%) |
| Total | 50 (48.1%) | 54 (51.9%) |
Employment Characteristics in Perry County
Employment by Class of Employer in Perry County
Among the 3,972 employed individuals in Perry County, private company employees (2,504 | 63.0%), state government employees (474 | 11.9%), and federal government employees (415 | 10.4%) make up the most common classes of employment.
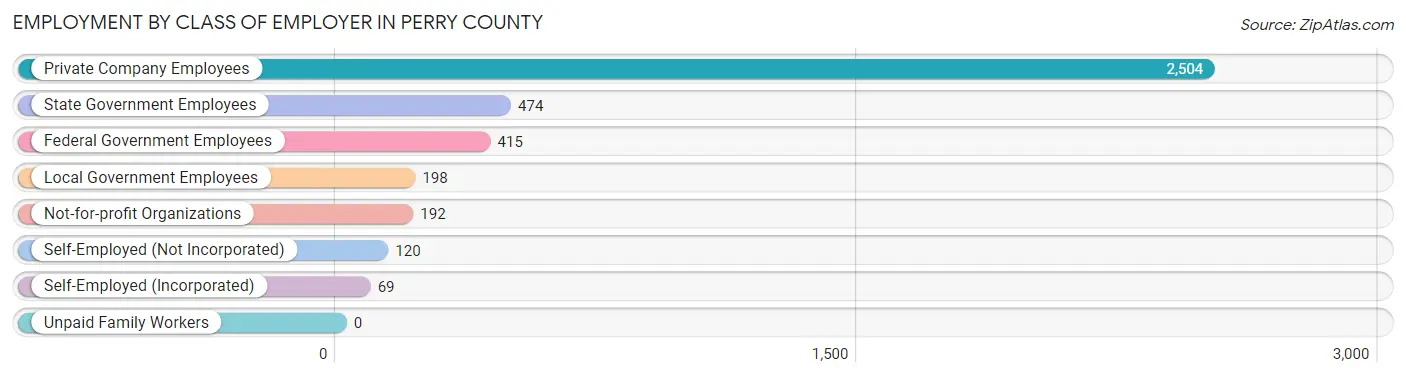
| Employer Class | # Employees | % Employees |
| Private Company Employees | 2,504 | 63.0% |
| Self-Employed (Incorporated) | 69 | 1.7% |
| Self-Employed (Not Incorporated) | 120 | 3.0% |
| Not-for-profit Organizations | 192 | 4.8% |
| Local Government Employees | 198 | 5.0% |
| State Government Employees | 474 | 11.9% |
| Federal Government Employees | 415 | 10.4% |
| Unpaid Family Workers | 0 | 0.0% |
| Total | 3,972 | 100.0% |
Employment Status by Age in Perry County
According to the labor force statistics for Perry County, out of the total population over 16 years of age (9,327), 48.5% or 4,524 individuals are in the labor force, with 6.3% or 285 of them unemployed. The age group with the highest labor force participation rate is 30 to 34 years, with 90.5% or 382 individuals in the labor force. Within the labor force, the 16 to 19 years age range has the highest percentage of unemployed individuals, with 32.3% or 80 of them being unemployed.
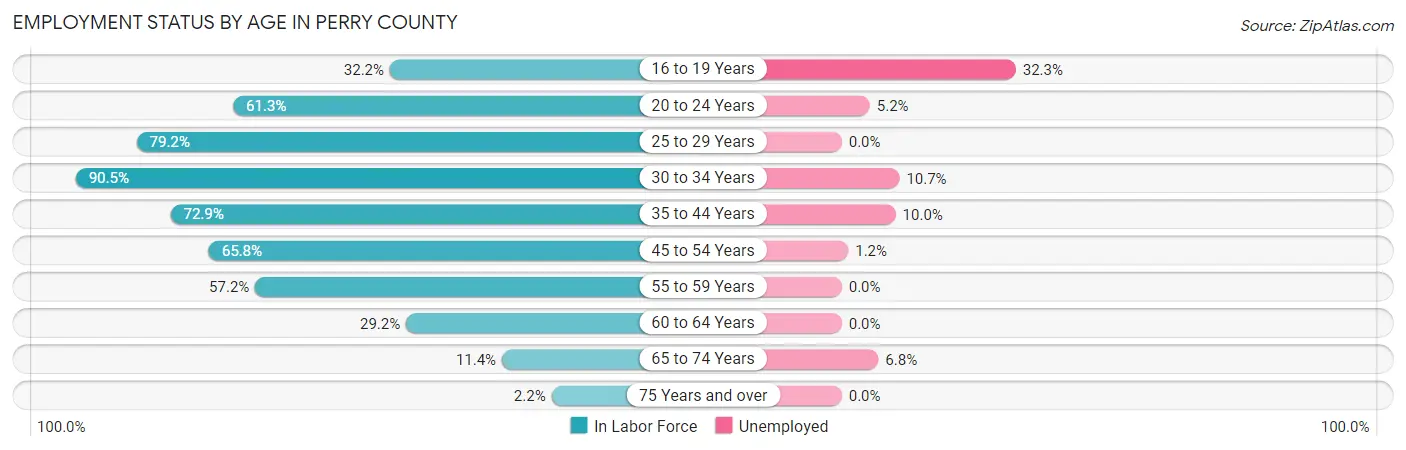
| Age Bracket | In Labor Force | Unemployed |
| 16 to 19 Years | 248 (32.2%) | 80 (32.3%) |
| 20 to 24 Years | 498 (61.3%) | 26 (5.2%) |
| 25 to 29 Years | 404 (79.2%) | 0 (0.0%) |
| 30 to 34 Years | 382 (90.5%) | 41 (10.7%) |
| 35 to 44 Years | 1,252 (72.9%) | 125 (10.0%) |
| 45 to 54 Years | 869 (65.8%) | 10 (1.2%) |
| 55 to 59 Years | 463 (57.2%) | 0 (0.0%) |
| 60 to 64 Years | 240 (29.2%) | 0 (0.0%) |
| 65 to 74 Years | 147 (11.4%) | 10 (6.8%) |
| 75 Years and over | 19 (2.2%) | 0 (0.0%) |
| Total | 4,524 (48.5%) | 285 (6.3%) |
Employment Status by Educational Attainment in Perry County
According to labor force statistics for Perry County, 64.4% of individuals (3,608) out of the total population between 25 and 64 years of age (5,603) are in the labor force, with 4.6% or 166 of them being unemployed. The group with the highest labor force participation rate are those with the educational attainment of college / associate degree, with 77.3% or 1,503 individuals in the labor force. Within the labor force, individuals with less than high school education have the highest percentage of unemployment, with 14.3% or 41 of them being unemployed.
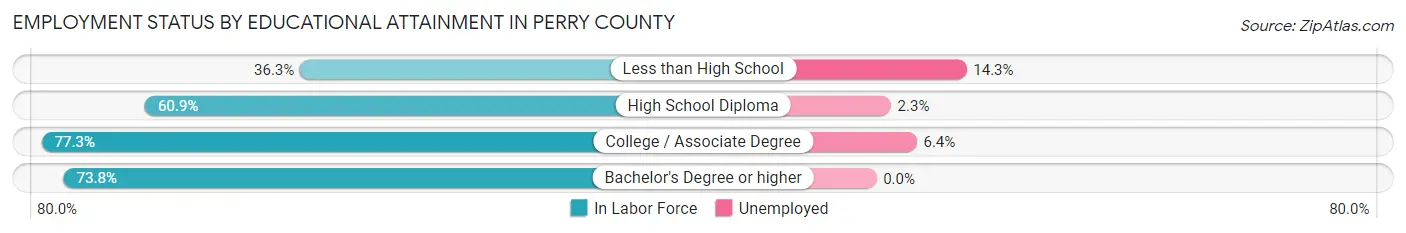
| Educational Attainment | In Labor Force | Unemployed |
| Less than High School | 287 (36.3%) | 113 (14.3%) |
| High School Diploma | 1,409 (60.9%) | 53 (2.3%) |
| College / Associate Degree | 1,503 (77.3%) | 124 (6.4%) |
| Bachelor's Degree or higher | 409 (73.8%) | 0 (0.0%) |
| Total | 3,608 (64.4%) | 258 (4.6%) |
Employment Occupations by Sex in Perry County
Management, Business, Science and Arts Occupations
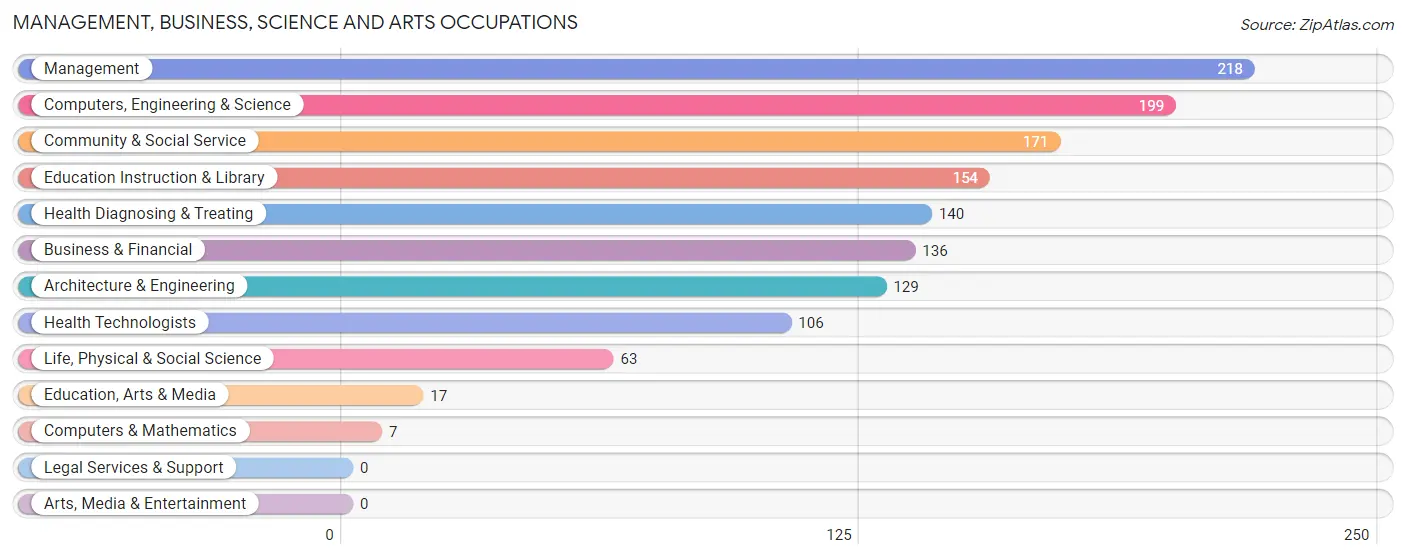
The most common Management, Business, Science and Arts occupations in Perry County are Management (218 | 5.4%), Computers, Engineering & Science (199 | 5.0%), Community & Social Service (171 | 4.3%), Education Instruction & Library (154 | 3.8%), and Health Diagnosing & Treating (140 | 3.5%).
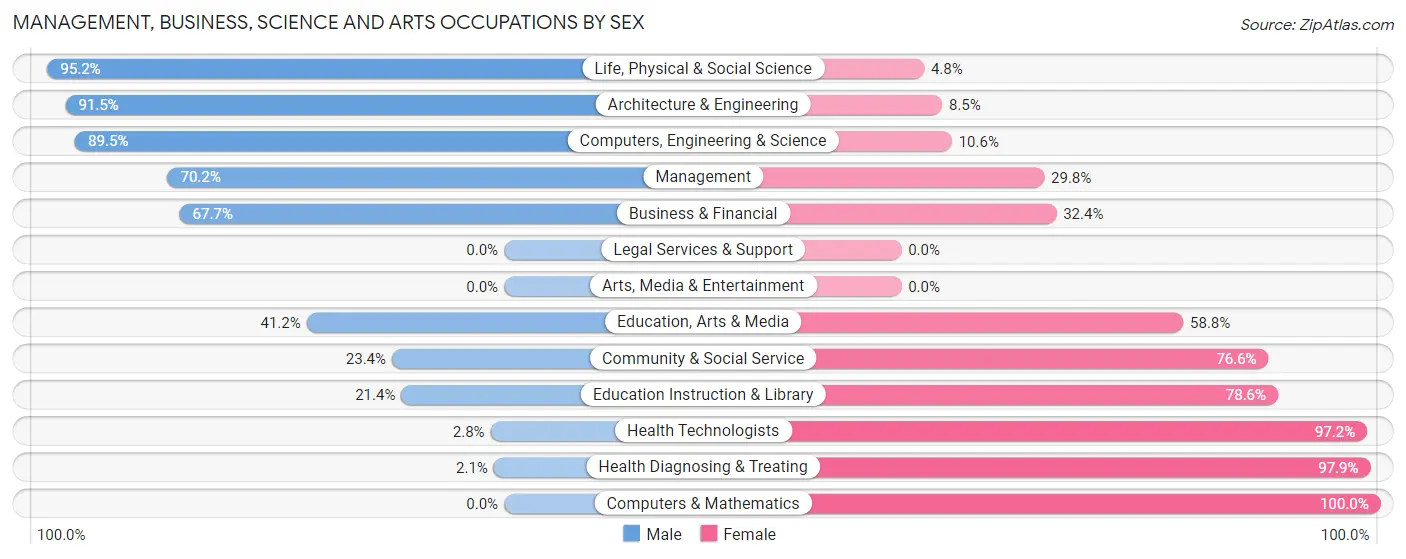
Management, Business, Science and Arts Occupations by Sex
Within the Management, Business, Science and Arts occupations in Perry County, the most male-oriented occupations are Life, Physical & Social Science (95.2%), Architecture & Engineering (91.5%), and Computers, Engineering & Science (89.4%), while the most female-oriented occupations are Computers & Mathematics (100.0%), Health Diagnosing & Treating (97.9%), and Health Technologists (97.2%).
| Occupation | Male | Female |
| Management | 153 (70.2%) | 65 (29.8%) |
| Business & Financial | 92 (67.6%) | 44 (32.4%) |
| Computers, Engineering & Science | 178 (89.4%) | 21 (10.5%) |
| Computers & Mathematics | 0 (0.0%) | 7 (100.0%) |
| Architecture & Engineering | 118 (91.5%) | 11 (8.5%) |
| Life, Physical & Social Science | 60 (95.2%) | 3 (4.8%) |
| Community & Social Service | 40 (23.4%) | 131 (76.6%) |
| Education, Arts & Media | 7 (41.2%) | 10 (58.8%) |
| Legal Services & Support | 0 (0.0%) | 0 (0.0%) |
| Education Instruction & Library | 33 (21.4%) | 121 (78.6%) |
| Arts, Media & Entertainment | 0 (0.0%) | 0 (0.0%) |
| Health Diagnosing & Treating | 3 (2.1%) | 137 (97.9%) |
| Health Technologists | 3 (2.8%) | 103 (97.2%) |
| Total (Category) | 466 (53.9%) | 398 (46.1%) |
| Total (Overall) | 2,355 (58.6%) | 1,664 (41.4%) |
Services Occupations
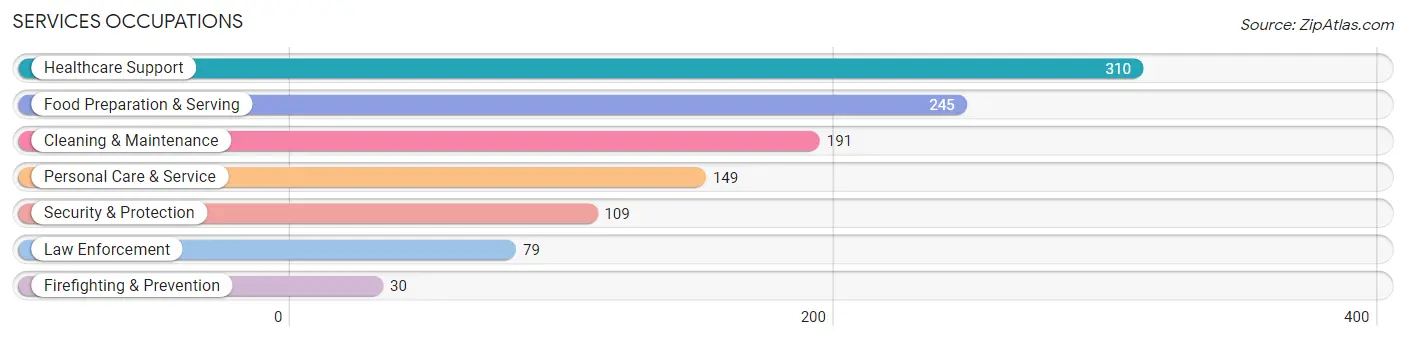
The most common Services occupations in Perry County are Healthcare Support (310 | 7.7%), Food Preparation & Serving (245 | 6.1%), Cleaning & Maintenance (191 | 4.8%), Personal Care & Service (149 | 3.7%), and Security & Protection (109 | 2.7%).
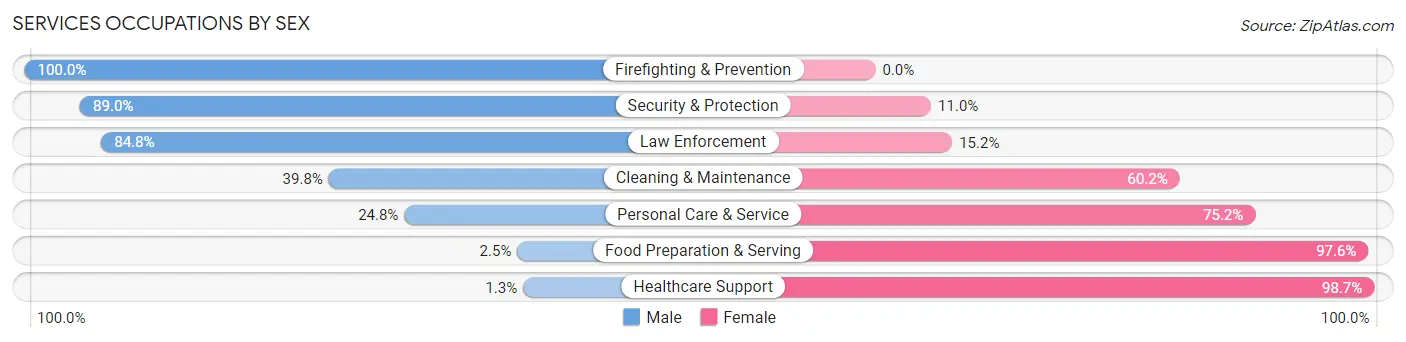
Services Occupations by Sex
Within the Services occupations in Perry County, the most male-oriented occupations are Firefighting & Prevention (100.0%), Security & Protection (89.0%), and Law Enforcement (84.8%), while the most female-oriented occupations are Healthcare Support (98.7%), Food Preparation & Serving (97.6%), and Personal Care & Service (75.2%).
| Occupation | Male | Female |
| Healthcare Support | 4 (1.3%) | 306 (98.7%) |
| Security & Protection | 97 (89.0%) | 12 (11.0%) |
| Firefighting & Prevention | 30 (100.0%) | 0 (0.0%) |
| Law Enforcement | 67 (84.8%) | 12 (15.2%) |
| Food Preparation & Serving | 6 (2.5%) | 239 (97.6%) |
| Cleaning & Maintenance | 76 (39.8%) | 115 (60.2%) |
| Personal Care & Service | 37 (24.8%) | 112 (75.2%) |
| Total (Category) | 220 (21.9%) | 784 (78.1%) |
| Total (Overall) | 2,355 (58.6%) | 1,664 (41.4%) |
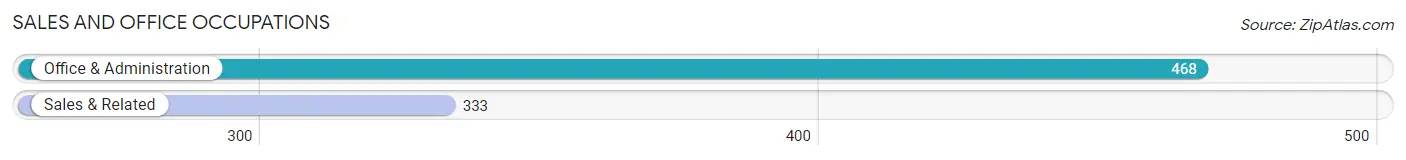
Sales and Office Occupations
The most common Sales and Office occupations in Perry County are Office & Administration (468 | 11.6%), and Sales & Related (333 | 8.3%).
Sales and Office Occupations by Sex
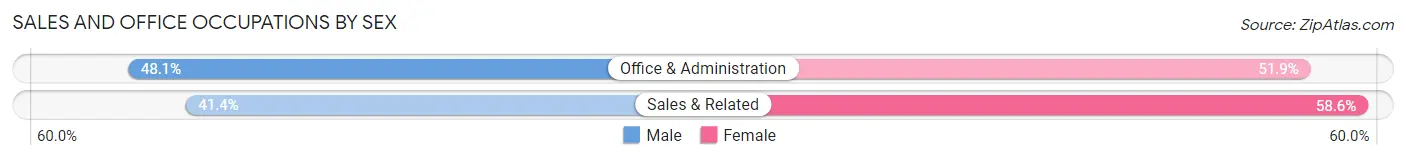
| Occupation | Male | Female |
| Sales & Related | 138 (41.4%) | 195 (58.6%) |
| Office & Administration | 225 (48.1%) | 243 (51.9%) |
| Total (Category) | 363 (45.3%) | 438 (54.7%) |
| Total (Overall) | 2,355 (58.6%) | 1,664 (41.4%) |
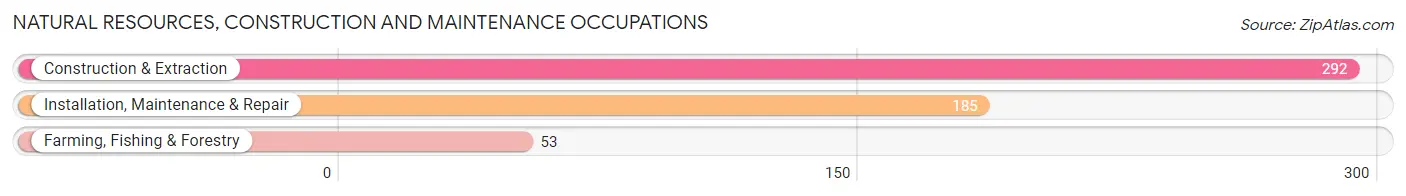
Natural Resources, Construction and Maintenance Occupations
The most common Natural Resources, Construction and Maintenance occupations in Perry County are Construction & Extraction (292 | 7.3%), Installation, Maintenance & Repair (185 | 4.6%), and Farming, Fishing & Forestry (53 | 1.3%).
Natural Resources, Construction and Maintenance Occupations by Sex
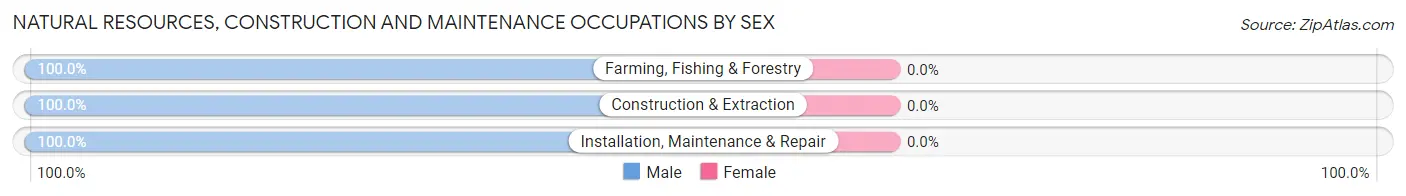
| Occupation | Male | Female |
| Farming, Fishing & Forestry | 53 (100.0%) | 0 (0.0%) |
| Construction & Extraction | 292 (100.0%) | 0 (0.0%) |
| Installation, Maintenance & Repair | 185 (100.0%) | 0 (0.0%) |
| Total (Category) | 530 (100.0%) | 0 (0.0%) |
| Total (Overall) | 2,355 (58.6%) | 1,664 (41.4%) |
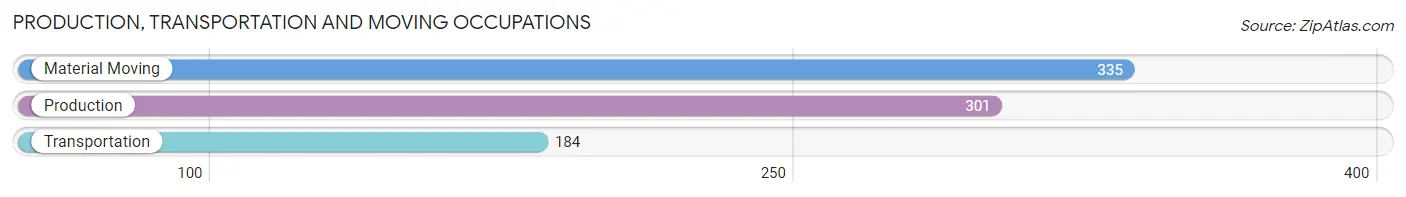
Production, Transportation and Moving Occupations
The most common Production, Transportation and Moving occupations in Perry County are Material Moving (335 | 8.3%), Production (301 | 7.5%), and Transportation (184 | 4.6%).
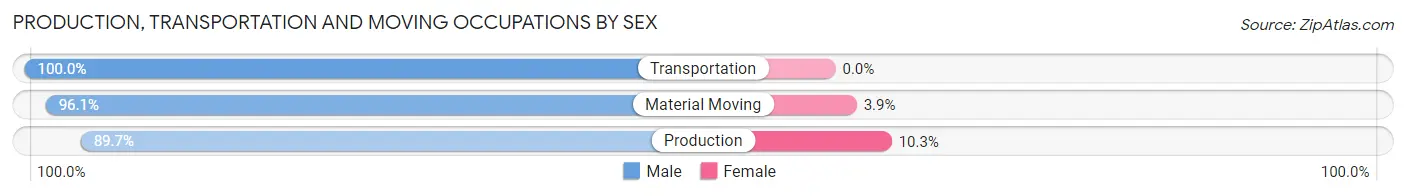
Production, Transportation and Moving Occupations by Sex
| Occupation | Male | Female |
| Production | 270 (89.7%) | 31 (10.3%) |
| Transportation | 184 (100.0%) | 0 (0.0%) |
| Material Moving | 322 (96.1%) | 13 (3.9%) |
| Total (Category) | 776 (94.6%) | 44 (5.4%) |
| Total (Overall) | 2,355 (58.6%) | 1,664 (41.4%) |
Employment Industries by Sex in Perry County
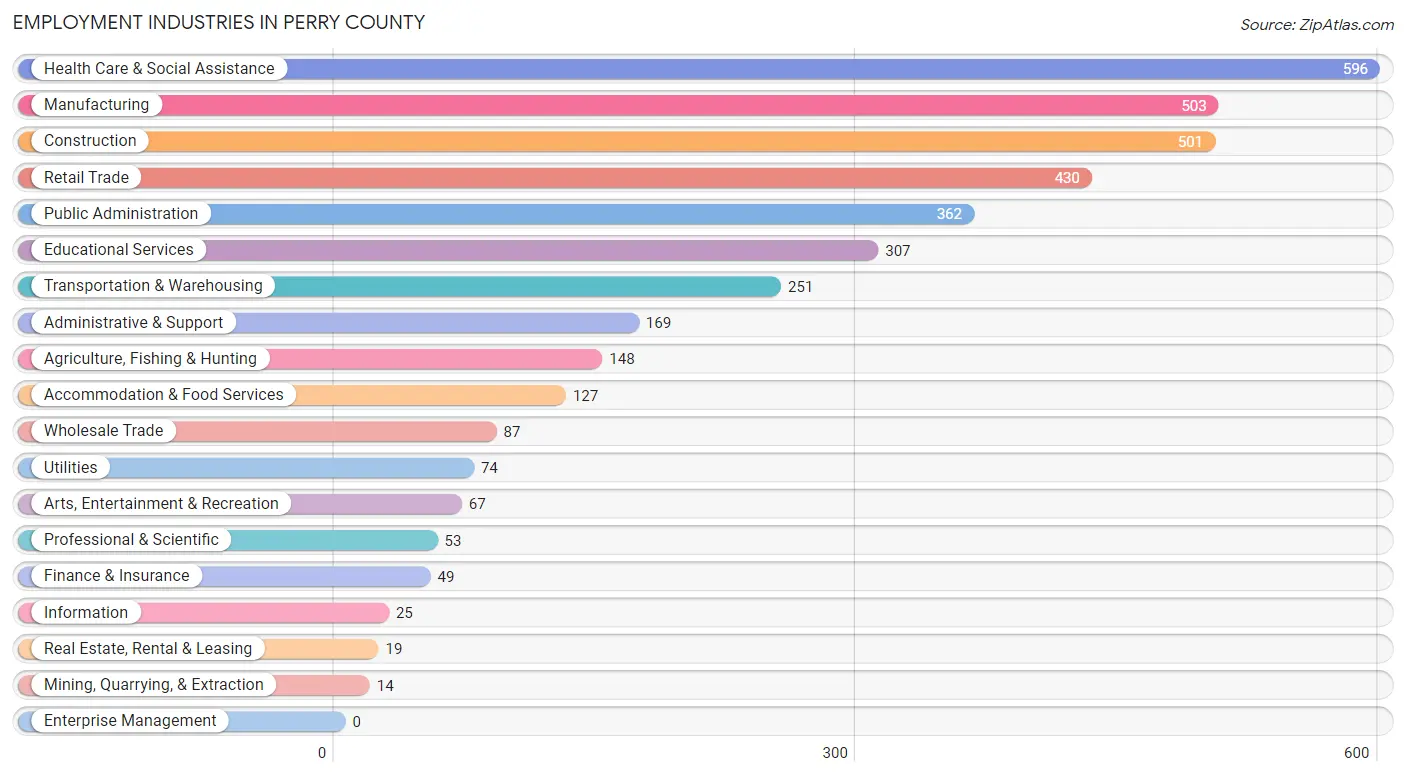
Employment Industries in Perry County
The major employment industries in Perry County include Health Care & Social Assistance (596 | 14.8%), Manufacturing (503 | 12.5%), Construction (501 | 12.5%), Retail Trade (430 | 10.7%), and Public Administration (362 | 9.0%).
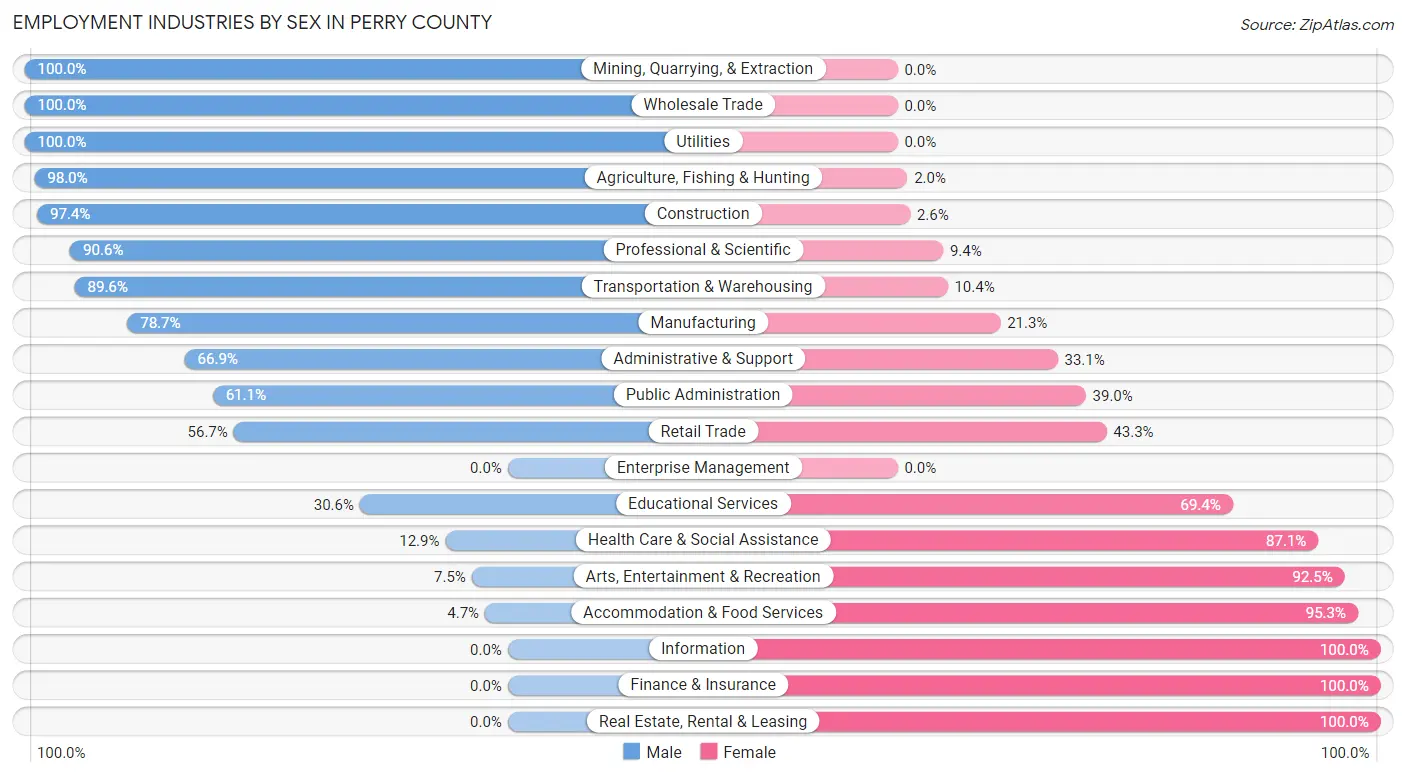
Employment Industries by Sex in Perry County
The Perry County industries that see more men than women are Mining, Quarrying, & Extraction (100.0%), Wholesale Trade (100.0%), and Utilities (100.0%), whereas the industries that tend to have a higher number of women are Information (100.0%), Finance & Insurance (100.0%), and Real Estate, Rental & Leasing (100.0%).
| Industry | Male | Female |
| Agriculture, Fishing & Hunting | 145 (98.0%) | 3 (2.0%) |
| Mining, Quarrying, & Extraction | 14 (100.0%) | 0 (0.0%) |
| Construction | 488 (97.4%) | 13 (2.6%) |
| Manufacturing | 396 (78.7%) | 107 (21.3%) |
| Wholesale Trade | 87 (100.0%) | 0 (0.0%) |
| Retail Trade | 244 (56.7%) | 186 (43.3%) |
| Transportation & Warehousing | 225 (89.6%) | 26 (10.4%) |
| Utilities | 74 (100.0%) | 0 (0.0%) |
| Information | 0 (0.0%) | 25 (100.0%) |
| Finance & Insurance | 0 (0.0%) | 49 (100.0%) |
| Real Estate, Rental & Leasing | 0 (0.0%) | 19 (100.0%) |
| Professional & Scientific | 48 (90.6%) | 5 (9.4%) |
| Enterprise Management | 0 (0.0%) | 0 (0.0%) |
| Administrative & Support | 113 (66.9%) | 56 (33.1%) |
| Educational Services | 94 (30.6%) | 213 (69.4%) |
| Health Care & Social Assistance | 77 (12.9%) | 519 (87.1%) |
| Arts, Entertainment & Recreation | 5 (7.5%) | 62 (92.5%) |
| Accommodation & Food Services | 6 (4.7%) | 121 (95.3%) |
| Public Administration | 221 (61.1%) | 141 (39.0%) |
| Total | 2,355 (58.6%) | 1,664 (41.4%) |
Education in Perry County
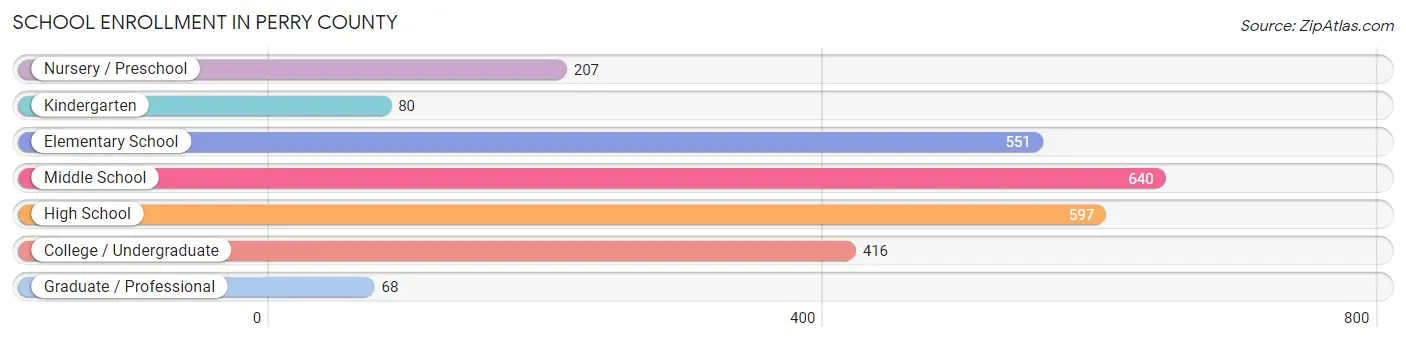
School Enrollment in Perry County
The most common levels of schooling among the 2,559 students in Perry County are middle school (640 | 25.0%), high school (597 | 23.3%), and elementary school (551 | 21.5%).
| School Level | # Students | % Students |
| Nursery / Preschool | 207 | 8.1% |
| Kindergarten | 80 | 3.1% |
| Elementary School | 551 | 21.5% |
| Middle School | 640 | 25.0% |
| High School | 597 | 23.3% |
| College / Undergraduate | 416 | 16.3% |
| Graduate / Professional | 68 | 2.7% |
| Total | 2,559 | 100.0% |
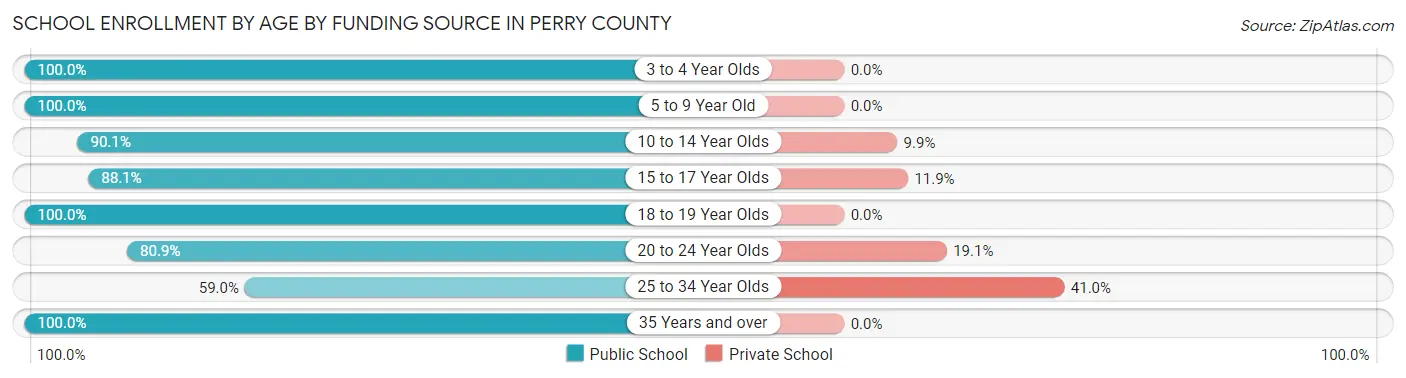
School Enrollment by Age by Funding Source in Perry County
Out of a total of 2,559 students who are enrolled in schools in Perry County, 233 (9.1%) attend a private institution, while the remaining 2,326 (90.9%) are enrolled in public schools. The age group of 25 to 34 year olds has the highest likelihood of being enrolled in private schools, with 73 (41.0% in the age bracket) enrolled. Conversely, the age group of 3 to 4 year olds has the lowest likelihood of being enrolled in a private school, with 191 (100.0% in the age bracket) attending a public institution.
| Age Bracket | Public School | Private School |
| 3 to 4 Year Olds | 191 (100.0%) | 0 (0.0%) |
| 5 to 9 Year Old | 445 (100.0%) | 0 (0.0%) |
| 10 to 14 Year Olds | 840 (90.1%) | 92 (9.9%) |
| 15 to 17 Year Olds | 371 (88.1%) | 50 (11.9%) |
| 18 to 19 Year Olds | 277 (100.0%) | 0 (0.0%) |
| 20 to 24 Year Olds | 72 (80.9%) | 17 (19.1%) |
| 25 to 34 Year Olds | 105 (59.0%) | 73 (41.0%) |
| 35 Years and over | 26 (100.0%) | 0 (0.0%) |
| Total | 2,326 (90.9%) | 233 (9.1%) |
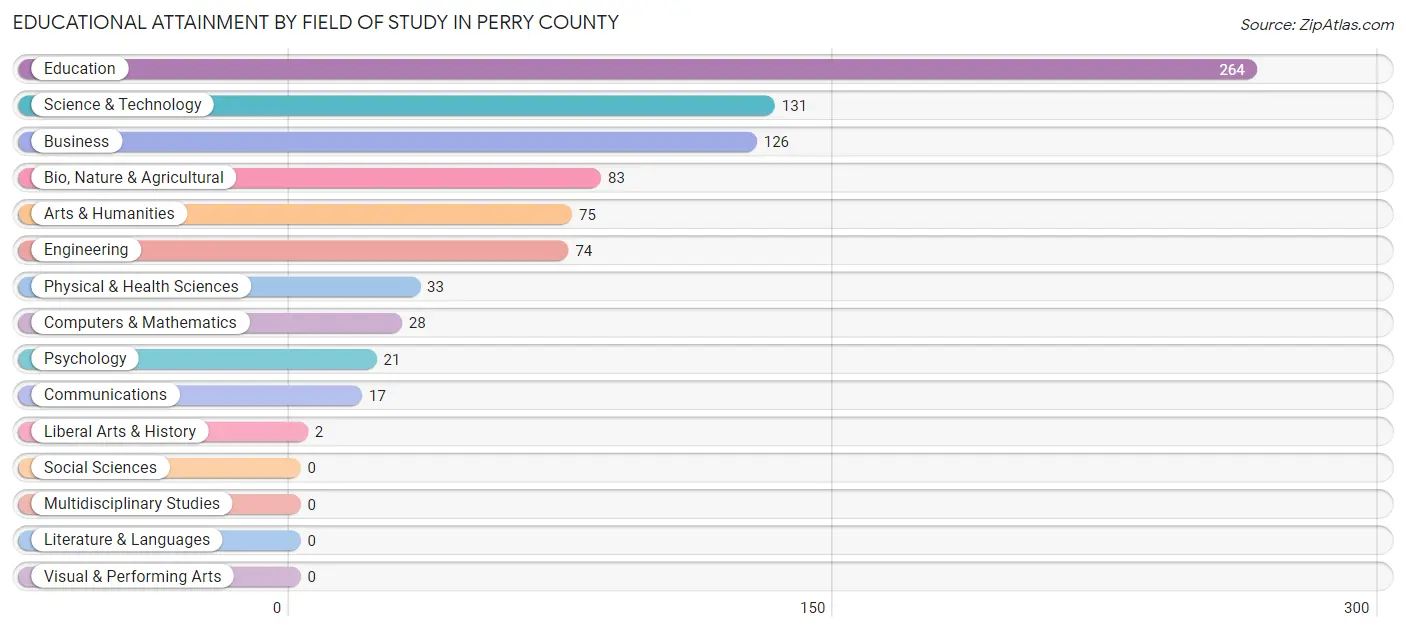
Educational Attainment by Field of Study in Perry County
Education (264 | 30.9%), science & technology (131 | 15.3%), business (126 | 14.7%), bio, nature & agricultural (83 | 9.7%), and arts & humanities (75 | 8.8%) are the most common fields of study among 854 individuals in Perry County who have obtained a bachelor's degree or higher.
| Field of Study | # Graduates | % Graduates |
| Computers & Mathematics | 28 | 3.3% |
| Bio, Nature & Agricultural | 83 | 9.7% |
| Physical & Health Sciences | 33 | 3.9% |
| Psychology | 21 | 2.5% |
| Social Sciences | 0 | 0.0% |
| Engineering | 74 | 8.7% |
| Multidisciplinary Studies | 0 | 0.0% |
| Science & Technology | 131 | 15.3% |
| Business | 126 | 14.7% |
| Education | 264 | 30.9% |
| Literature & Languages | 0 | 0.0% |
| Liberal Arts & History | 2 | 0.2% |
| Visual & Performing Arts | 0 | 0.0% |
| Communications | 17 | 2.0% |
| Arts & Humanities | 75 | 8.8% |
| Total | 854 | 100.0% |
Transportation & Commute in Perry County
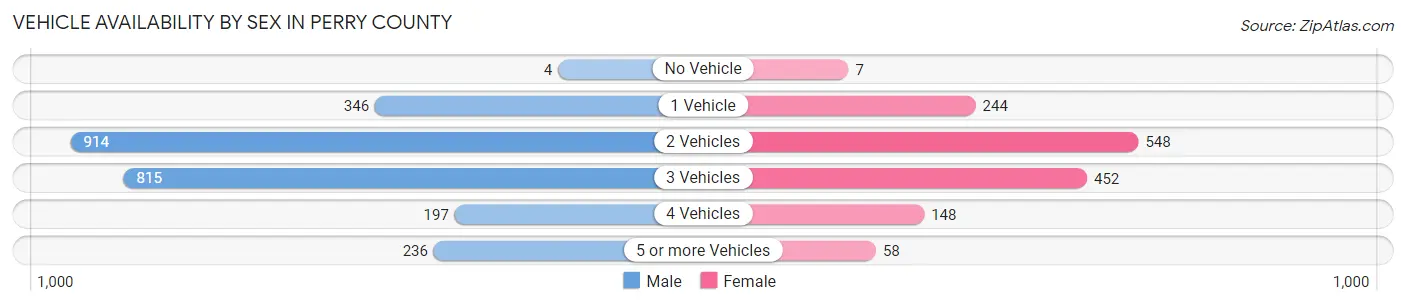
Vehicle Availability by Sex in Perry County
The most prevalent vehicle ownership categories in Perry County are males with 2 vehicles (914, accounting for 36.4%) and females with 2 vehicles (548, making up 62.7%).
| Vehicles Available | Male | Female |
| No Vehicle | 4 (0.2%) | 7 (0.5%) |
| 1 Vehicle | 346 (13.8%) | 244 (16.8%) |
| 2 Vehicles | 914 (36.4%) | 548 (37.6%) |
| 3 Vehicles | 815 (32.4%) | 452 (31.0%) |
| 4 Vehicles | 197 (7.8%) | 148 (10.2%) |
| 5 or more Vehicles | 236 (9.4%) | 58 (4.0%) |
| Total | 2,512 (100.0%) | 1,457 (100.0%) |
Commute Time in Perry County
The most frequently occuring commute durations in Perry County are 30 to 34 minutes (677 commuters, 17.1%), 5 to 9 minutes (507 commuters, 12.8%), and 20 to 24 minutes (491 commuters, 12.4%).
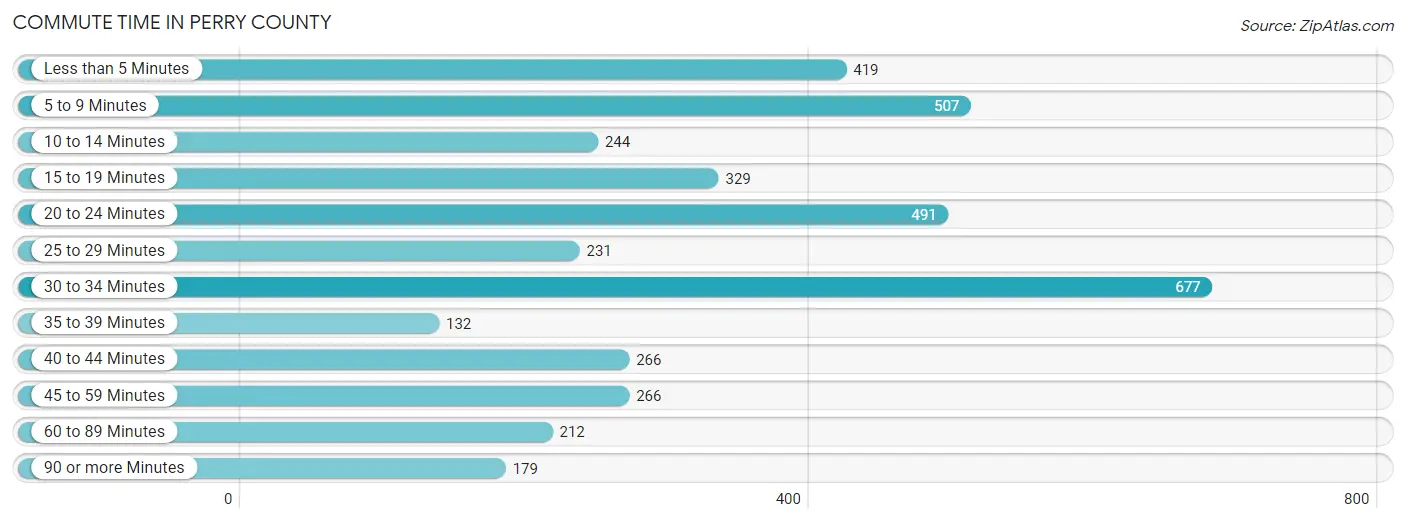
| Commute Time | # Commuters | % Commuters |
| Less than 5 Minutes | 419 | 10.6% |
| 5 to 9 Minutes | 507 | 12.8% |
| 10 to 14 Minutes | 244 | 6.2% |
| 15 to 19 Minutes | 329 | 8.3% |
| 20 to 24 Minutes | 491 | 12.4% |
| 25 to 29 Minutes | 231 | 5.8% |
| 30 to 34 Minutes | 677 | 17.1% |
| 35 to 39 Minutes | 132 | 3.3% |
| 40 to 44 Minutes | 266 | 6.7% |
| 45 to 59 Minutes | 266 | 6.7% |
| 60 to 89 Minutes | 212 | 5.4% |
| 90 or more Minutes | 179 | 4.5% |
Commute Time by Sex in Perry County
The most common commute times in Perry County are 30 to 34 minutes (453 commuters, 18.1%) for males and 30 to 34 minutes (224 commuters, 15.4%) for females.
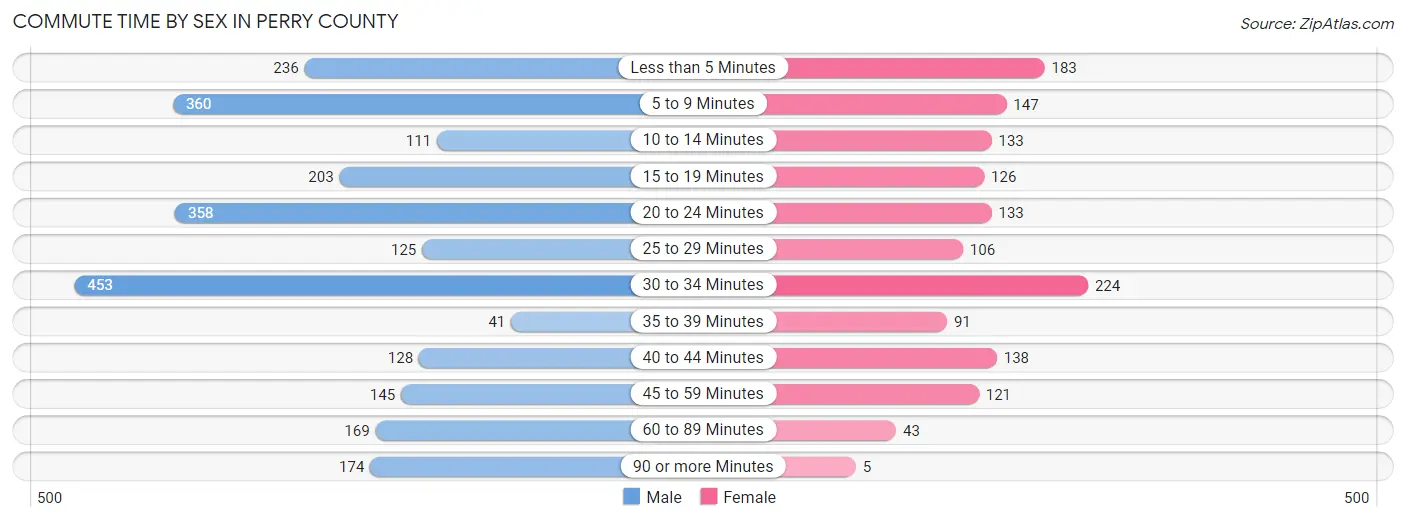
| Commute Time | Male | Female |
| Less than 5 Minutes | 236 (9.4%) | 183 (12.6%) |
| 5 to 9 Minutes | 360 (14.4%) | 147 (10.1%) |
| 10 to 14 Minutes | 111 (4.4%) | 133 (9.2%) |
| 15 to 19 Minutes | 203 (8.1%) | 126 (8.7%) |
| 20 to 24 Minutes | 358 (14.3%) | 133 (9.2%) |
| 25 to 29 Minutes | 125 (5.0%) | 106 (7.3%) |
| 30 to 34 Minutes | 453 (18.1%) | 224 (15.4%) |
| 35 to 39 Minutes | 41 (1.6%) | 91 (6.3%) |
| 40 to 44 Minutes | 128 (5.1%) | 138 (9.5%) |
| 45 to 59 Minutes | 145 (5.8%) | 121 (8.3%) |
| 60 to 89 Minutes | 169 (6.8%) | 43 (3.0%) |
| 90 or more Minutes | 174 (7.0%) | 5 (0.3%) |
Time of Departure to Work by Sex in Perry County
The most frequent times of departure to work in Perry County are 4:00 PM to 11:59 PM (429, 17.1%) for males and 7:00 AM to 7:29 AM (403, 27.8%) for females.
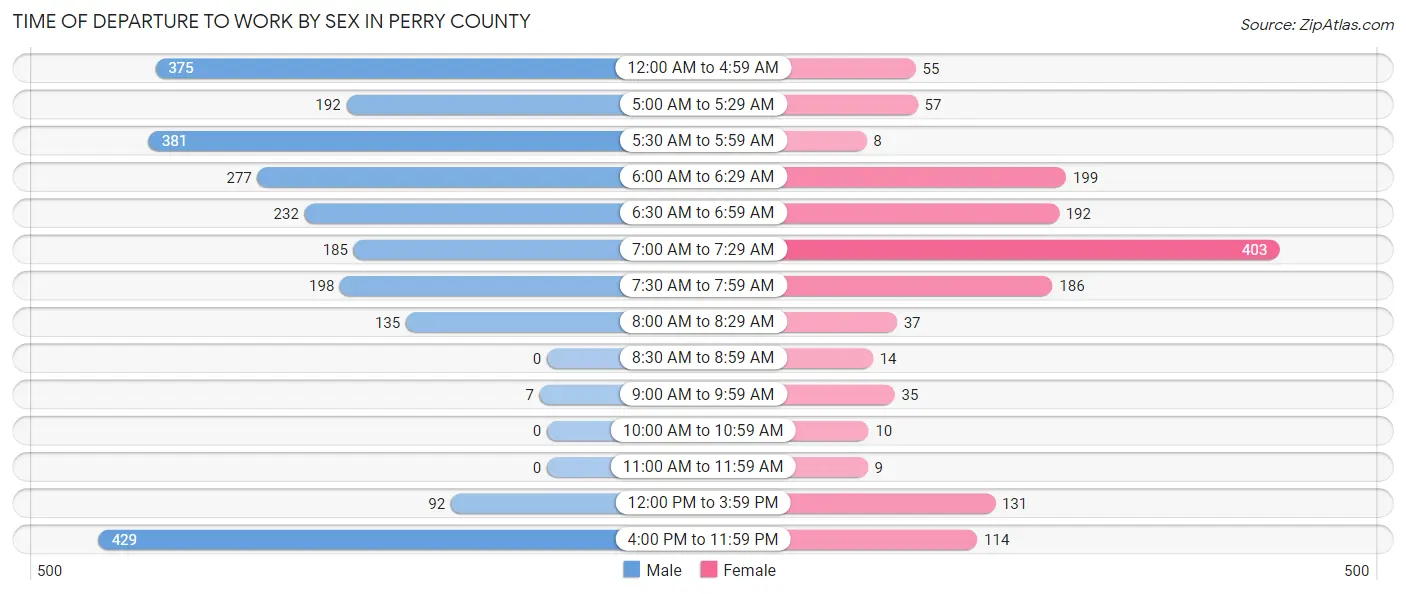
| Time of Departure | Male | Female |
| 12:00 AM to 4:59 AM | 375 (15.0%) | 55 (3.8%) |
| 5:00 AM to 5:29 AM | 192 (7.7%) | 57 (3.9%) |
| 5:30 AM to 5:59 AM | 381 (15.2%) | 8 (0.5%) |
| 6:00 AM to 6:29 AM | 277 (11.1%) | 199 (13.7%) |
| 6:30 AM to 6:59 AM | 232 (9.3%) | 192 (13.2%) |
| 7:00 AM to 7:29 AM | 185 (7.4%) | 403 (27.8%) |
| 7:30 AM to 7:59 AM | 198 (7.9%) | 186 (12.8%) |
| 8:00 AM to 8:29 AM | 135 (5.4%) | 37 (2.5%) |
| 8:30 AM to 8:59 AM | 0 (0.0%) | 14 (1.0%) |
| 9:00 AM to 9:59 AM | 7 (0.3%) | 35 (2.4%) |
| 10:00 AM to 10:59 AM | 0 (0.0%) | 10 (0.7%) |
| 11:00 AM to 11:59 AM | 0 (0.0%) | 9 (0.6%) |
| 12:00 PM to 3:59 PM | 92 (3.7%) | 131 (9.0%) |
| 4:00 PM to 11:59 PM | 429 (17.1%) | 114 (7.9%) |
| Total | 2,503 (100.0%) | 1,450 (100.0%) |
Housing Occupancy in Perry County
Occupancy by Ownership in Perry County
Of the total 4,462 dwellings in Perry County, owner-occupied units account for 3,573 (80.1%), while renter-occupied units make up 889 (19.9%).
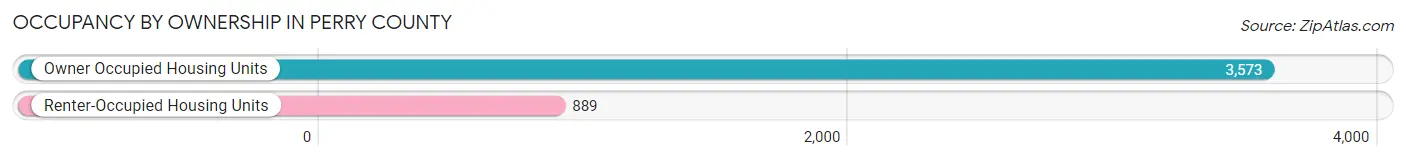
| Occupancy | # Housing Units | % Housing Units |
| Owner Occupied Housing Units | 3,573 | 80.1% |
| Renter-Occupied Housing Units | 889 | 19.9% |
| Total Occupied Housing Units | 4,462 | 100.0% |
Occupancy by Household Size in Perry County
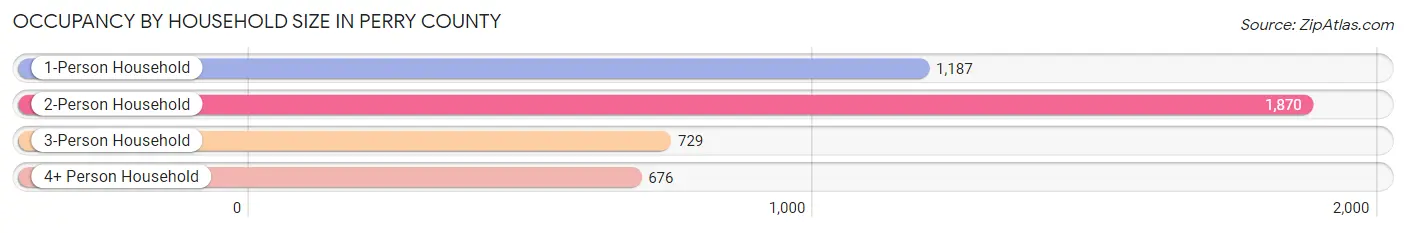
| Household Size | # Housing Units | % Housing Units |
| 1-Person Household | 1,187 | 26.6% |
| 2-Person Household | 1,870 | 41.9% |
| 3-Person Household | 729 | 16.3% |
| 4+ Person Household | 676 | 15.1% |
| Total Housing Units | 4,462 | 100.0% |
Occupancy by Ownership by Household Size in Perry County
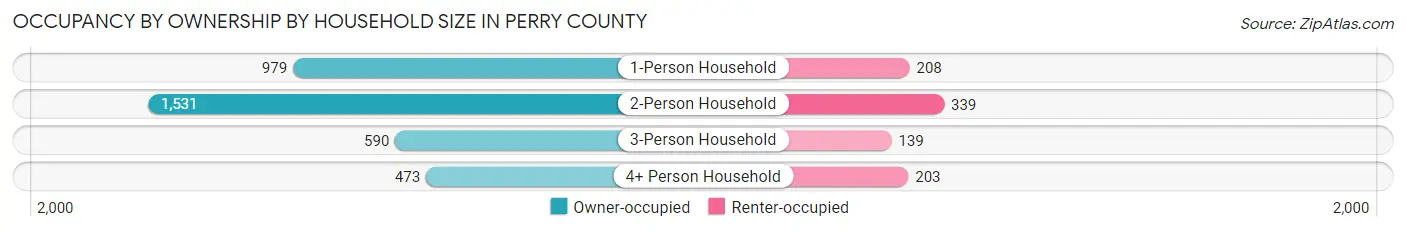
| Household Size | Owner-occupied | Renter-occupied |
| 1-Person Household | 979 (82.5%) | 208 (17.5%) |
| 2-Person Household | 1,531 (81.9%) | 339 (18.1%) |
| 3-Person Household | 590 (80.9%) | 139 (19.1%) |
| 4+ Person Household | 473 (70.0%) | 203 (30.0%) |
| Total Housing Units | 3,573 (80.1%) | 889 (19.9%) |
Occupancy by Educational Attainment in Perry County
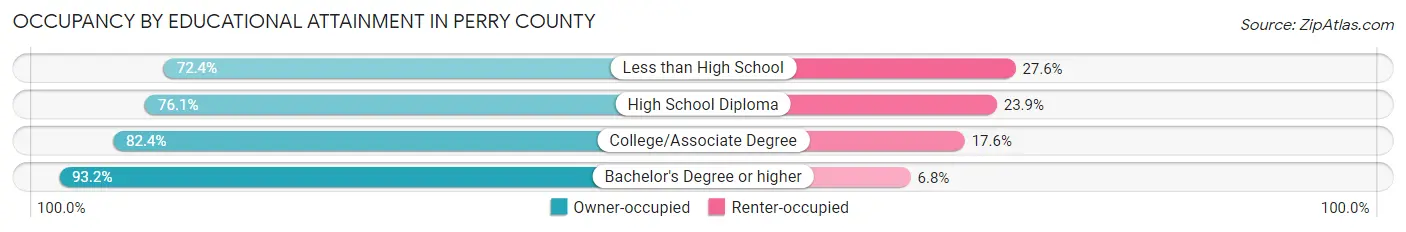
| Household Size | Owner-occupied | Renter-occupied |
| Less than High School | 430 (72.4%) | 164 (27.6%) |
| High School Diploma | 1,286 (76.1%) | 404 (23.9%) |
| College/Associate Degree | 1,324 (82.4%) | 282 (17.6%) |
| Bachelor's Degree or higher | 533 (93.2%) | 39 (6.8%) |
Occupancy by Age of Householder in Perry County
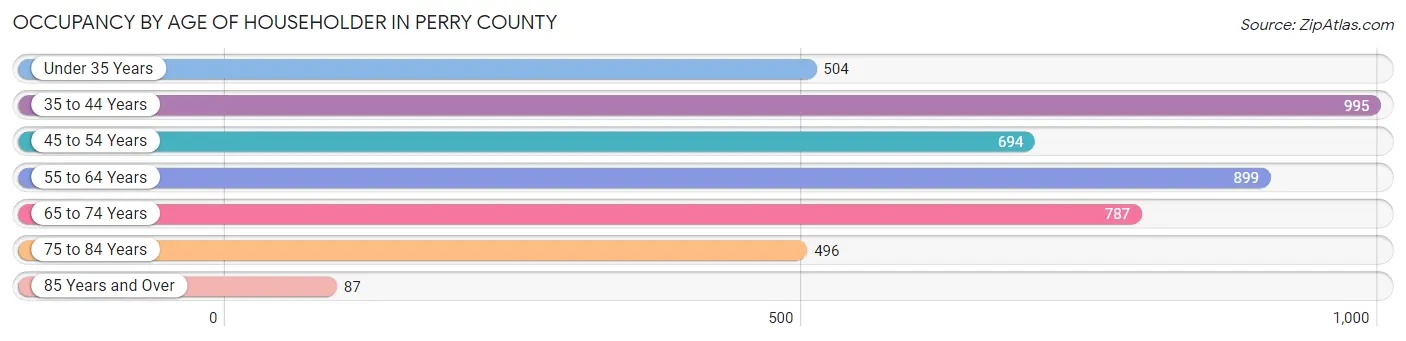
| Age Bracket | # Households | % Households |
| Under 35 Years | 504 | 11.3% |
| 35 to 44 Years | 995 | 22.3% |
| 45 to 54 Years | 694 | 15.5% |
| 55 to 64 Years | 899 | 20.2% |
| 65 to 74 Years | 787 | 17.6% |
| 75 to 84 Years | 496 | 11.1% |
| 85 Years and Over | 87 | 1.9% |
| Total | 4,462 | 100.0% |
Housing Finances in Perry County
Median Income by Occupancy in Perry County
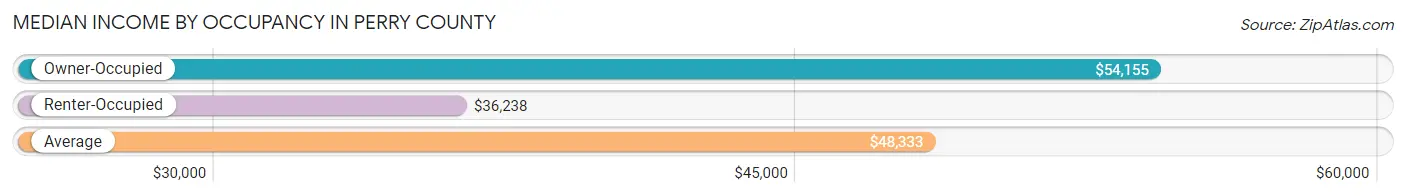
| Occupancy Type | # Households | Median Income |
| Owner-Occupied | 3,573 (80.1%) | $54,155 |
| Renter-Occupied | 889 (19.9%) | $36,238 |
| Average | 4,462 (100.0%) | $48,333 |
Occupancy by Householder Income Bracket in Perry County
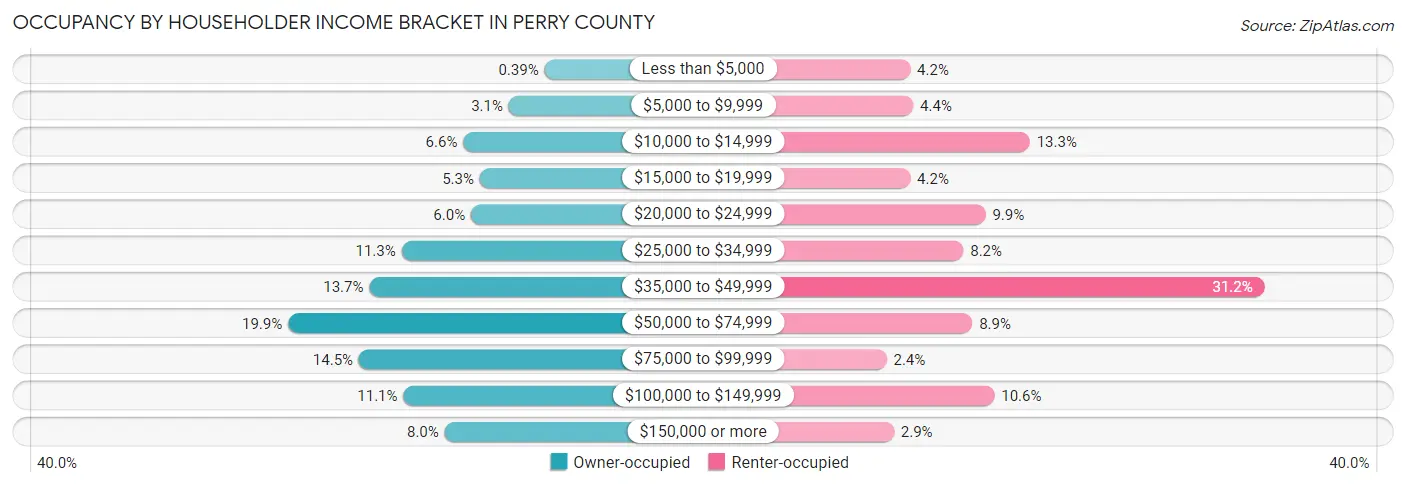
| Income Bracket | Owner-occupied | Renter-occupied |
| Less than $5,000 | 14 (0.4%) | 37 (4.2%) |
| $5,000 to $9,999 | 111 (3.1%) | 39 (4.4%) |
| $10,000 to $14,999 | 235 (6.6%) | 118 (13.3%) |
| $15,000 to $19,999 | 190 (5.3%) | 37 (4.2%) |
| $20,000 to $24,999 | 214 (6.0%) | 88 (9.9%) |
| $25,000 to $34,999 | 403 (11.3%) | 73 (8.2%) |
| $35,000 to $49,999 | 491 (13.7%) | 277 (31.2%) |
| $50,000 to $74,999 | 712 (19.9%) | 79 (8.9%) |
| $75,000 to $99,999 | 519 (14.5%) | 21 (2.4%) |
| $100,000 to $149,999 | 398 (11.1%) | 94 (10.6%) |
| $150,000 or more | 286 (8.0%) | 26 (2.9%) |
| Total | 3,573 (100.0%) | 889 (100.0%) |
Monthly Housing Cost Tiers in Perry County
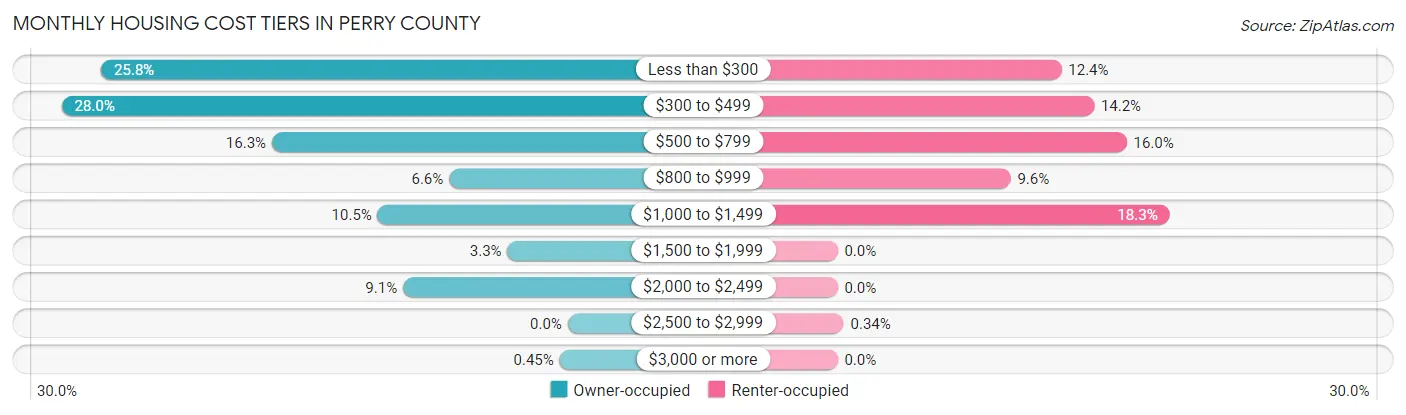
| Monthly Cost | Owner-occupied | Renter-occupied |
| Less than $300 | 921 (25.8%) | 110 (12.4%) |
| $300 to $499 | 999 (28.0%) | 126 (14.2%) |
| $500 to $799 | 584 (16.3%) | 142 (16.0%) |
| $800 to $999 | 234 (6.6%) | 85 (9.6%) |
| $1,000 to $1,499 | 375 (10.5%) | 163 (18.3%) |
| $1,500 to $1,999 | 119 (3.3%) | 0 (0.0%) |
| $2,000 to $2,499 | 325 (9.1%) | 0 (0.0%) |
| $2,500 to $2,999 | 0 (0.0%) | 3 (0.3%) |
| $3,000 or more | 16 (0.4%) | 0 (0.0%) |
| Total | 3,573 (100.0%) | 889 (100.0%) |
Physical Housing Characteristics in Perry County
Housing Structures in Perry County
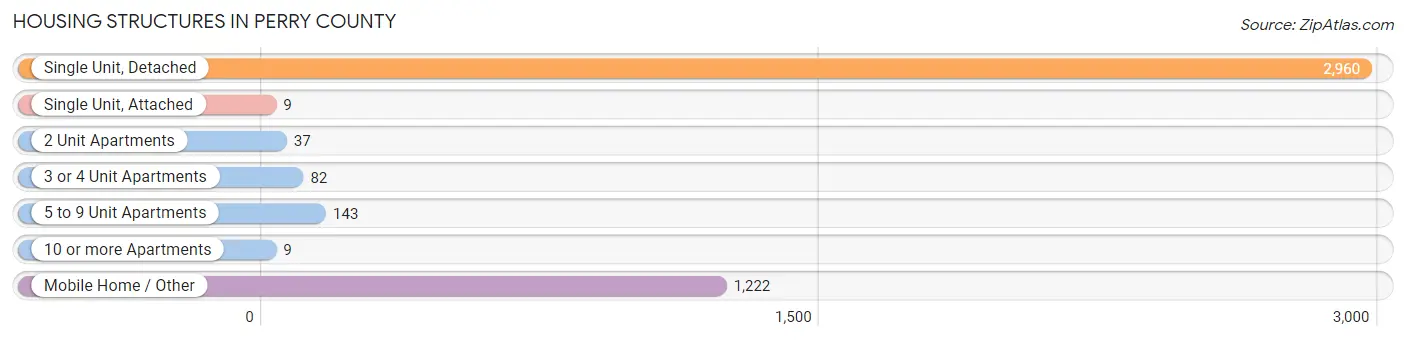
| Structure Type | # Housing Units | % Housing Units |
| Single Unit, Detached | 2,960 | 66.3% |
| Single Unit, Attached | 9 | 0.2% |
| 2 Unit Apartments | 37 | 0.8% |
| 3 or 4 Unit Apartments | 82 | 1.8% |
| 5 to 9 Unit Apartments | 143 | 3.2% |
| 10 or more Apartments | 9 | 0.2% |
| Mobile Home / Other | 1,222 | 27.4% |
| Total | 4,462 | 100.0% |
Housing Structures by Occupancy in Perry County
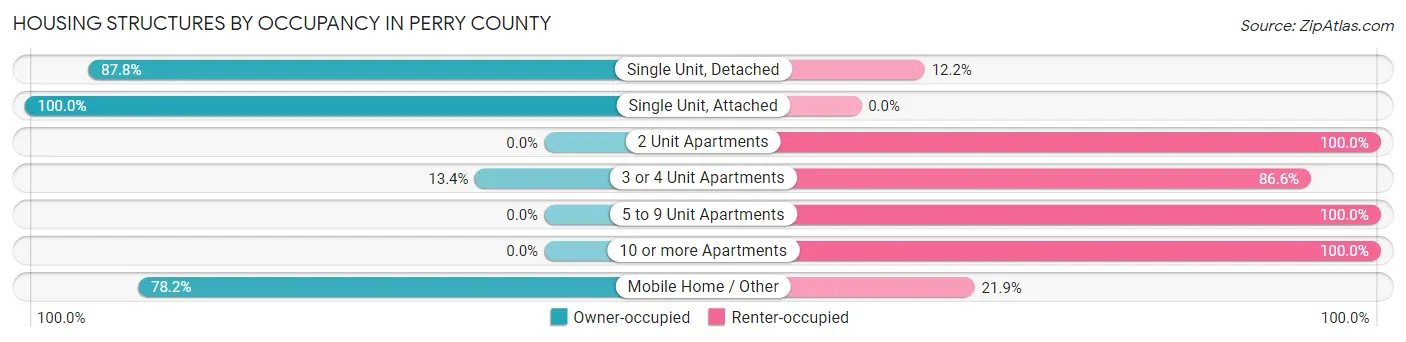
| Structure Type | Owner-occupied | Renter-occupied |
| Single Unit, Detached | 2,598 (87.8%) | 362 (12.2%) |
| Single Unit, Attached | 9 (100.0%) | 0 (0.0%) |
| 2 Unit Apartments | 0 (0.0%) | 37 (100.0%) |
| 3 or 4 Unit Apartments | 11 (13.4%) | 71 (86.6%) |
| 5 to 9 Unit Apartments | 0 (0.0%) | 143 (100.0%) |
| 10 or more Apartments | 0 (0.0%) | 9 (100.0%) |
| Mobile Home / Other | 955 (78.1%) | 267 (21.8%) |
| Total | 3,573 (80.1%) | 889 (19.9%) |
Housing Structures by Number of Rooms in Perry County
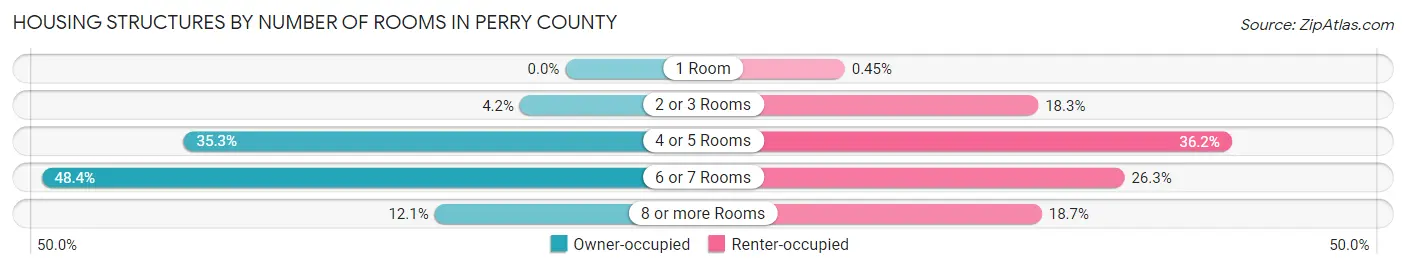
| Number of Rooms | Owner-occupied | Renter-occupied |
| 1 Room | 0 (0.0%) | 4 (0.4%) |
| 2 or 3 Rooms | 150 (4.2%) | 163 (18.3%) |
| 4 or 5 Rooms | 1,261 (35.3%) | 322 (36.2%) |
| 6 or 7 Rooms | 1,730 (48.4%) | 234 (26.3%) |
| 8 or more Rooms | 432 (12.1%) | 166 (18.7%) |
| Total | 3,573 (100.0%) | 889 (100.0%) |
Housing Structure by Heating Type in Perry County
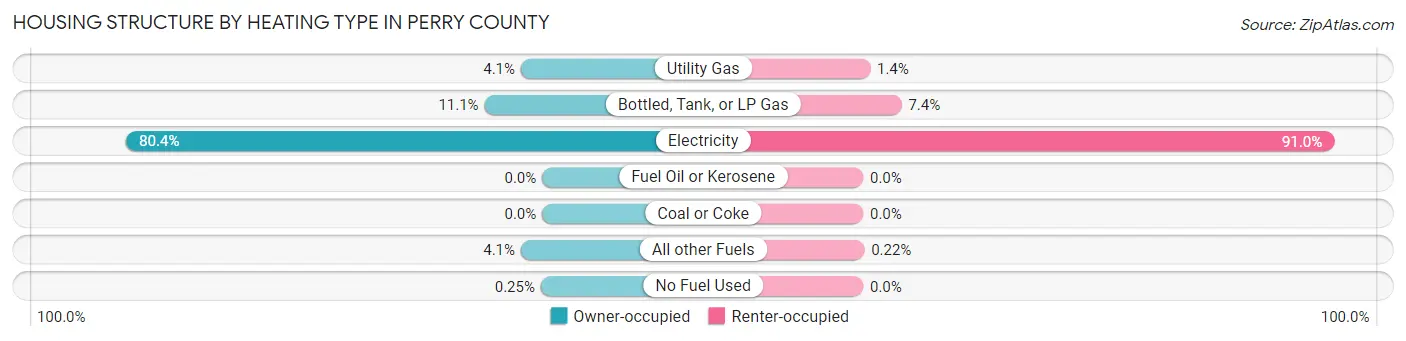
| Heating Type | Owner-occupied | Renter-occupied |
| Utility Gas | 147 (4.1%) | 12 (1.3%) |
| Bottled, Tank, or LP Gas | 398 (11.1%) | 66 (7.4%) |
| Electricity | 2,872 (80.4%) | 809 (91.0%) |
| Fuel Oil or Kerosene | 0 (0.0%) | 0 (0.0%) |
| Coal or Coke | 0 (0.0%) | 0 (0.0%) |
| All other Fuels | 147 (4.1%) | 2 (0.2%) |
| No Fuel Used | 9 (0.3%) | 0 (0.0%) |
| Total | 3,573 (100.0%) | 889 (100.0%) |
Household Vehicle Usage in Perry County
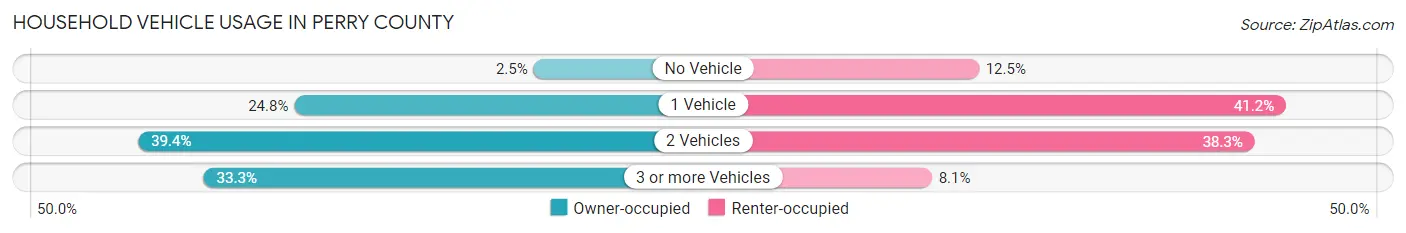
| Vehicles per Household | Owner-occupied | Renter-occupied |
| No Vehicle | 89 (2.5%) | 111 (12.5%) |
| 1 Vehicle | 887 (24.8%) | 366 (41.2%) |
| 2 Vehicles | 1,408 (39.4%) | 340 (38.3%) |
| 3 or more Vehicles | 1,189 (33.3%) | 72 (8.1%) |
| Total | 3,573 (100.0%) | 889 (100.0%) |
Real Estate & Mortgages in Perry County
Real Estate and Mortgage Overview in Perry County
| Characteristic | Without Mortgage | With Mortgage |
| Housing Units | 2,421 | 1,152 |
| Median Property Value | $89,500 | $195,700 |
| Median Household Income | $42,621 | $198 |
| Monthly Housing Costs | $336 | $0 |
| Real Estate Taxes | $570 | $259 |
Property Value by Mortgage Status in Perry County
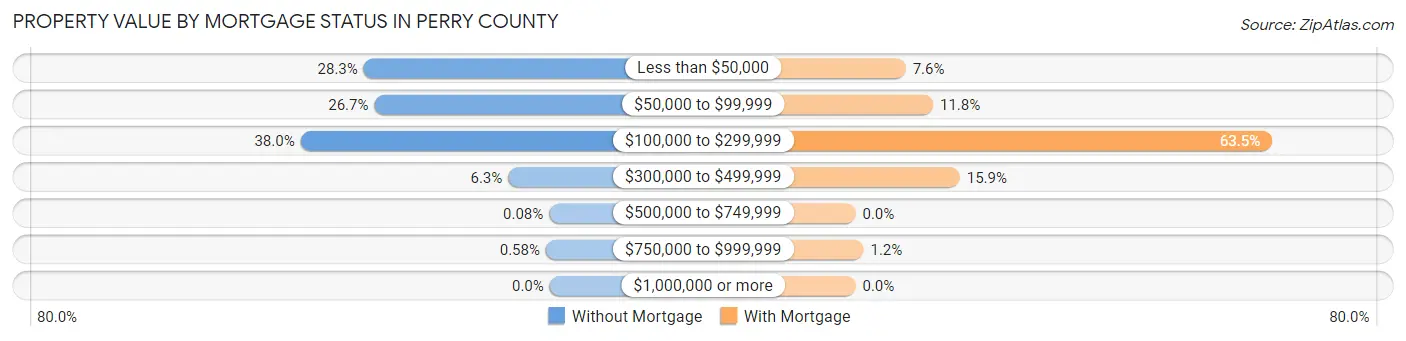
| Property Value | Without Mortgage | With Mortgage |
| Less than $50,000 | 686 (28.3%) | 88 (7.6%) |
| $50,000 to $99,999 | 647 (26.7%) | 136 (11.8%) |
| $100,000 to $299,999 | 919 (38.0%) | 731 (63.4%) |
| $300,000 to $499,999 | 153 (6.3%) | 183 (15.9%) |
| $500,000 to $749,999 | 2 (0.1%) | 0 (0.0%) |
| $750,000 to $999,999 | 14 (0.6%) | 14 (1.2%) |
| $1,000,000 or more | 0 (0.0%) | 0 (0.0%) |
| Total | 2,421 (100.0%) | 1,152 (100.0%) |
Household Income by Mortgage Status in Perry County
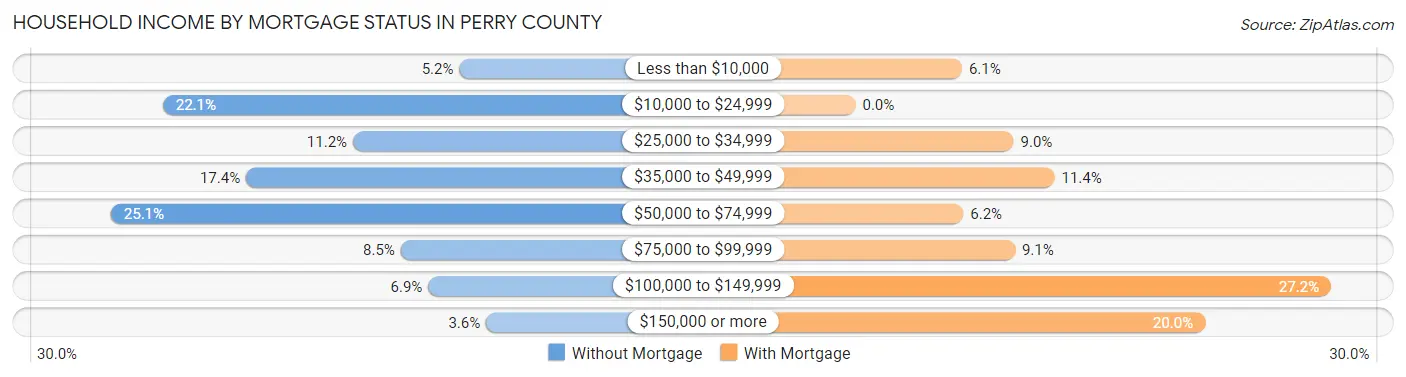
| Household Income | Without Mortgage | With Mortgage |
| Less than $10,000 | 125 (5.2%) | 70 (6.1%) |
| $10,000 to $24,999 | 535 (22.1%) | 0 (0.0%) |
| $25,000 to $34,999 | 272 (11.2%) | 104 (9.0%) |
| $35,000 to $49,999 | 420 (17.3%) | 131 (11.4%) |
| $50,000 to $74,999 | 607 (25.1%) | 71 (6.2%) |
| $75,000 to $99,999 | 206 (8.5%) | 105 (9.1%) |
| $100,000 to $149,999 | 168 (6.9%) | 313 (27.2%) |
| $150,000 or more | 88 (3.6%) | 230 (20.0%) |
| Total | 2,421 (100.0%) | 1,152 (100.0%) |
Property Value to Household Income Ratio in Perry County
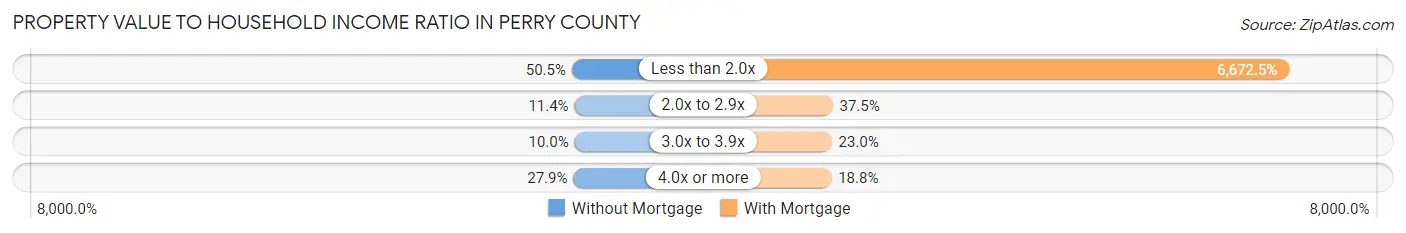
| Value-to-Income Ratio | Without Mortgage | With Mortgage |
| Less than 2.0x | 1,222 (50.5%) | 76,867 (6,672.5%) |
| 2.0x to 2.9x | 277 (11.4%) | 432 (37.5%) |
| 3.0x to 3.9x | 241 (10.0%) | 265 (23.0%) |
| 4.0x or more | 675 (27.9%) | 217 (18.8%) |
| Total | 2,421 (100.0%) | 1,152 (100.0%) |
Real Estate Taxes by Mortgage Status in Perry County
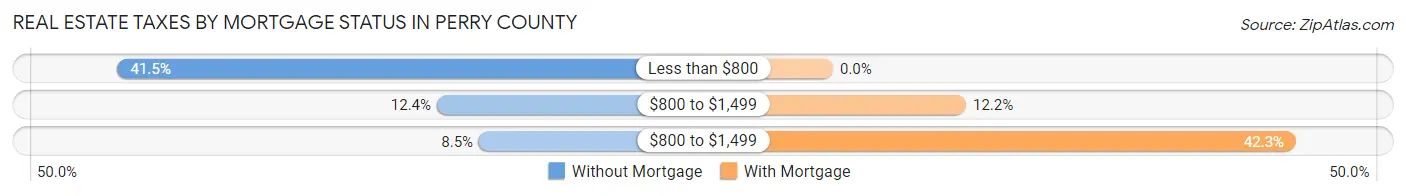
| Property Taxes | Without Mortgage | With Mortgage |
| Less than $800 | 1,005 (41.5%) | 0 (0.0%) |
| $800 to $1,499 | 299 (12.3%) | 140 (12.1%) |
| $800 to $1,499 | 206 (8.5%) | 487 (42.3%) |
| Total | 2,421 (100.0%) | 1,152 (100.0%) |
Health & Disability in Perry County
Health Insurance Coverage by Age in Perry County
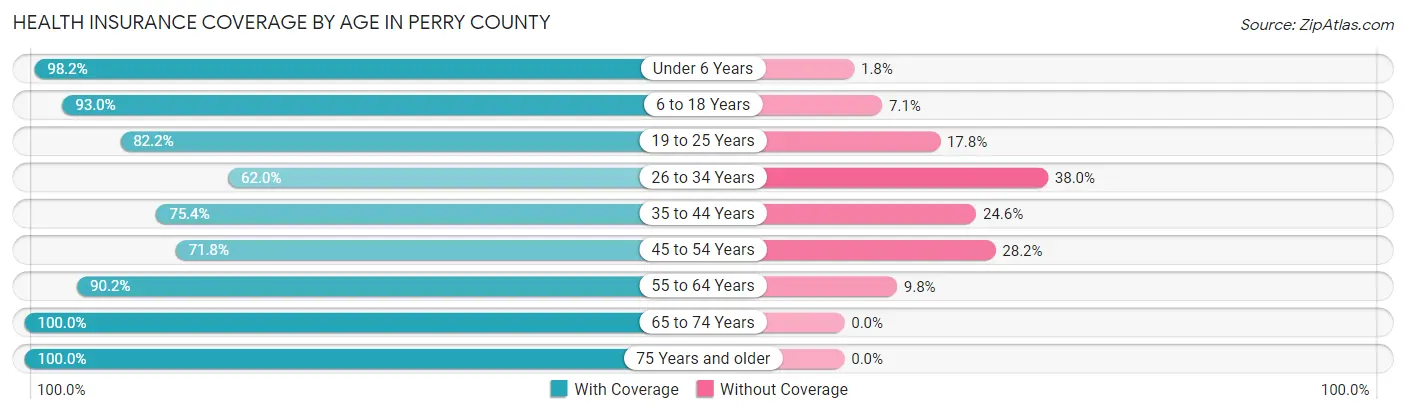
| Age Bracket | With Coverage | Without Coverage |
| Under 6 Years | 646 (98.2%) | 12 (1.8%) |
| 6 to 18 Years | 1,937 (92.9%) | 147 (7.0%) |
| 19 to 25 Years | 852 (82.2%) | 185 (17.8%) |
| 26 to 34 Years | 554 (62.0%) | 339 (38.0%) |
| 35 to 44 Years | 1,139 (75.4%) | 371 (24.6%) |
| 45 to 54 Years | 946 (71.8%) | 371 (28.2%) |
| 55 to 64 Years | 1,464 (90.2%) | 159 (9.8%) |
| 65 to 74 Years | 1,237 (100.0%) | 0 (0.0%) |
| 75 Years and older | 837 (100.0%) | 0 (0.0%) |
| Total | 9,612 (85.9%) | 1,584 (14.1%) |
Health Insurance Coverage by Citizenship Status in Perry County
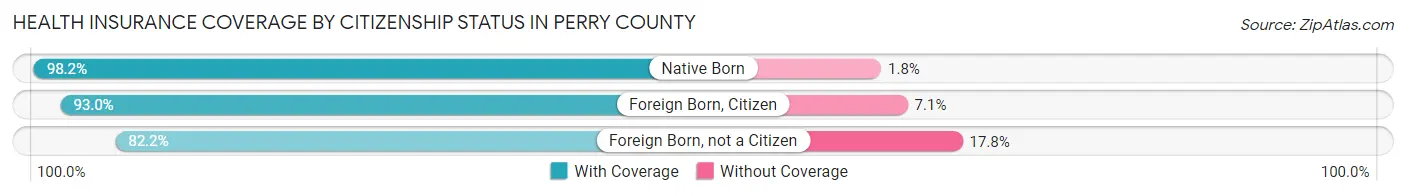
| Citizenship Status | With Coverage | Without Coverage |
| Native Born | 646 (98.2%) | 12 (1.8%) |
| Foreign Born, Citizen | 1,937 (92.9%) | 147 (7.0%) |
| Foreign Born, not a Citizen | 852 (82.2%) | 185 (17.8%) |
Health Insurance Coverage by Household Income in Perry County
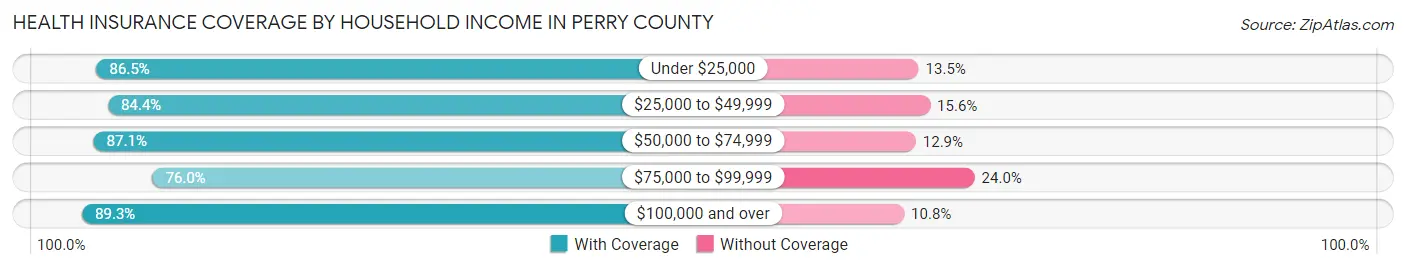
| Household Income | With Coverage | Without Coverage |
| Under $25,000 | 1,852 (86.5%) | 288 (13.5%) |
| $25,000 to $49,999 | 2,587 (84.4%) | 479 (15.6%) |
| $50,000 to $74,999 | 2,092 (87.1%) | 311 (12.9%) |
| $75,000 to $99,999 | 692 (76.0%) | 218 (24.0%) |
| $100,000 and over | 2,358 (89.2%) | 284 (10.7%) |
Public vs Private Health Insurance Coverage by Age in Perry County
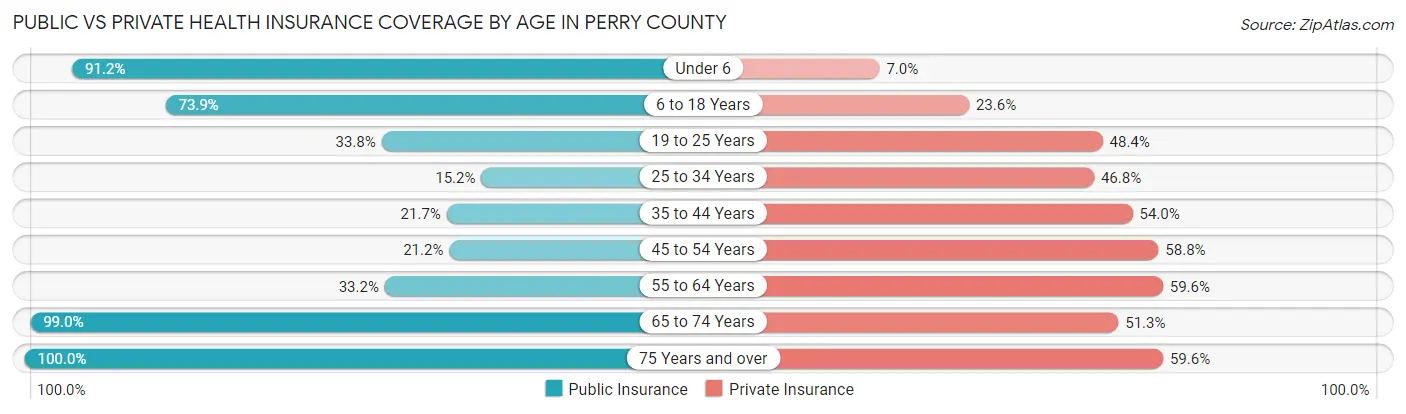
| Age Bracket | Public Insurance | Private Insurance |
| Under 6 | 600 (91.2%) | 46 (7.0%) |
| 6 to 18 Years | 1,539 (73.9%) | 492 (23.6%) |
| 19 to 25 Years | 350 (33.8%) | 502 (48.4%) |
| 25 to 34 Years | 136 (15.2%) | 418 (46.8%) |
| 35 to 44 Years | 327 (21.7%) | 815 (54.0%) |
| 45 to 54 Years | 279 (21.2%) | 774 (58.8%) |
| 55 to 64 Years | 538 (33.2%) | 967 (59.6%) |
| 65 to 74 Years | 1,224 (99.0%) | 635 (51.3%) |
| 75 Years and over | 837 (100.0%) | 499 (59.6%) |
| Total | 5,830 (52.1%) | 5,148 (46.0%) |
Disability Status by Sex by Age in Perry County
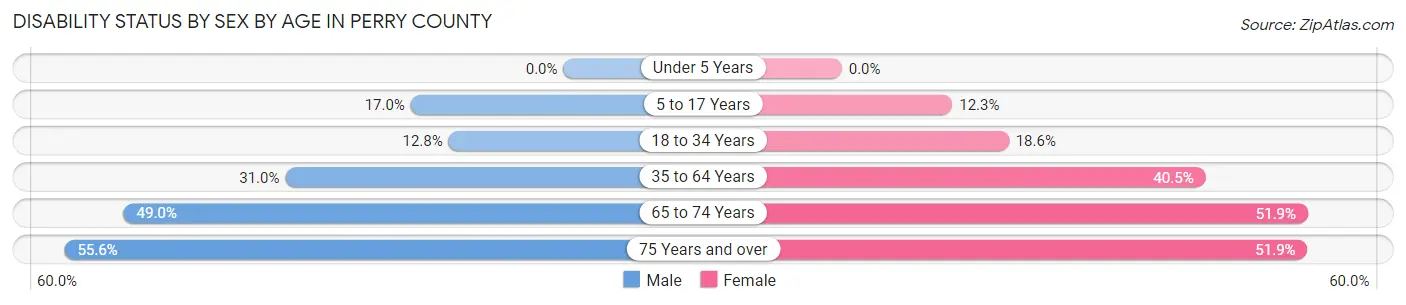
| Age Bracket | Male | Female |
| Under 5 Years | 0 (0.0%) | 0 (0.0%) |
| 5 to 17 Years | 203 (17.0%) | 96 (12.3%) |
| 18 to 34 Years | 125 (12.8%) | 213 (18.6%) |
| 35 to 64 Years | 664 (31.0%) | 934 (40.5%) |
| 65 to 74 Years | 284 (49.0%) | 341 (51.9%) |
| 75 Years and over | 210 (55.6%) | 238 (51.8%) |
Disability Class by Sex by Age in Perry County
Disability Class: Hearing Difficulty
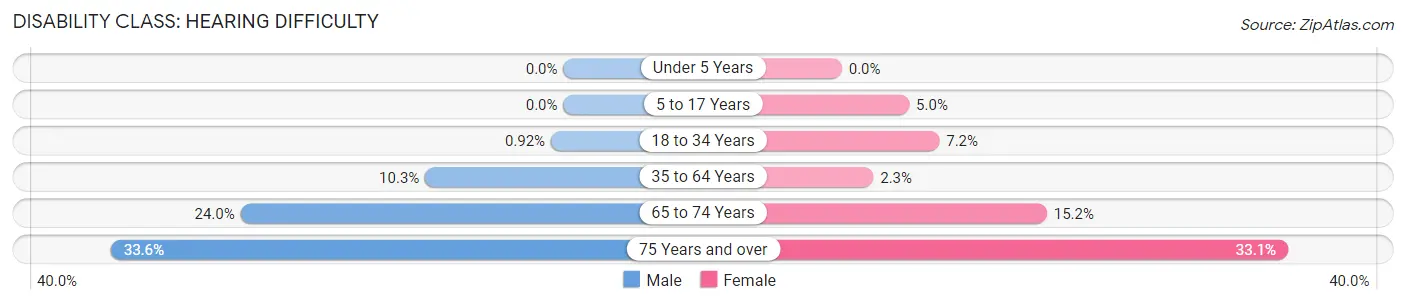
| Age Bracket | Male | Female |
| Under 5 Years | 0 (0.0%) | 0 (0.0%) |
| 5 to 17 Years | 0 (0.0%) | 39 (5.0%) |
| 18 to 34 Years | 9 (0.9%) | 83 (7.2%) |
| 35 to 64 Years | 220 (10.3%) | 54 (2.3%) |
| 65 to 74 Years | 139 (24.0%) | 100 (15.2%) |
| 75 Years and over | 127 (33.6%) | 152 (33.1%) |
Disability Class: Vision Difficulty
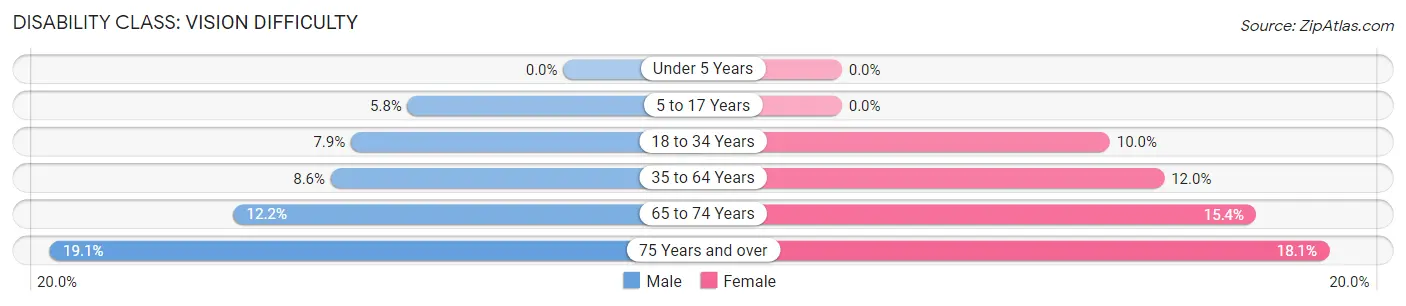
| Age Bracket | Male | Female |
| Under 5 Years | 0 (0.0%) | 0 (0.0%) |
| 5 to 17 Years | 69 (5.8%) | 0 (0.0%) |
| 18 to 34 Years | 77 (7.9%) | 114 (10.0%) |
| 35 to 64 Years | 185 (8.6%) | 276 (12.0%) |
| 65 to 74 Years | 71 (12.2%) | 101 (15.4%) |
| 75 Years and over | 72 (19.1%) | 83 (18.1%) |
Disability Class: Cognitive Difficulty
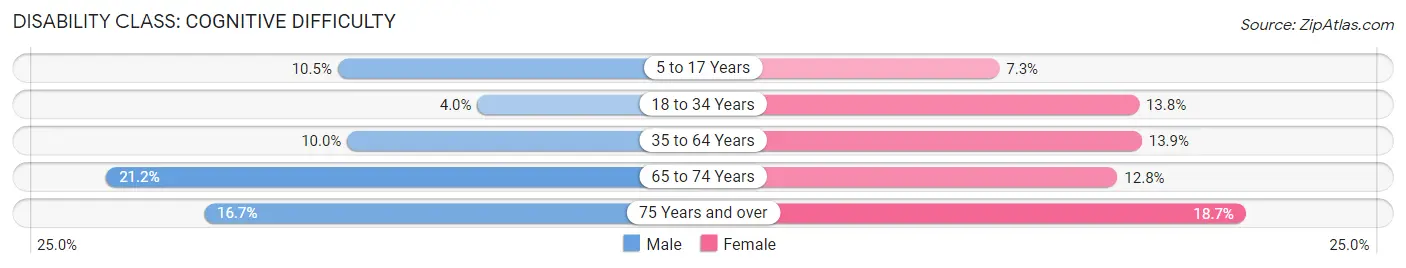
| Age Bracket | Male | Female |
| 5 to 17 Years | 125 (10.5%) | 57 (7.3%) |
| 18 to 34 Years | 39 (4.0%) | 158 (13.8%) |
| 35 to 64 Years | 215 (10.0%) | 321 (13.9%) |
| 65 to 74 Years | 123 (21.2%) | 84 (12.8%) |
| 75 Years and over | 63 (16.7%) | 86 (18.7%) |
Disability Class: Ambulatory Difficulty
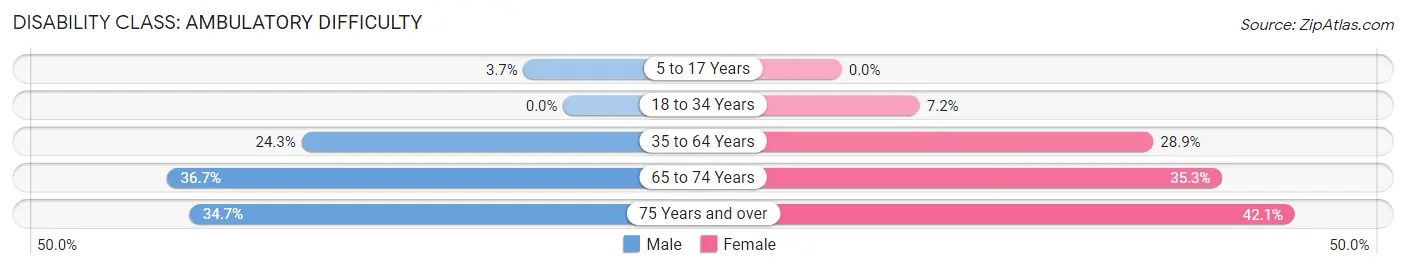
| Age Bracket | Male | Female |
| 5 to 17 Years | 44 (3.7%) | 0 (0.0%) |
| 18 to 34 Years | 0 (0.0%) | 83 (7.2%) |
| 35 to 64 Years | 521 (24.3%) | 667 (28.9%) |
| 65 to 74 Years | 213 (36.7%) | 232 (35.3%) |
| 75 Years and over | 131 (34.7%) | 193 (42.0%) |
Disability Class: Self-Care Difficulty
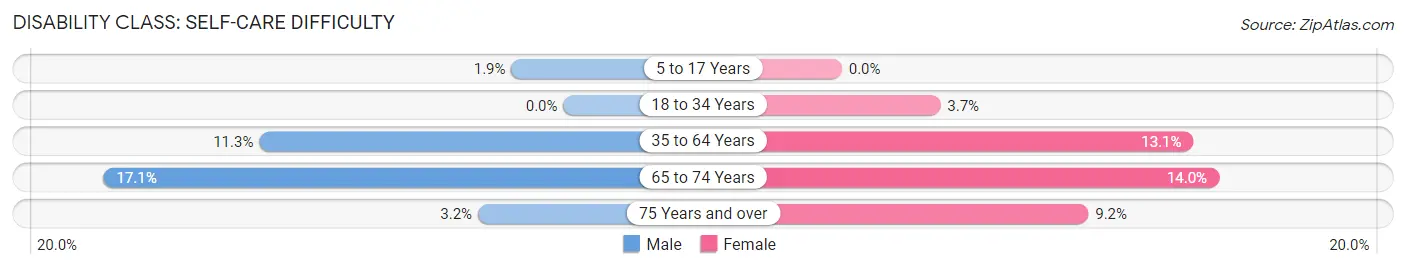
| Age Bracket | Male | Female |
| 5 to 17 Years | 23 (1.9%) | 0 (0.0%) |
| 18 to 34 Years | 0 (0.0%) | 42 (3.7%) |
| 35 to 64 Years | 242 (11.3%) | 301 (13.1%) |
| 65 to 74 Years | 99 (17.1%) | 92 (14.0%) |
| 75 Years and over | 12 (3.2%) | 42 (9.1%) |
Technology Access in Perry County
Computing Device Access in Perry County
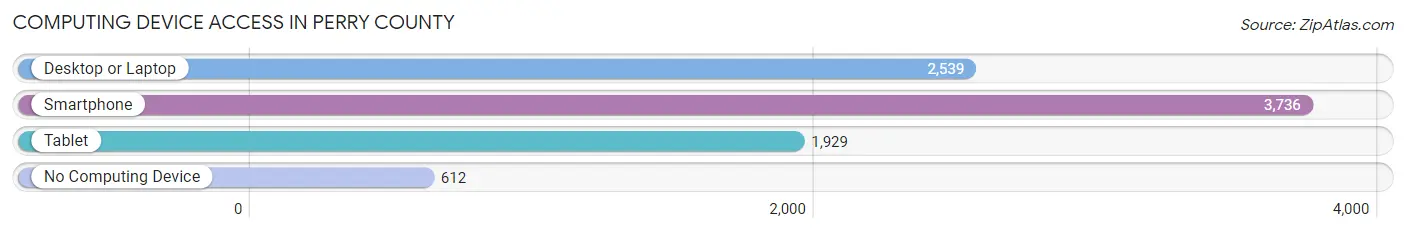
| Device Type | # Households | % Households |
| Desktop or Laptop | 2,539 | 56.9% |
| Smartphone | 3,736 | 83.7% |
| Tablet | 1,929 | 43.2% |
| No Computing Device | 612 | 13.7% |
| Total | 4,462 | 100.0% |
Internet Access in Perry County
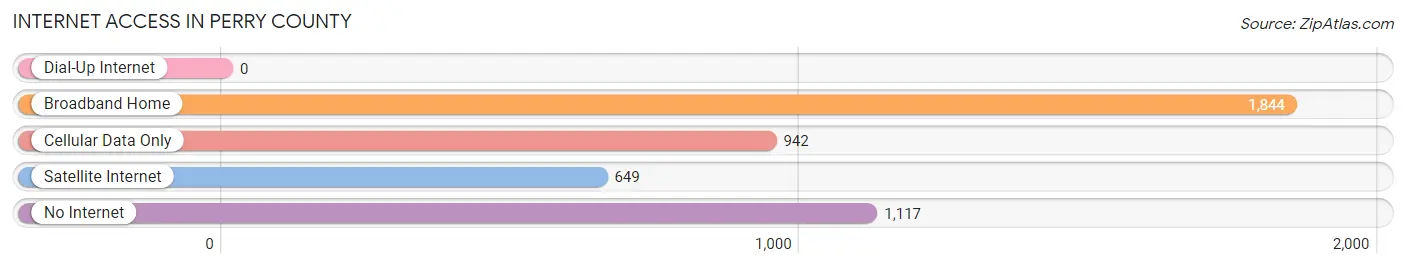
| Internet Type | # Households | % Households |
| Dial-Up Internet | 0 | 0.0% |
| Broadband Home | 1,844 | 41.3% |
| Cellular Data Only | 942 | 21.1% |
| Satellite Internet | 649 | 14.5% |
| No Internet | 1,117 | 25.0% |
| Total | 4,462 | 100.0% |
Perry County Summary
Perry County, Mississippi is located in the southeastern corner of the state, and is bordered by Greene County to the north, Stone County to the east, and Forrest County to the south. The county seat is New Augusta, and the county is home to a population of approximately 12,000 people.
History
Perry County was established in 1820, and was named after Commodore Oliver Hazard Perry, a hero of the War of 1812. The county was originally part of Greene County, and was created from parts of Greene, Stone, and Forrest Counties. The first settlers in the area were mostly of English and Scottish descent, and the county was largely agricultural.
During the Civil War, Perry County was a major site of conflict. The Battle of New Augusta was fought in the county in 1863, and the Battle of Fort Pemberton was fought in the county in 1864. After the war, the county was largely agricultural, and the economy was based on cotton production.
Geography
Perry County is located in the southeastern corner of Mississippi, and is bordered by Greene County to the north, Stone County to the east, and Forrest County to the south. The county is mostly rural, and is home to several small towns and villages, including New Augusta, Richton, Beaumont, and McLain. The county is mostly flat, with some rolling hills in the northern part of the county. The county is drained by the Leaf and Chickasawhay Rivers, and is home to several small lakes and ponds.
Economy
The economy of Perry County is largely based on agriculture. The county is home to several large farms, and the main crops grown in the county are cotton, soybeans, corn, and wheat. The county is also home to several small businesses, including restaurants, retail stores, and service providers.
Demographics
As of the 2010 census, Perry County had a population of 11,817 people. The racial makeup of the county was 79.3% White, 18.3% African American, 0.3% Native American, 0.2% Asian, 0.1% Pacific Islander, 0.7% from other races, and 1.2% from two or more races. Hispanic or Latino of any race were 1.7% of the population.
The median income for a household in the county was $30,945, and the median income for a family was $37,917. The per capita income for the county was $15,845. About 19.2% of the population was below the poverty line.
Common Questions
What is Per Capita Income in Perry County?
Per Capita income in Perry County is $24,935.
What is the Median Family Income in Perry County?
Median Family Income in Perry County is $49,703.
What is the Median Household income in Perry County?
Median Household Income in Perry County is $48,333.
What is Income or Wage Gap in Perry County?
Income or Wage Gap in Perry County is 46.3%.
Women in Perry County earn 53.7 cents for every dollar earned by a man.
What is Family Income Deficit in Perry County?
Family Income Deficit in Perry County is $7,138.
Families that are below poverty line in Perry County earn $7,138 less on average than the poverty threshold level.
What is Inequality or Gini Index in Perry County?
Inequality or Gini Index in Perry County is 0.41.
What is the Total Population of Perry County?
Total Population of Perry County is 11,511.
What is the Total Male Population of Perry County?
Total Male Population of Perry County is 5,766.
What is the Total Female Population of Perry County?
Total Female Population of Perry County is 5,745.
What is the Ratio of Males per 100 Females in Perry County?
There are 100.37 Males per 100 Females in Perry County.
What is the Ratio of Females per 100 Males in Perry County?
There are 99.64 Females per 100 Males in Perry County.
What is the Median Population Age in Perry County?
Median Population Age in Perry County is 42.3 Years.
What is the Average Family Size in Perry County
Average Family Size in Perry County is 3.2 People.
What is the Average Household Size in Perry County
Average Household Size in Perry County is 2.5 People.
How Large is the Labor Force in Perry County?
There are 4,524 People in the Labor Forcein in Perry County.
What is the Percentage of People in the Labor Force in Perry County?
48.5% of People are in the Labor Force in Perry County.
What is the Unemployment Rate in Perry County?
Unemployment Rate in Perry County is 6.3%.