Greene County, MS Map & Demographics
Greene County Map
Greene County Overview
$18,257
PER CAPITA INCOME
$63,668
AVG FAMILY INCOME
$50,000
AVG HOUSEHOLD INCOME
47.9%
WAGE / INCOME GAP [ % ]
52.1¢/ $1
WAGE / INCOME GAP [ $ ]
0.47
INEQUALITY / GINI INDEX
13,672
TOTAL POPULATION
8,378
MALE POPULATION
5,294
FEMALE POPULATION
158.25
MALES / 100 FEMALES
63.19
FEMALES / 100 MALES
39.7
MEDIAN AGE
3.1
AVG FAMILY SIZE
2.5
AVG HOUSEHOLD SIZE
3,711
LABOR FORCE [ PEOPLE ]
32.2%
PERCENT IN LABOR FORCE
12.6%
UNEMPLOYMENT RATE
Income in Greene County
Income Overview in Greene County
Per Capita Income in Greene County is $18,257, while median incomes of families and households are $63,668 and $50,000 respectively.
| Characteristic | Number | Measure |
| Per Capita Income | 13,672 | $18,257 |
| Median Family Income | 2,714 | $63,668 |
| Mean Family Income | 2,714 | $77,533 |
| Median Household Income | 3,910 | $50,000 |
| Mean Household Income | 3,910 | $62,953 |
| Income Deficit | 2,714 | $0 |
| Wage / Income Gap (%) | 13,672 | 47.92% |
| Wage / Income Gap ($) | 13,672 | 52.08¢ per $1 |
| Gini / Inequality Index | 13,672 | 0.47 |
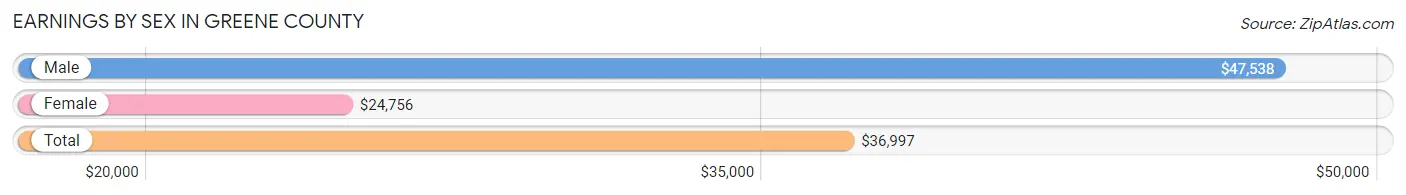
Earnings by Sex in Greene County
Average Earnings in Greene County are $36,997, $47,538 for men and $24,756 for women, a difference of 47.9%.
| Sex | Number | Average Earnings |
| Male | 2,239 (55.3%) | $47,538 |
| Female | 1,812 (44.7%) | $24,756 |
| Total | 4,051 (100.0%) | $36,997 |
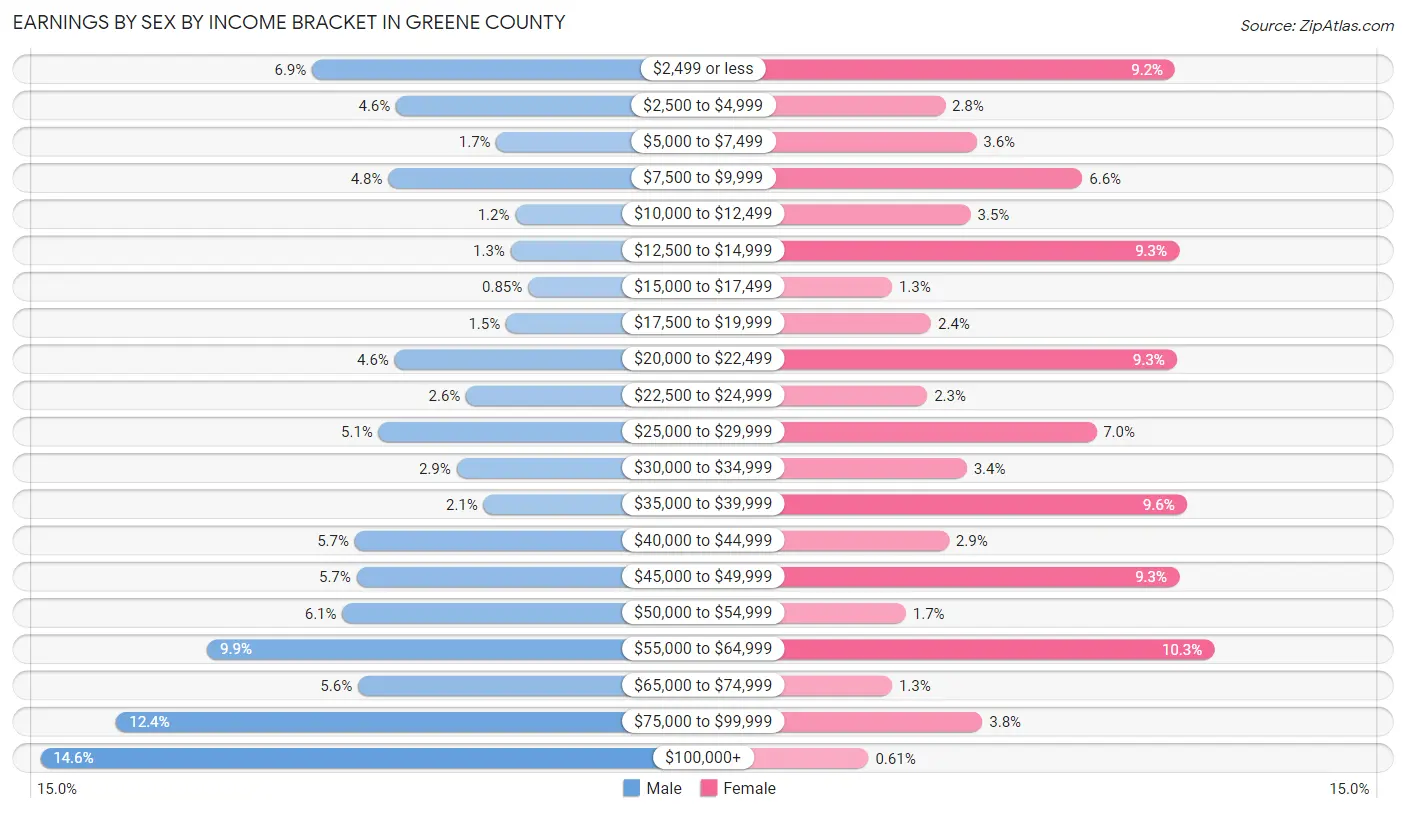
Earnings by Sex by Income Bracket in Greene County
The most common earnings brackets in Greene County are $100,000+ for men (326 | 14.6%) and $55,000 to $64,999 for women (187 | 10.3%).
| Income | Male | Female |
| $2,499 or less | 155 (6.9%) | 167 (9.2%) |
| $2,500 to $4,999 | 102 (4.6%) | 50 (2.8%) |
| $5,000 to $7,499 | 39 (1.7%) | 66 (3.6%) |
| $7,500 to $9,999 | 107 (4.8%) | 120 (6.6%) |
| $10,000 to $12,499 | 27 (1.2%) | 63 (3.5%) |
| $12,500 to $14,999 | 30 (1.3%) | 169 (9.3%) |
| $15,000 to $17,499 | 19 (0.9%) | 23 (1.3%) |
| $17,500 to $19,999 | 33 (1.5%) | 43 (2.4%) |
| $20,000 to $22,499 | 103 (4.6%) | 168 (9.3%) |
| $22,500 to $24,999 | 58 (2.6%) | 41 (2.3%) |
| $25,000 to $29,999 | 113 (5.1%) | 127 (7.0%) |
| $30,000 to $34,999 | 64 (2.9%) | 61 (3.4%) |
| $35,000 to $39,999 | 47 (2.1%) | 173 (9.6%) |
| $40,000 to $44,999 | 128 (5.7%) | 52 (2.9%) |
| $45,000 to $49,999 | 127 (5.7%) | 169 (9.3%) |
| $50,000 to $54,999 | 136 (6.1%) | 30 (1.7%) |
| $55,000 to $64,999 | 221 (9.9%) | 187 (10.3%) |
| $65,000 to $74,999 | 126 (5.6%) | 23 (1.3%) |
| $75,000 to $99,999 | 278 (12.4%) | 69 (3.8%) |
| $100,000+ | 326 (14.6%) | 11 (0.6%) |
| Total | 2,239 (100.0%) | 1,812 (100.0%) |
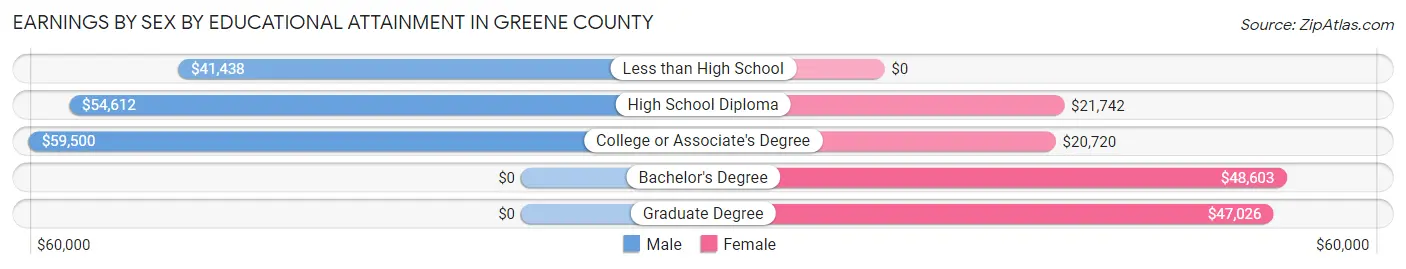
Earnings by Sex by Educational Attainment in Greene County
Average earnings in Greene County are $54,261 for men and $26,172 for women, a difference of 51.8%. Men with an educational attainment of college or associate's degree enjoy the highest average annual earnings of $59,500, while those with less than high school education earn the least with $41,438. Women with an educational attainment of bachelor's degree earn the most with the average annual earnings of $48,603, while those with college or associate's degree education have the smallest earnings of $20,720.
| Educational Attainment | Male Income | Female Income |
| Less than High School | $41,438 | $0 |
| High School Diploma | $54,612 | $21,742 |
| College or Associate's Degree | $59,500 | $20,720 |
| Bachelor's Degree | - | - |
| Graduate Degree | - | - |
| Total | $54,261 | $26,172 |
Family Income in Greene County
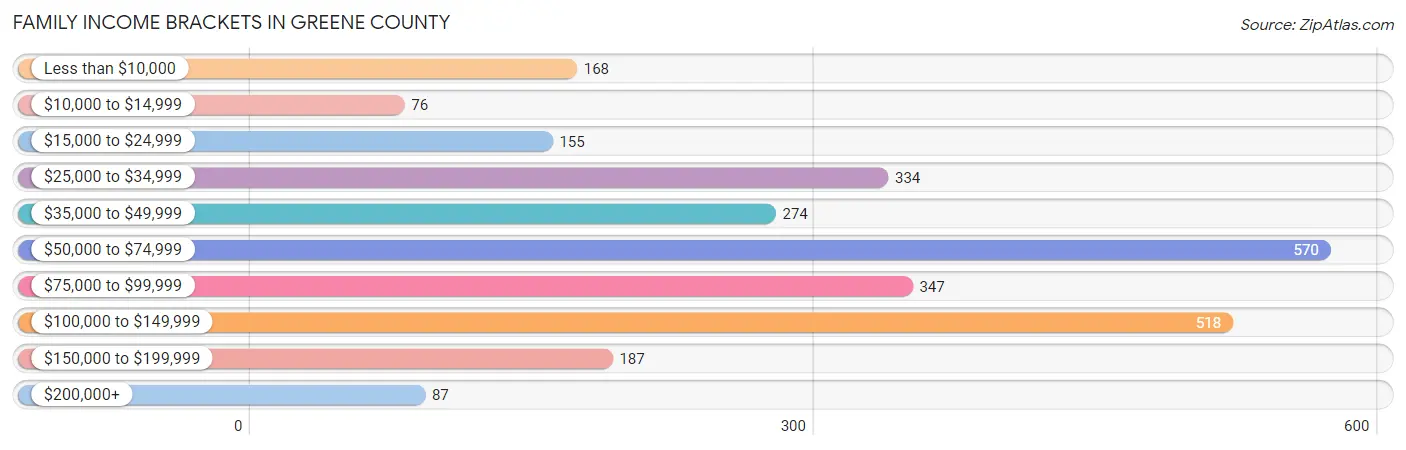
Family Income Brackets in Greene County
According to the Greene County family income data, there are 570 families falling into the $50,000 to $74,999 income range, which is the most common income bracket and makes up 21.0% of all families. Conversely, the $10,000 to $14,999 income bracket is the least frequent group with only 76 families (2.8%) belonging to this category.
| Income Bracket | # Families | % Families |
| Less than $10,000 | 168 | 6.2% |
| $10,000 to $14,999 | 76 | 2.8% |
| $15,000 to $24,999 | 155 | 5.7% |
| $25,000 to $34,999 | 334 | 12.3% |
| $35,000 to $49,999 | 274 | 10.1% |
| $50,000 to $74,999 | 570 | 21.0% |
| $75,000 to $99,999 | 347 | 12.8% |
| $100,000 to $149,999 | 518 | 19.1% |
| $150,000 to $199,999 | 187 | 6.9% |
| $200,000+ | 87 | 3.2% |
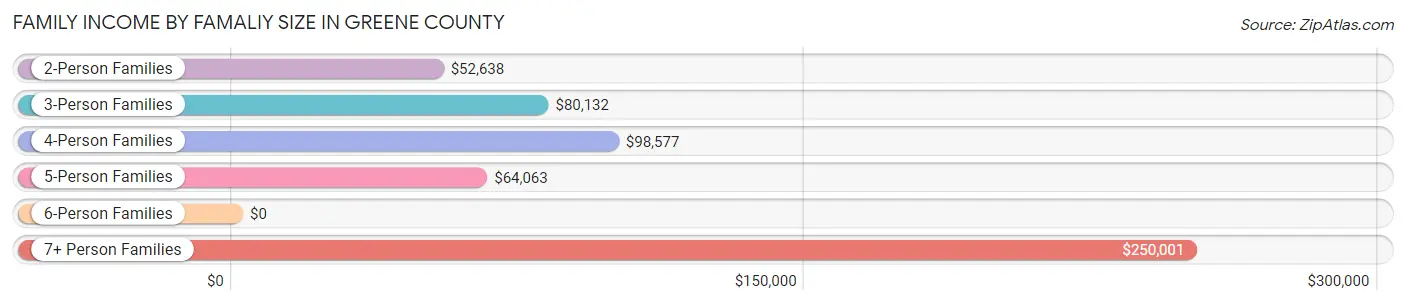
Family Income by Famaliy Size in Greene County
7+ person families (51 | 1.9%) account for the highest median family income in Greene County with $250,001 per family, while 7+ person families (51 | 1.9%) have the highest median income of $35,714 per family member.
| Income Bracket | # Families | Median Income |
| 2-Person Families | 1,377 (50.7%) | $52,638 |
| 3-Person Families | 630 (23.2%) | $80,132 |
| 4-Person Families | 480 (17.7%) | $98,577 |
| 5-Person Families | 166 (6.1%) | $64,063 |
| 6-Person Families | 10 (0.4%) | $0 |
| 7+ Person Families | 51 (1.9%) | $250,001 |
| Total | 2,714 (100.0%) | $63,668 |
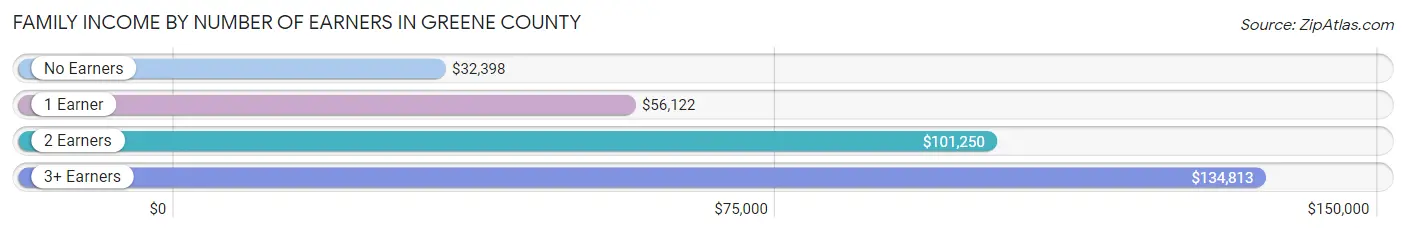
Family Income by Number of Earners in Greene County
The median family income in Greene County is $63,668, with families comprising 3+ earners (219) having the highest median family income of $134,813, while families with no earners (640) have the lowest median family income of $32,398, accounting for 8.1% and 23.6% of families, respectively.
| Number of Earners | # Families | Median Income |
| No Earners | 640 (23.6%) | $32,398 |
| 1 Earner | 1,019 (37.6%) | $56,122 |
| 2 Earners | 836 (30.8%) | $101,250 |
| 3+ Earners | 219 (8.1%) | $134,813 |
| Total | 2,714 (100.0%) | $63,668 |
Household Income in Greene County
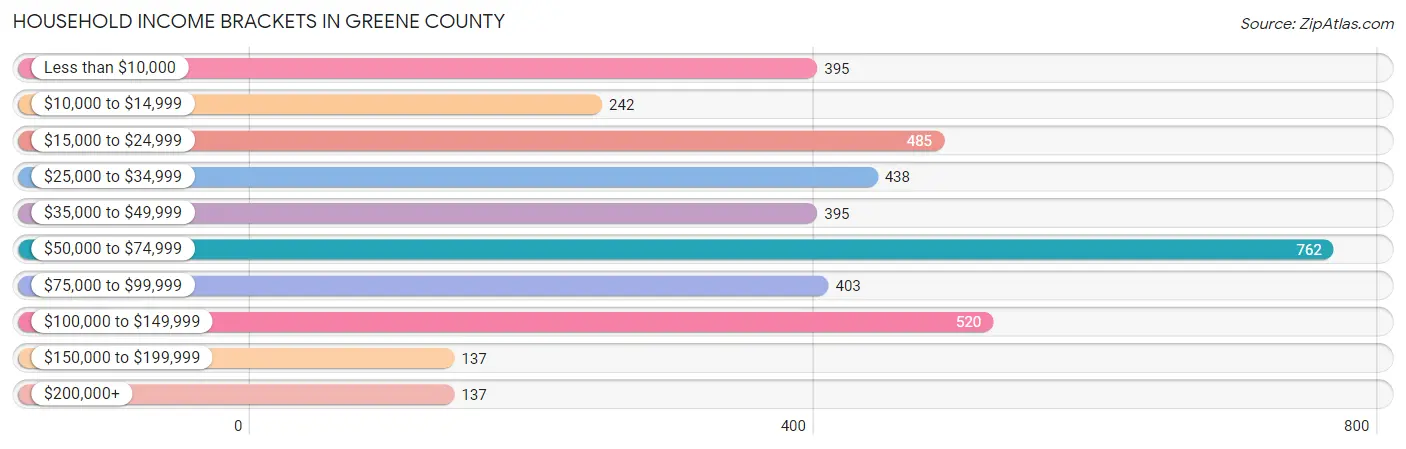
Household Income Brackets in Greene County
With 762 households falling in the category, the $50,000 to $74,999 income range is the most frequent in Greene County, accounting for 19.5% of all households. In contrast, only 137 households (3.5%) fall into the $150,000 to $199,999 income bracket, making it the least populous group.
| Income Bracket | # Households | % Households |
| Less than $10,000 | 395 | 10.1% |
| $10,000 to $14,999 | 242 | 6.2% |
| $15,000 to $24,999 | 485 | 12.4% |
| $25,000 to $34,999 | 438 | 11.2% |
| $35,000 to $49,999 | 395 | 10.1% |
| $50,000 to $74,999 | 762 | 19.5% |
| $75,000 to $99,999 | 403 | 10.3% |
| $100,000 to $149,999 | 520 | 13.3% |
| $150,000 to $199,999 | 137 | 3.5% |
| $200,000+ | 137 | 3.5% |
Household Income by Householder Age in Greene County
The median household income in Greene County is $50,000, with the highest median household income of $71,094 found in the 25 to 44 years age bracket for the primary householder. A total of 1,206 households (30.8%) fall into this category. Meanwhile, the 65+ years age bracket for the primary householder has the lowest median household income of $31,534, with 1,183 households (30.3%) in this group.
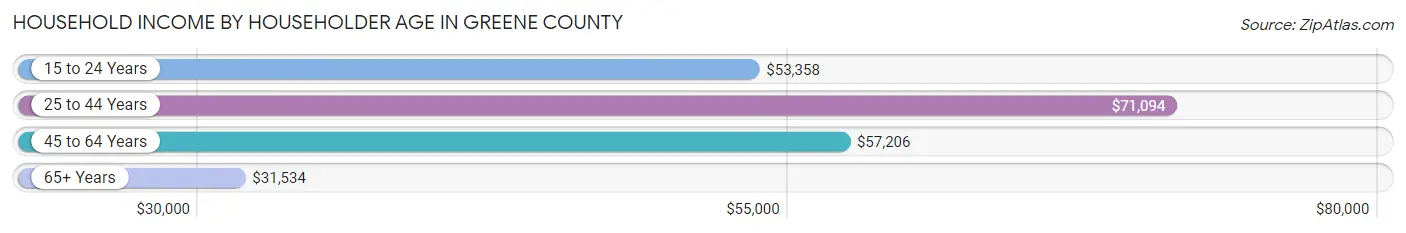
| Income Bracket | # Households | Median Income |
| 15 to 24 Years | 173 (4.4%) | $53,358 |
| 25 to 44 Years | 1,206 (30.8%) | $71,094 |
| 45 to 64 Years | 1,348 (34.5%) | $57,206 |
| 65+ Years | 1,183 (30.3%) | $31,534 |
| Total | 3,910 (100.0%) | $50,000 |
Poverty in Greene County
Income Below Poverty by Sex and Age in Greene County
With 18.2% poverty level for males and 18.6% for females among the residents of Greene County, 12 to 14 year old males and 12 to 14 year old females are the most vulnerable to poverty, with 137 males (59.1%) and 78 females (55.3%) in their respective age groups living below the poverty level.
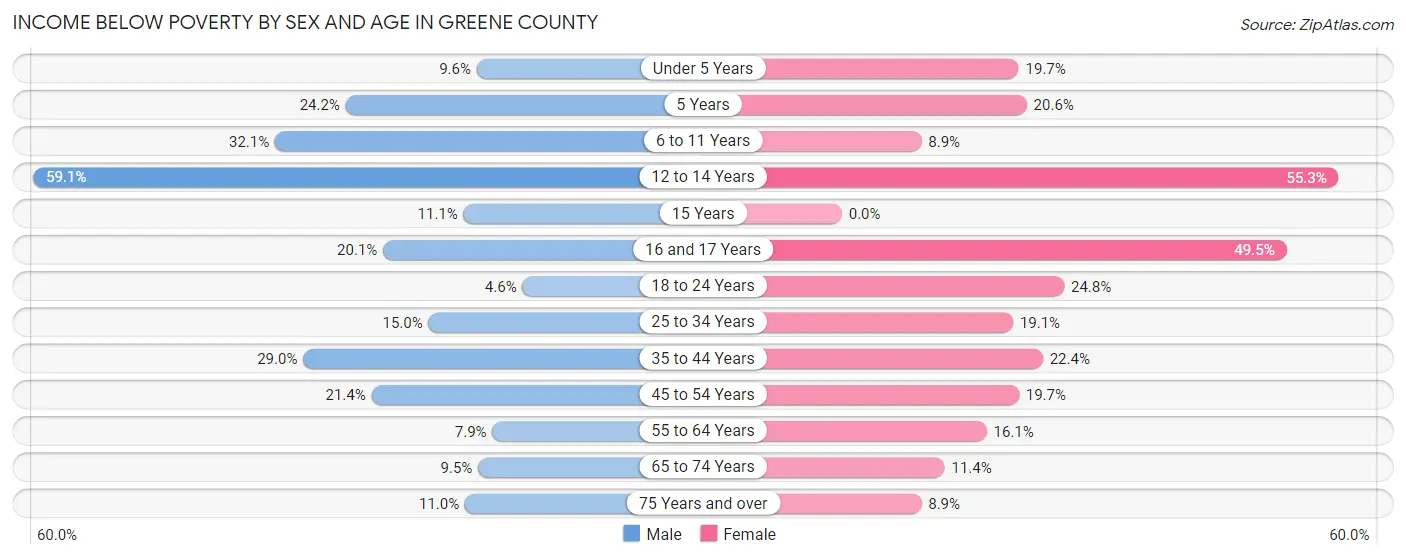
| Age Bracket | Male | Female |
| Under 5 Years | 37 (9.6%) | 63 (19.7%) |
| 5 Years | 16 (24.2%) | 14 (20.6%) |
| 6 to 11 Years | 123 (32.1%) | 38 (8.9%) |
| 12 to 14 Years | 137 (59.1%) | 78 (55.3%) |
| 15 Years | 7 (11.1%) | 0 (0.0%) |
| 16 and 17 Years | 60 (20.1%) | 52 (49.5%) |
| 18 to 24 Years | 23 (4.5%) | 98 (24.7%) |
| 25 to 34 Years | 101 (15.0%) | 110 (19.1%) |
| 35 to 44 Years | 146 (29.0%) | 162 (22.4%) |
| 45 to 54 Years | 94 (21.4%) | 149 (19.7%) |
| 55 to 64 Years | 32 (7.9%) | 110 (16.1%) |
| 65 to 74 Years | 41 (9.5%) | 62 (11.4%) |
| 75 Years and over | 31 (11.0%) | 40 (8.8%) |
| Total | 848 (18.2%) | 976 (18.6%) |
Income Above Poverty by Sex and Age in Greene County
According to the poverty statistics in Greene County, males aged 18 to 24 years and females aged 15 years are the age groups that are most secure financially, with 95.5% of males and 100.0% of females in these age groups living above the poverty line.
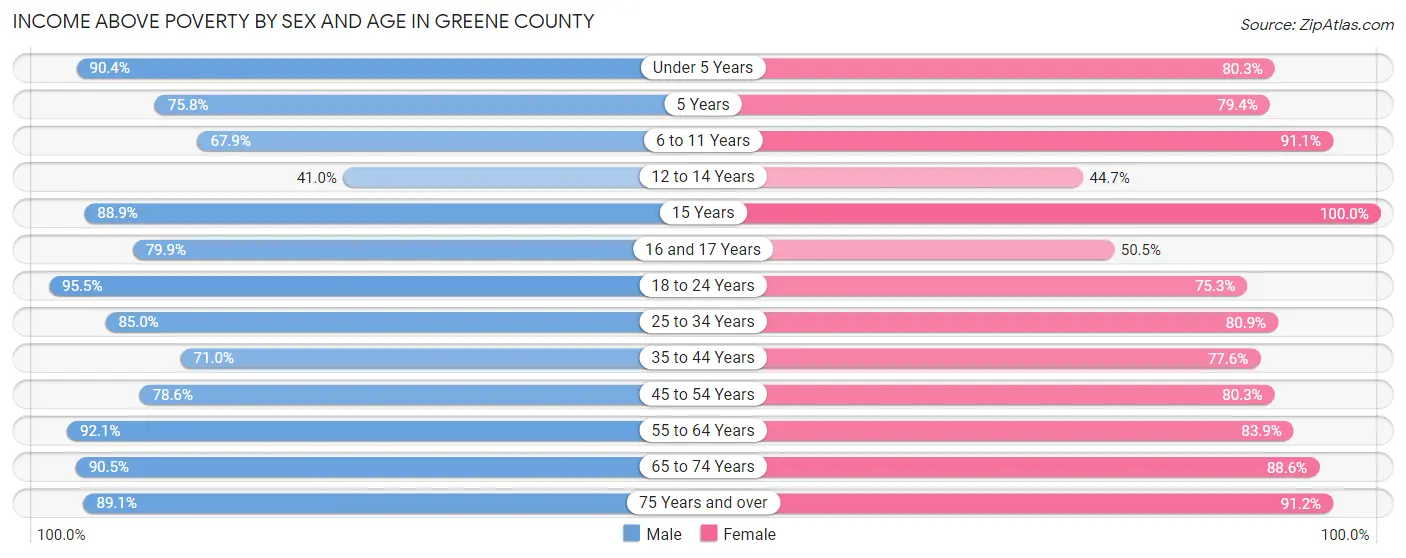
| Age Bracket | Male | Female |
| Under 5 Years | 347 (90.4%) | 257 (80.3%) |
| 5 Years | 50 (75.8%) | 54 (79.4%) |
| 6 to 11 Years | 260 (67.9%) | 391 (91.1%) |
| 12 to 14 Years | 95 (40.9%) | 63 (44.7%) |
| 15 Years | 56 (88.9%) | 60 (100.0%) |
| 16 and 17 Years | 239 (79.9%) | 53 (50.5%) |
| 18 to 24 Years | 483 (95.5%) | 298 (75.2%) |
| 25 to 34 Years | 572 (85.0%) | 467 (80.9%) |
| 35 to 44 Years | 358 (71.0%) | 562 (77.6%) |
| 45 to 54 Years | 346 (78.6%) | 607 (80.3%) |
| 55 to 64 Years | 373 (92.1%) | 572 (83.9%) |
| 65 to 74 Years | 391 (90.5%) | 480 (88.6%) |
| 75 Years and over | 252 (89.0%) | 412 (91.1%) |
| Total | 3,822 (81.8%) | 4,276 (81.4%) |
Income Below Poverty Among Married-Couple Families in Greene County
The poverty statistics for married-couple families in Greene County show that 7.5% or 150 of the total 2,010 families live below the poverty line. Families with 3 or 4 children have the highest poverty rate of 19.2%, comprising of 29 families. On the other hand, families with 5 or more children have the lowest poverty rate of 0.0%, which includes 0 families.
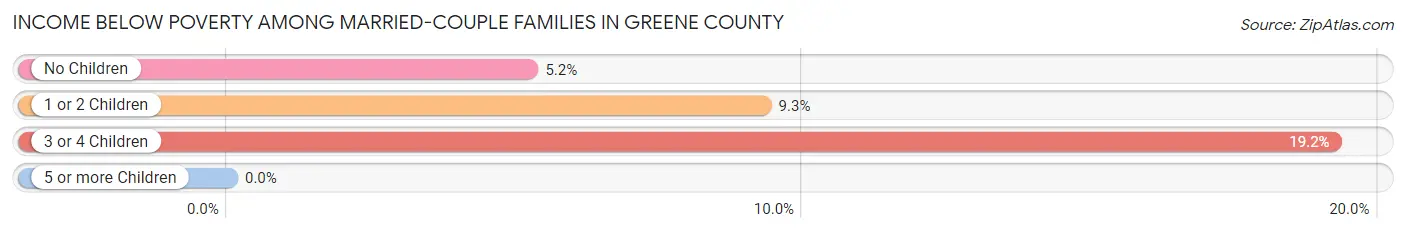
| Children | Above Poverty | Below Poverty |
| No Children | 1,196 (94.8%) | 66 (5.2%) |
| 1 or 2 Children | 537 (90.7%) | 55 (9.3%) |
| 3 or 4 Children | 122 (80.8%) | 29 (19.2%) |
| 5 or more Children | 5 (100.0%) | 0 (0.0%) |
| Total | 1,860 (92.5%) | 150 (7.5%) |
Income Below Poverty Among Single-Parent Households in Greene County
According to the poverty data in Greene County, 19.0% or 40 single-father households and 33.1% or 163 single-mother households are living below the poverty line. Among single-father households, those with 1 or 2 children have the highest poverty rate, with 26 households (27.4%) experiencing poverty. Likewise, among single-mother households, those with 3 or 4 children have the highest poverty rate, with 27 households (100.0%) falling below the poverty line.
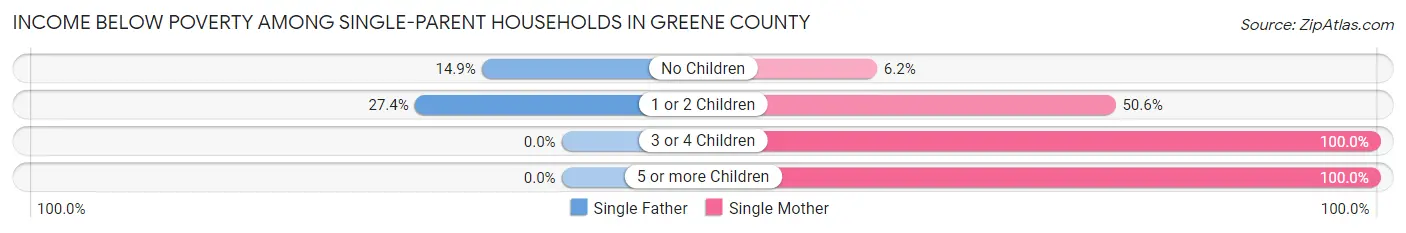
| Children | Single Father | Single Mother |
| No Children | 14 (14.9%) | 14 (6.2%) |
| 1 or 2 Children | 26 (27.4%) | 121 (50.6%) |
| 3 or 4 Children | 0 (0.0%) | 27 (100.0%) |
| 5 or more Children | 0 (0.0%) | 1 (100.0%) |
| Total | 40 (19.0%) | 163 (33.1%) |
Income Below Poverty Among Married-Couple vs Single-Parent Households in Greene County
The poverty data for Greene County shows that 150 of the married-couple family households (7.5%) and 203 of the single-parent households (28.8%) are living below the poverty level. Within the married-couple family households, those with 3 or 4 children have the highest poverty rate, with 29 households (19.2%) falling below the poverty line. Among the single-parent households, those with 5 or more children have the highest poverty rate, with 1 household (100.0%) living below poverty.
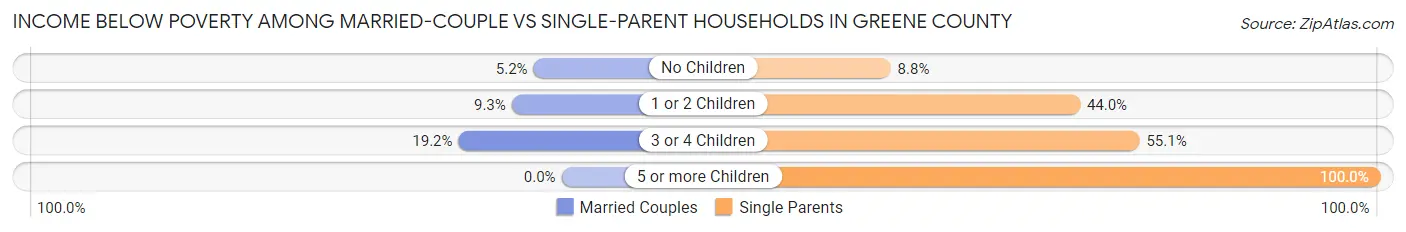
| Children | Married-Couple Families | Single-Parent Households |
| No Children | 66 (5.2%) | 28 (8.7%) |
| 1 or 2 Children | 55 (9.3%) | 147 (44.0%) |
| 3 or 4 Children | 29 (19.2%) | 27 (55.1%) |
| 5 or more Children | 0 (0.0%) | 1 (100.0%) |
| Total | 150 (7.5%) | 203 (28.8%) |
Race in Greene County
The most populous races in Greene County are White / Caucasian (9,781 | 71.5%), Black / African American (3,478 | 25.4%), and Two or more Races (264 | 1.9%).
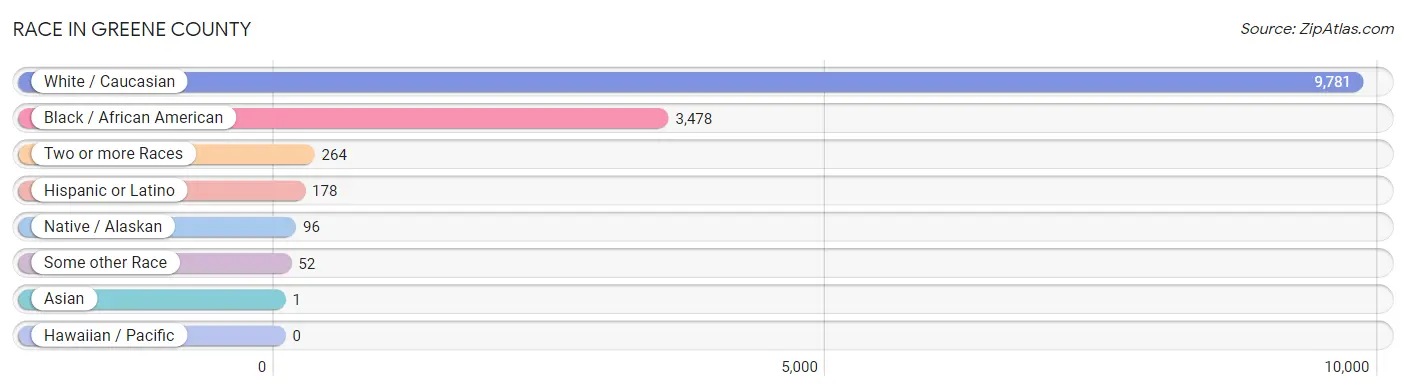
| Race | # Population | % Population |
| Asian | 1 | 0.0% |
| Black / African American | 3,478 | 25.4% |
| Hawaiian / Pacific | 0 | 0.0% |
| Hispanic or Latino | 178 | 1.3% |
| Native / Alaskan | 96 | 0.7% |
| White / Caucasian | 9,781 | 71.5% |
| Two or more Races | 264 | 1.9% |
| Some other Race | 52 | 0.4% |
| Total | 13,672 | 100.0% |
Ancestry in Greene County
The most populous ancestries reported in Greene County are American (2,817 | 20.6%), English (1,651 | 12.1%), Irish (1,413 | 10.3%), German (753 | 5.5%), and Scottish (313 | 2.3%), together accounting for 50.8% of all Greene County residents.
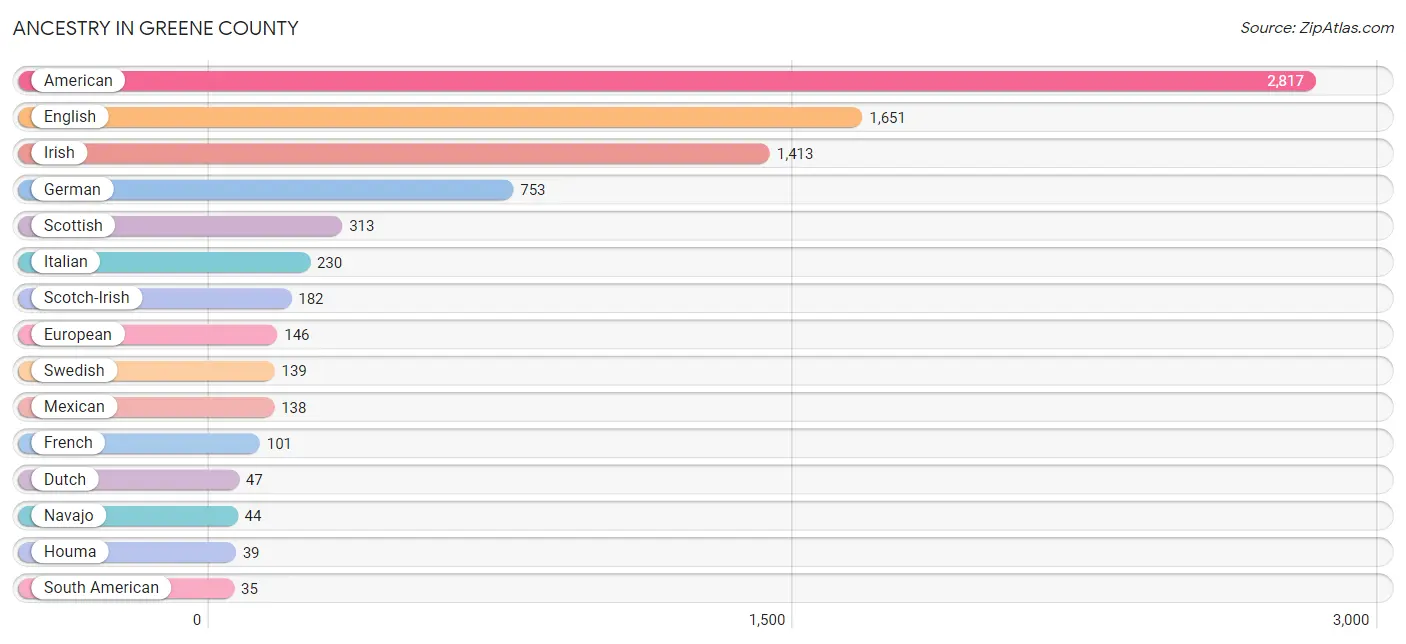
| Ancestry | # Population | % Population |
| African | 3 | 0.0% |
| American | 2,817 | 20.6% |
| Arab | 10 | 0.1% |
| Basque | 8 | 0.1% |
| British | 20 | 0.2% |
| Cajun | 30 | 0.2% |
| Cherokee | 19 | 0.1% |
| Choctaw | 17 | 0.1% |
| Colombian | 8 | 0.1% |
| Dutch | 47 | 0.3% |
| Dutch West Indian | 3 | 0.0% |
| English | 1,651 | 12.1% |
| European | 146 | 1.1% |
| French | 101 | 0.7% |
| French Canadian | 8 | 0.1% |
| German | 753 | 5.5% |
| Greek | 25 | 0.2% |
| Houma | 39 | 0.3% |
| Irish | 1,413 | 10.3% |
| Italian | 230 | 1.7% |
| Korean | 12 | 0.1% |
| Mexican | 138 | 1.0% |
| Navajo | 44 | 0.3% |
| Norwegian | 32 | 0.2% |
| Polish | 19 | 0.1% |
| Puerto Rican | 5 | 0.0% |
| Scotch-Irish | 182 | 1.3% |
| Scottish | 313 | 2.3% |
| South American | 35 | 0.3% |
| Subsaharan African | 3 | 0.0% |
| Swedish | 139 | 1.0% |
| Tlingit-Haida | 3 | 0.0% |
| Venezuelan | 27 | 0.2% |
| Welsh | 18 | 0.1% | View All 34 Rows |
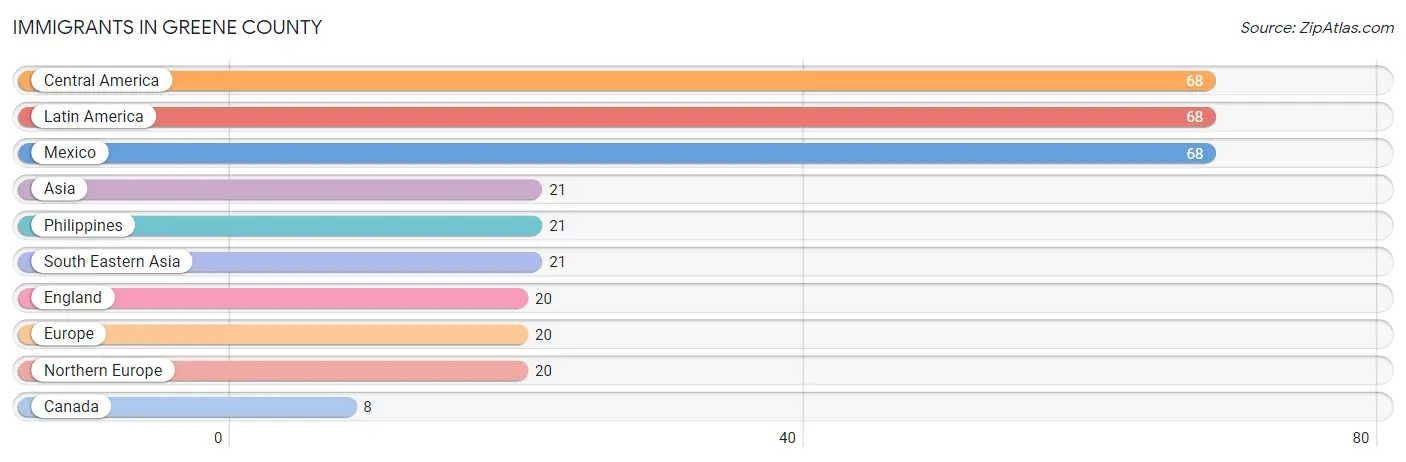
Immigrants in Greene County
The most numerous immigrant groups reported in Greene County came from Central America (68 | 0.5%), Latin America (68 | 0.5%), Mexico (68 | 0.5%), Asia (21 | 0.2%), and Philippines (21 | 0.2%), together accounting for 1.8% of all Greene County residents.
| Immigration Origin | # Population | % Population |
| Asia | 21 | 0.2% |
| Canada | 8 | 0.1% |
| Central America | 68 | 0.5% |
| England | 20 | 0.2% |
| Europe | 20 | 0.2% |
| Latin America | 68 | 0.5% |
| Mexico | 68 | 0.5% |
| Northern Europe | 20 | 0.2% |
| Philippines | 21 | 0.2% |
| South Eastern Asia | 21 | 0.2% | View All 10 Rows |
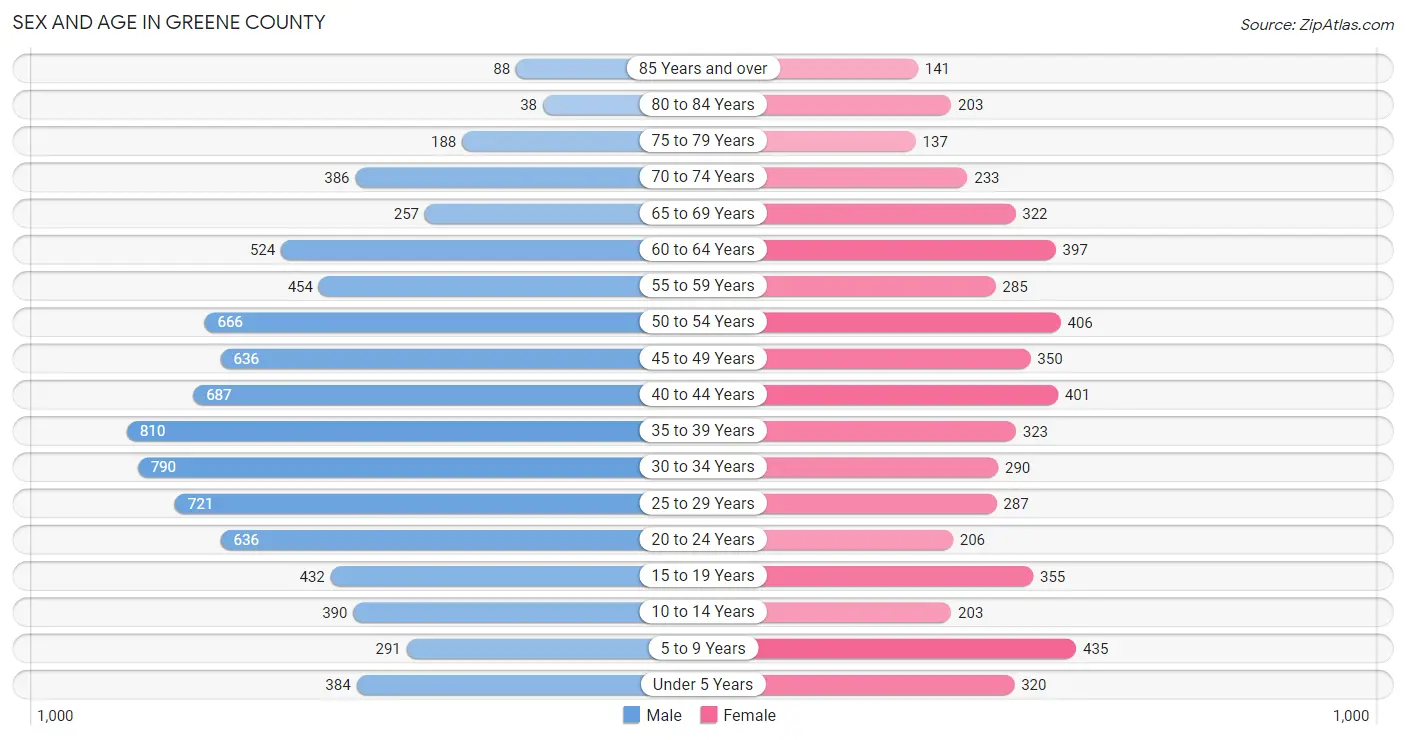
Sex and Age in Greene County
Sex and Age in Greene County
The most populous age groups in Greene County are 35 to 39 Years (810 | 9.7%) for men and 5 to 9 Years (435 | 8.2%) for women.
| Age Bracket | Male | Female |
| Under 5 Years | 384 (4.6%) | 320 (6.0%) |
| 5 to 9 Years | 291 (3.5%) | 435 (8.2%) |
| 10 to 14 Years | 390 (4.7%) | 203 (3.8%) |
| 15 to 19 Years | 432 (5.2%) | 355 (6.7%) |
| 20 to 24 Years | 636 (7.6%) | 206 (3.9%) |
| 25 to 29 Years | 721 (8.6%) | 287 (5.4%) |
| 30 to 34 Years | 790 (9.4%) | 290 (5.5%) |
| 35 to 39 Years | 810 (9.7%) | 323 (6.1%) |
| 40 to 44 Years | 687 (8.2%) | 401 (7.6%) |
| 45 to 49 Years | 636 (7.6%) | 350 (6.6%) |
| 50 to 54 Years | 666 (8.0%) | 406 (7.7%) |
| 55 to 59 Years | 454 (5.4%) | 285 (5.4%) |
| 60 to 64 Years | 524 (6.2%) | 397 (7.5%) |
| 65 to 69 Years | 257 (3.1%) | 322 (6.1%) |
| 70 to 74 Years | 386 (4.6%) | 233 (4.4%) |
| 75 to 79 Years | 188 (2.2%) | 137 (2.6%) |
| 80 to 84 Years | 38 (0.4%) | 203 (3.8%) |
| 85 Years and over | 88 (1.1%) | 141 (2.7%) |
| Total | 8,378 (100.0%) | 5,294 (100.0%) |
Families and Households in Greene County
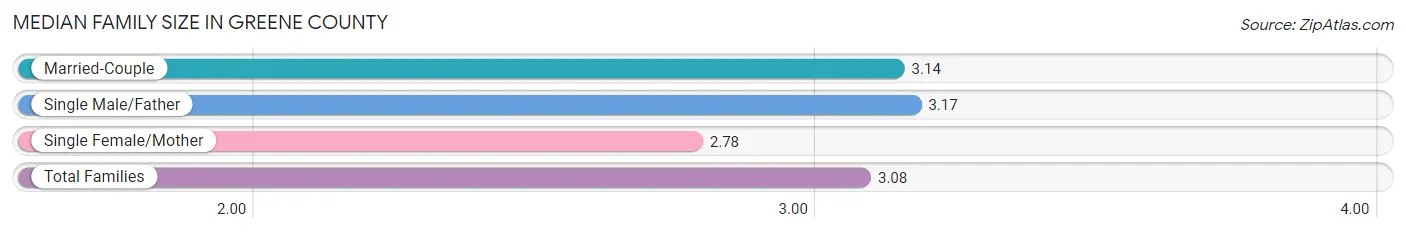
Median Family Size in Greene County
The median family size in Greene County is 3.08 persons per family, with single male/father families (211 | 7.8%) accounting for the largest median family size of 3.17 persons per family. On the other hand, single female/mother families (493 | 18.2%) represent the smallest median family size with 2.78 persons per family.
| Family Type | # Families | Family Size |
| Married-Couple | 2,010 (74.1%) | 3.14 |
| Single Male/Father | 211 (7.8%) | 3.17 |
| Single Female/Mother | 493 (18.2%) | 2.78 |
| Total Families | 2,714 (100.0%) | 3.08 |
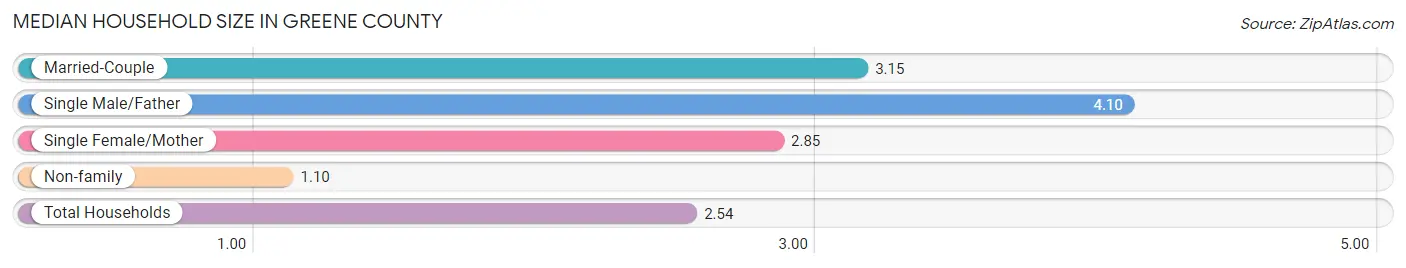
Median Household Size in Greene County
The median household size in Greene County is 2.54 persons per household, with single male/father households (211 | 5.4%) accounting for the largest median household size of 4.1 persons per household. non-family households (1,196 | 30.6%) represent the smallest median household size with 1.10 persons per household.
| Household Type | # Households | Household Size |
| Married-Couple | 2,010 (51.4%) | 3.15 |
| Single Male/Father | 211 (5.4%) | 4.10 |
| Single Female/Mother | 493 (12.6%) | 2.85 |
| Non-family | 1,196 (30.6%) | 1.10 |
| Total Households | 3,910 (100.0%) | 2.54 |
Household Size by Marriage Status in Greene County
Out of a total of 3,910 households in Greene County, 2,714 (69.4%) are family households, while 1,196 (30.6%) are nonfamily households. The most numerous type of family households are 2-person households, comprising 1,322, and the most common type of nonfamily households are 1-person households, comprising 1,110.
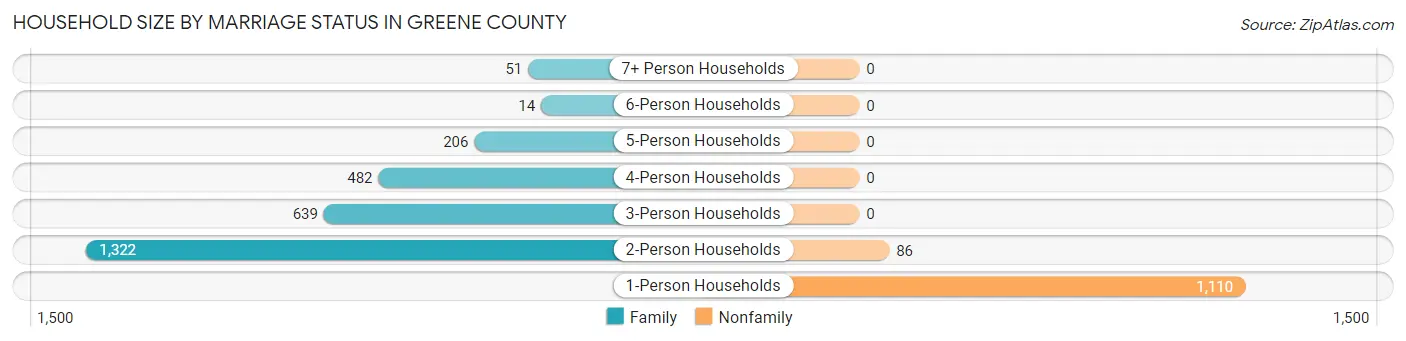
| Household Size | Family Households | Nonfamily Households |
| 1-Person Households | - | 1,110 (28.4%) |
| 2-Person Households | 1,322 (33.8%) | 86 (2.2%) |
| 3-Person Households | 639 (16.3%) | 0 (0.0%) |
| 4-Person Households | 482 (12.3%) | 0 (0.0%) |
| 5-Person Households | 206 (5.3%) | 0 (0.0%) |
| 6-Person Households | 14 (0.4%) | 0 (0.0%) |
| 7+ Person Households | 51 (1.3%) | 0 (0.0%) |
| Total | 2,714 (69.4%) | 1,196 (30.6%) |
Female Fertility in Greene County
Fertility by Age in Greene County
Average fertility rate in Greene County is 54.0 births per 1,000 women. Women in the age bracket of 20 to 34 years have the highest fertility rate with 114.0 births per 1,000 women. Women in the age bracket of 20 to 34 years acount for 74.2% of all women with births.
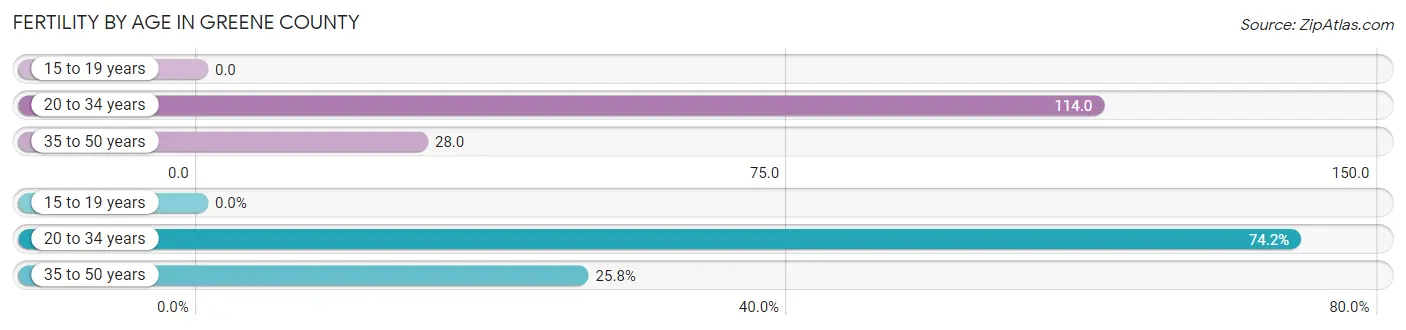
| Age Bracket | Women with Births | Births / 1,000 Women |
| 15 to 19 years | 0 (0.0%) | 0.0 |
| 20 to 34 years | 89 (74.2%) | 114.0 |
| 35 to 50 years | 31 (25.8%) | 28.0 |
| Total | 120 (100.0%) | 54.0 |
Fertility by Age by Marriage Status in Greene County
25.8% of women with births (120) in Greene County are married. The highest percentage of unmarried women with births falls into 35 to 50 years age bracket with 74.2% of them unmarried at the time of birth, while the lowest percentage of unmarried women with births belong to 20 to 34 years age bracket with 74.2% of them unmarried.
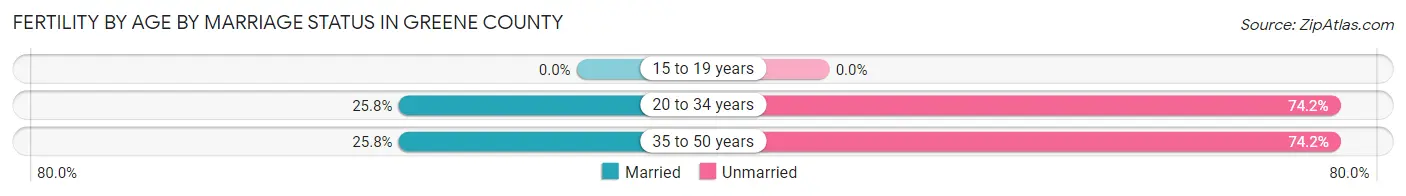
| Age Bracket | Married | Unmarried |
| 15 to 19 years | 0 (0.0%) | 0 (0.0%) |
| 20 to 34 years | 23 (25.8%) | 66 (74.2%) |
| 35 to 50 years | 8 (25.8%) | 23 (74.2%) |
| Total | 31 (25.8%) | 89 (74.2%) |
Fertility by Education in Greene County
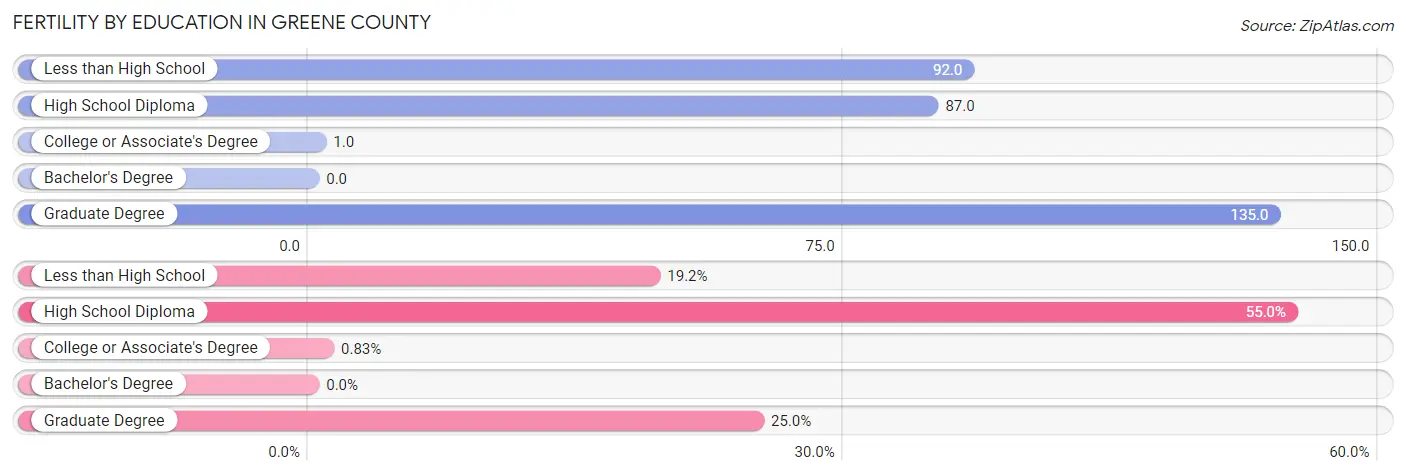
| Educational Attainment | Women with Births | Births / 1,000 Women |
| Less than High School | 23 (19.2%) | 92.0 |
| High School Diploma | 66 (55.0%) | 87.0 |
| College or Associate's Degree | 1 (0.8%) | 1.0 |
| Bachelor's Degree | 0 (0.0%) | 0.0 |
| Graduate Degree | 30 (25.0%) | 135.0 |
| Total | 120 (100.0%) | 54.0 |
Fertility by Education by Marriage Status in Greene County
74.2% of women with births in Greene County are unmarried. Women with the educational attainment of college or associate's degree are most likely to be married with 100.0% of them married at childbirth, while women with the educational attainment of less than high school are least likely to be married with 100.0% of them unmarried at childbirth.
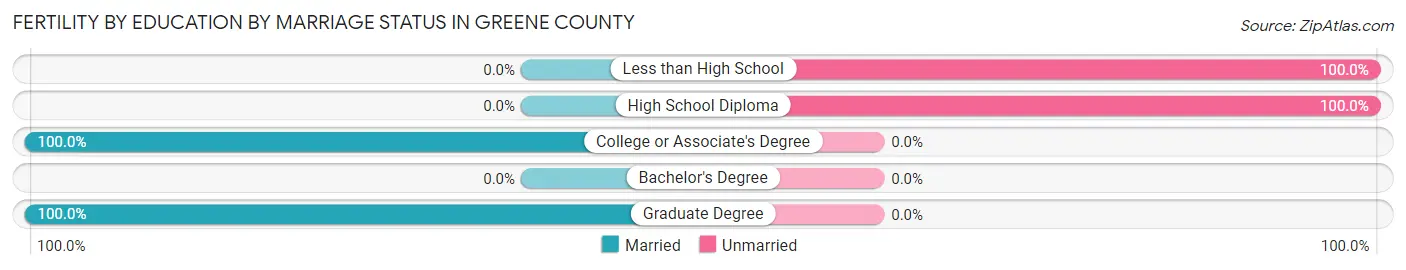
| Educational Attainment | Married | Unmarried |
| Less than High School | 0 (0.0%) | 23 (100.0%) |
| High School Diploma | 0 (0.0%) | 66 (100.0%) |
| College or Associate's Degree | 1 (100.0%) | 0 (0.0%) |
| Bachelor's Degree | 0 (0.0%) | 0 (0.0%) |
| Graduate Degree | 30 (100.0%) | 0 (0.0%) |
| Total | 31 (25.8%) | 89 (74.2%) |
Employment Characteristics in Greene County
Employment by Class of Employer in Greene County
Among the 3,214 employed individuals in Greene County, private company employees (1,948 | 60.6%), state government employees (529 | 16.5%), and not-for-profit organizations (228 | 7.1%) make up the most common classes of employment.
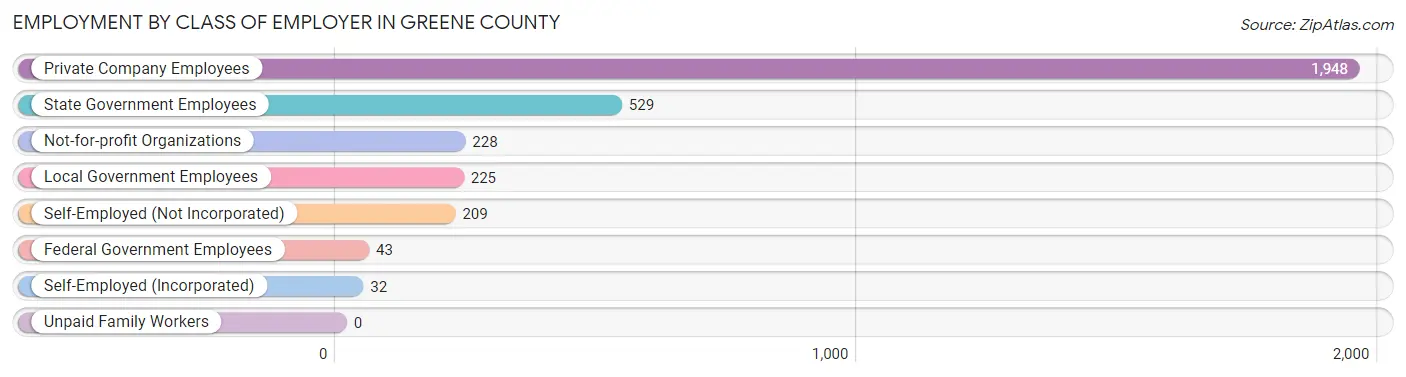
| Employer Class | # Employees | % Employees |
| Private Company Employees | 1,948 | 60.6% |
| Self-Employed (Incorporated) | 32 | 1.0% |
| Self-Employed (Not Incorporated) | 209 | 6.5% |
| Not-for-profit Organizations | 228 | 7.1% |
| Local Government Employees | 225 | 7.0% |
| State Government Employees | 529 | 16.5% |
| Federal Government Employees | 43 | 1.3% |
| Unpaid Family Workers | 0 | 0.0% |
| Total | 3,214 | 100.0% |
Employment Status by Age in Greene County
According to the labor force statistics for Greene County, out of the total population over 16 years of age (11,526), 32.2% or 3,711 individuals are in the labor force, with 12.6% or 468 of them unemployed. The age group with the highest labor force participation rate is 20 to 24 years, with 52.3% or 440 individuals in the labor force. Within the labor force, the 16 to 19 years age range has the highest percentage of unemployed individuals, with 55.6% or 79 of them being unemployed.
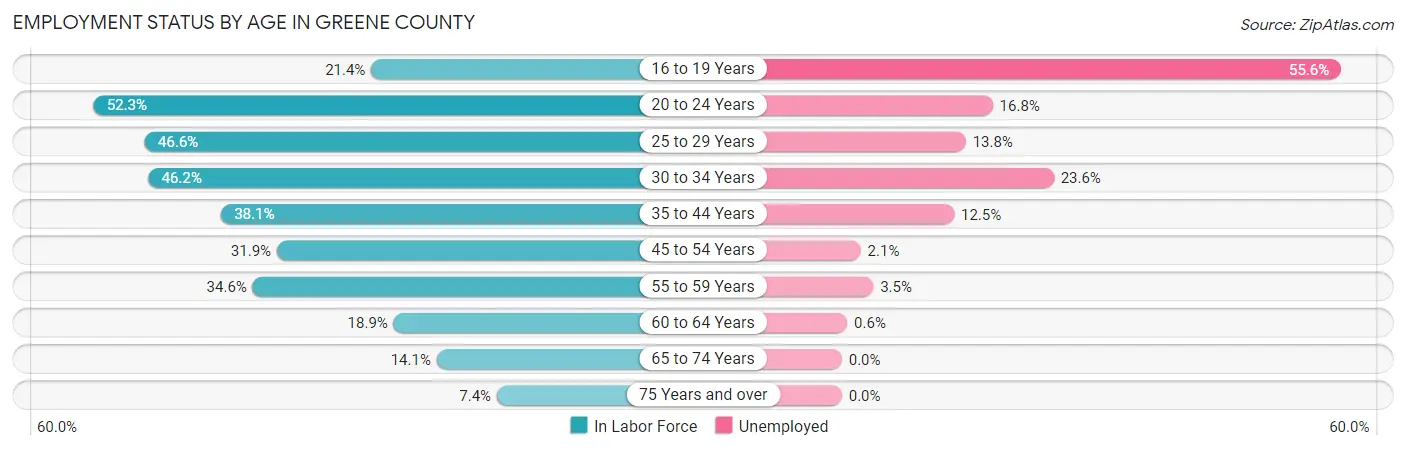
| Age Bracket | In Labor Force | Unemployed |
| 16 to 19 Years | 142 (21.4%) | 79 (55.6%) |
| 20 to 24 Years | 440 (52.3%) | 74 (16.8%) |
| 25 to 29 Years | 470 (46.6%) | 65 (13.8%) |
| 30 to 34 Years | 499 (46.2%) | 118 (23.6%) |
| 35 to 44 Years | 846 (38.1%) | 106 (12.5%) |
| 45 to 54 Years | 657 (31.9%) | 14 (2.1%) |
| 55 to 59 Years | 256 (34.6%) | 9 (3.5%) |
| 60 to 64 Years | 174 (18.9%) | 1 (0.6%) |
| 65 to 74 Years | 169 (14.1%) | 0 (0.0%) |
| 75 Years and over | 59 (7.4%) | 0 (0.0%) |
| Total | 3,711 (32.2%) | 468 (12.6%) |
Employment Status by Educational Attainment in Greene County
According to labor force statistics for Greene County, 36.2% of individuals (2,906) out of the total population between 25 and 64 years of age (8,027) are in the labor force, with 10.8% or 314 of them being unemployed. The group with the highest labor force participation rate are those with the educational attainment of bachelor's degree or higher, with 51.7% or 455 individuals in the labor force. Within the labor force, individuals with high school diploma education have the highest percentage of unemployment, with 22.1% or 284 of them being unemployed.
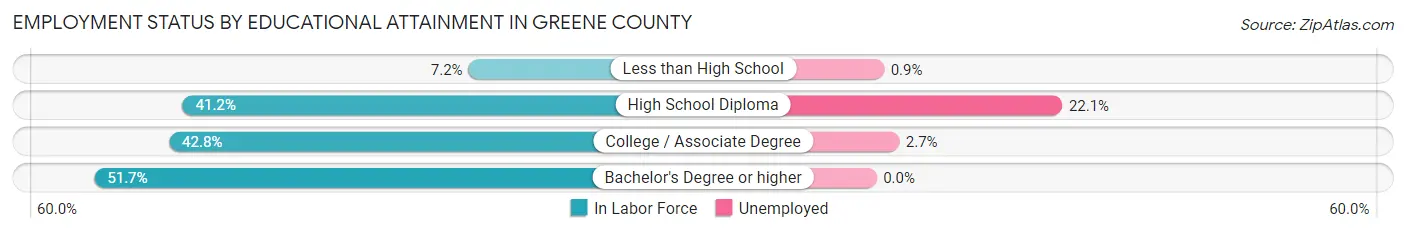
| Educational Attainment | In Labor Force | Unemployed |
| Less than High School | 114 (7.2%) | 14 (0.9%) |
| High School Diploma | 1,284 (41.2%) | 689 (22.1%) |
| College / Associate Degree | 1,050 (42.8%) | 66 (2.7%) |
| Bachelor's Degree or higher | 455 (51.7%) | 0 (0.0%) |
| Total | 2,906 (36.2%) | 867 (10.8%) |
Employment Occupations by Sex in Greene County
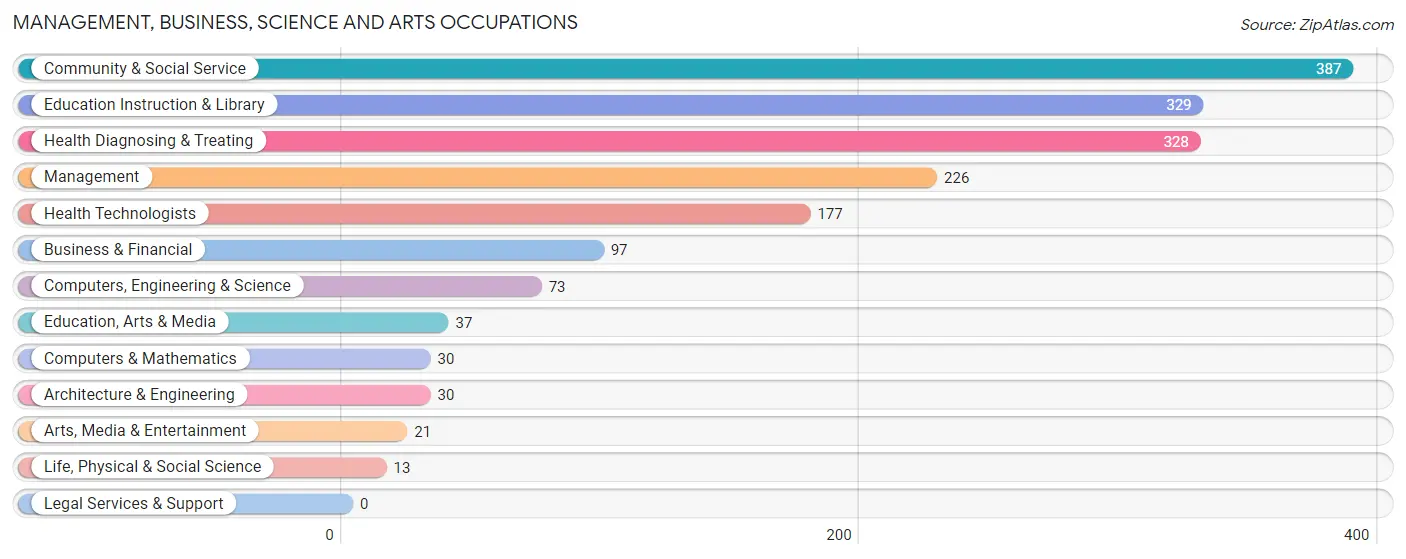
Management, Business, Science and Arts Occupations
The most common Management, Business, Science and Arts occupations in Greene County are Community & Social Service (387 | 11.9%), Education Instruction & Library (329 | 10.1%), Health Diagnosing & Treating (328 | 10.1%), Management (226 | 7.0%), and Health Technologists (177 | 5.4%).
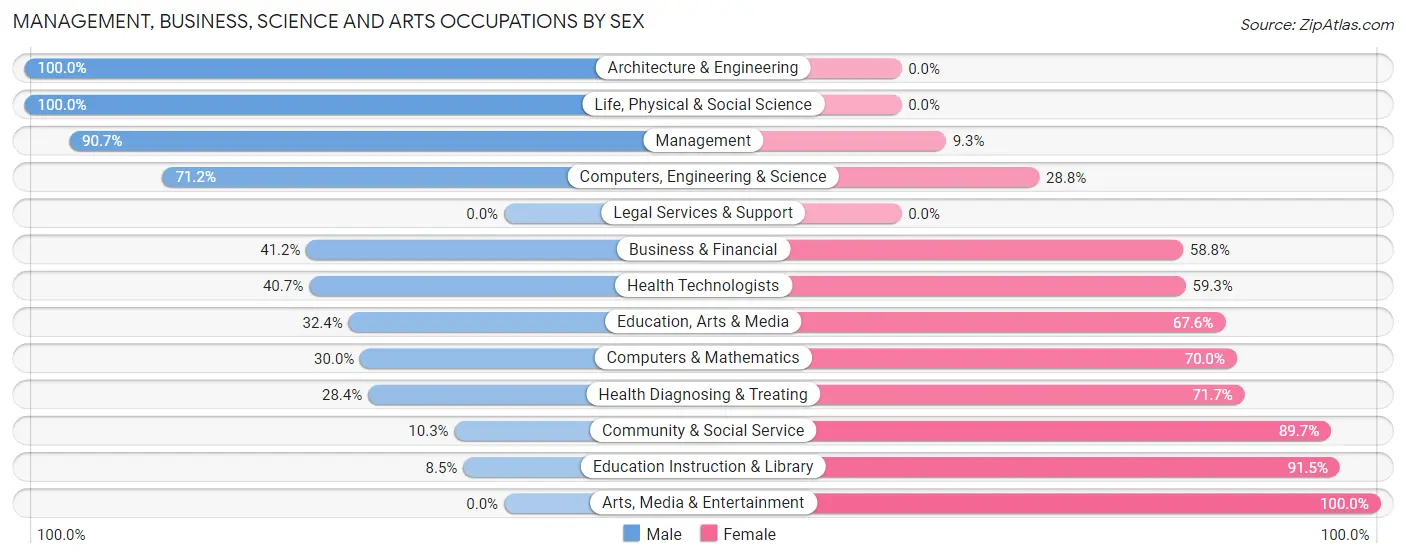
Management, Business, Science and Arts Occupations by Sex
Within the Management, Business, Science and Arts occupations in Greene County, the most male-oriented occupations are Architecture & Engineering (100.0%), Life, Physical & Social Science (100.0%), and Management (90.7%), while the most female-oriented occupations are Arts, Media & Entertainment (100.0%), Education Instruction & Library (91.5%), and Community & Social Service (89.7%).
| Occupation | Male | Female |
| Management | 205 (90.7%) | 21 (9.3%) |
| Business & Financial | 40 (41.2%) | 57 (58.8%) |
| Computers, Engineering & Science | 52 (71.2%) | 21 (28.8%) |
| Computers & Mathematics | 9 (30.0%) | 21 (70.0%) |
| Architecture & Engineering | 30 (100.0%) | 0 (0.0%) |
| Life, Physical & Social Science | 13 (100.0%) | 0 (0.0%) |
| Community & Social Service | 40 (10.3%) | 347 (89.7%) |
| Education, Arts & Media | 12 (32.4%) | 25 (67.6%) |
| Legal Services & Support | 0 (0.0%) | 0 (0.0%) |
| Education Instruction & Library | 28 (8.5%) | 301 (91.5%) |
| Arts, Media & Entertainment | 0 (0.0%) | 21 (100.0%) |
| Health Diagnosing & Treating | 93 (28.3%) | 235 (71.7%) |
| Health Technologists | 72 (40.7%) | 105 (59.3%) |
| Total (Category) | 430 (38.7%) | 681 (61.3%) |
| Total (Overall) | 1,650 (50.8%) | 1,597 (49.2%) |
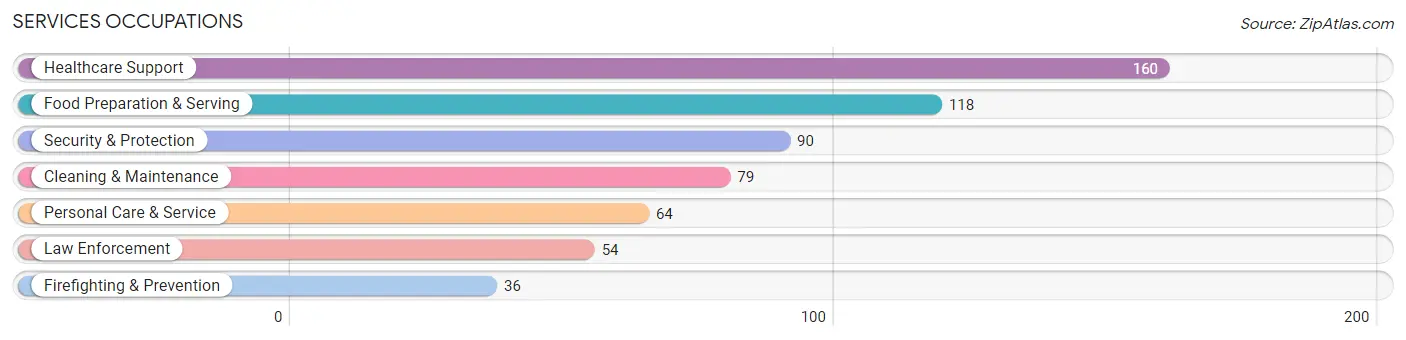
Services Occupations
The most common Services occupations in Greene County are Healthcare Support (160 | 4.9%), Food Preparation & Serving (118 | 3.6%), Security & Protection (90 | 2.8%), Cleaning & Maintenance (79 | 2.4%), and Personal Care & Service (64 | 2.0%).
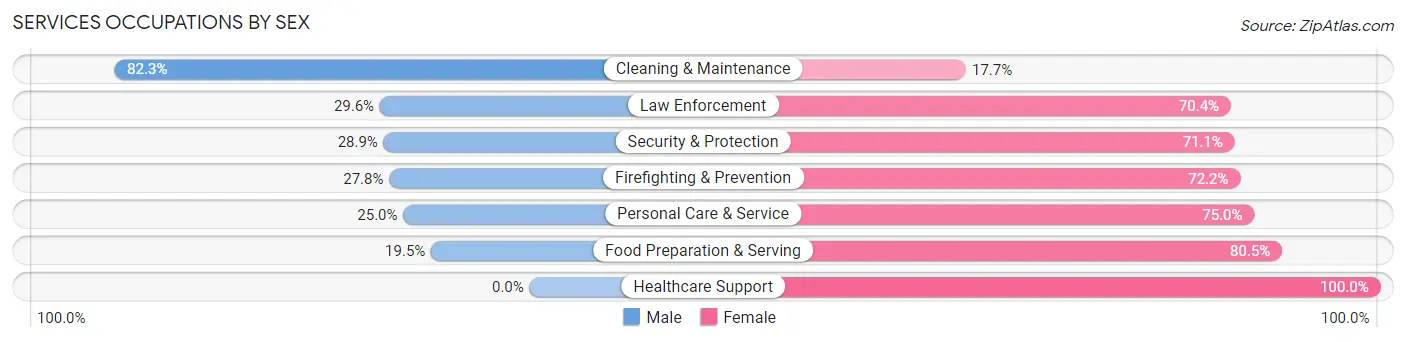
Services Occupations by Sex
Within the Services occupations in Greene County, the most male-oriented occupations are Cleaning & Maintenance (82.3%), Law Enforcement (29.6%), and Security & Protection (28.9%), while the most female-oriented occupations are Healthcare Support (100.0%), Food Preparation & Serving (80.5%), and Personal Care & Service (75.0%).
| Occupation | Male | Female |
| Healthcare Support | 0 (0.0%) | 160 (100.0%) |
| Security & Protection | 26 (28.9%) | 64 (71.1%) |
| Firefighting & Prevention | 10 (27.8%) | 26 (72.2%) |
| Law Enforcement | 16 (29.6%) | 38 (70.4%) |
| Food Preparation & Serving | 23 (19.5%) | 95 (80.5%) |
| Cleaning & Maintenance | 65 (82.3%) | 14 (17.7%) |
| Personal Care & Service | 16 (25.0%) | 48 (75.0%) |
| Total (Category) | 130 (25.4%) | 381 (74.6%) |
| Total (Overall) | 1,650 (50.8%) | 1,597 (49.2%) |
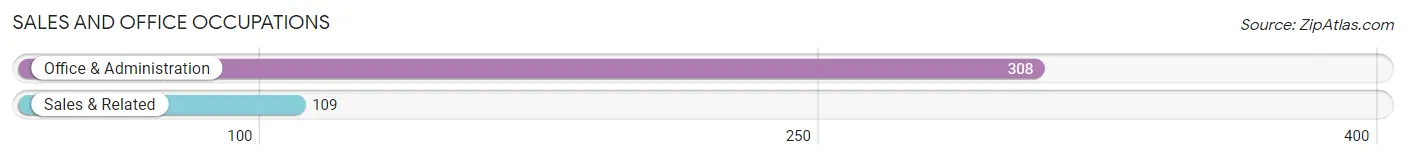
Sales and Office Occupations
The most common Sales and Office occupations in Greene County are Office & Administration (308 | 9.5%), and Sales & Related (109 | 3.4%).
Sales and Office Occupations by Sex
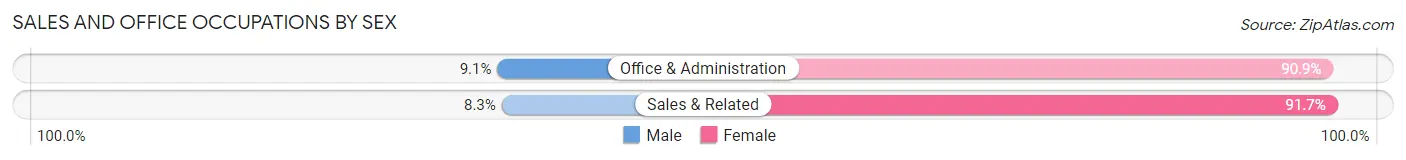
| Occupation | Male | Female |
| Sales & Related | 9 (8.3%) | 100 (91.7%) |
| Office & Administration | 28 (9.1%) | 280 (90.9%) |
| Total (Category) | 37 (8.9%) | 380 (91.1%) |
| Total (Overall) | 1,650 (50.8%) | 1,597 (49.2%) |
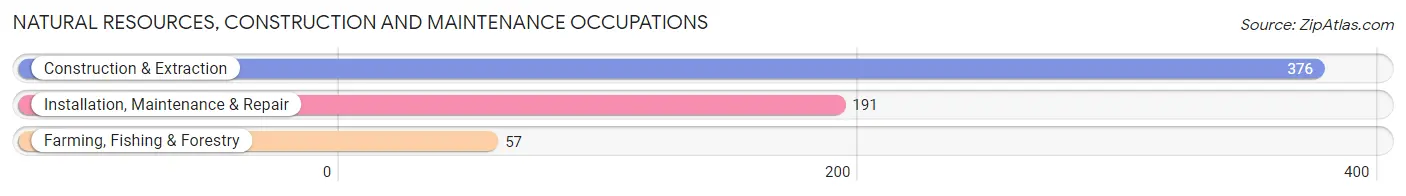
Natural Resources, Construction and Maintenance Occupations
The most common Natural Resources, Construction and Maintenance occupations in Greene County are Construction & Extraction (376 | 11.6%), Installation, Maintenance & Repair (191 | 5.9%), and Farming, Fishing & Forestry (57 | 1.8%).
Natural Resources, Construction and Maintenance Occupations by Sex
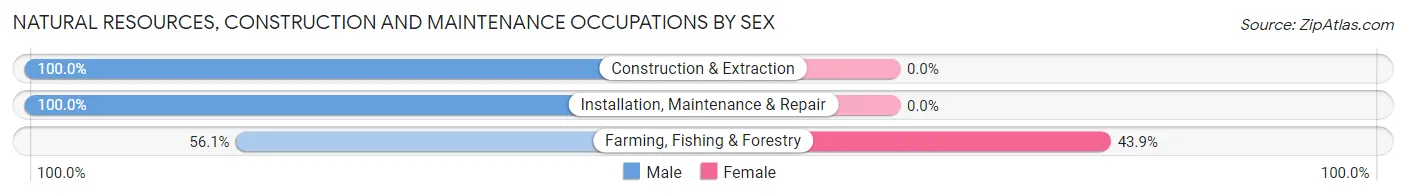
| Occupation | Male | Female |
| Farming, Fishing & Forestry | 32 (56.1%) | 25 (43.9%) |
| Construction & Extraction | 376 (100.0%) | 0 (0.0%) |
| Installation, Maintenance & Repair | 191 (100.0%) | 0 (0.0%) |
| Total (Category) | 599 (96.0%) | 25 (4.0%) |
| Total (Overall) | 1,650 (50.8%) | 1,597 (49.2%) |
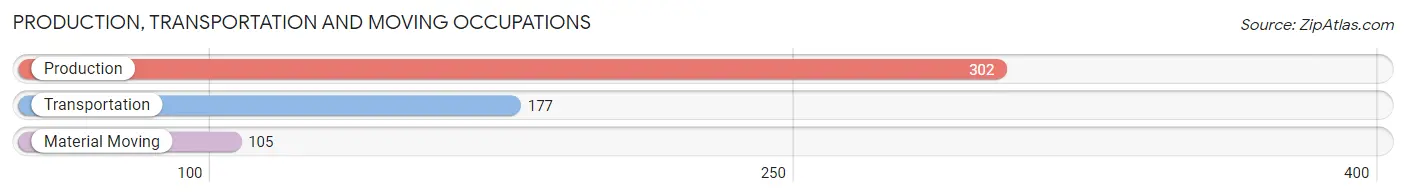
Production, Transportation and Moving Occupations
The most common Production, Transportation and Moving occupations in Greene County are Production (302 | 9.3%), Transportation (177 | 5.4%), and Material Moving (105 | 3.2%).
Production, Transportation and Moving Occupations by Sex
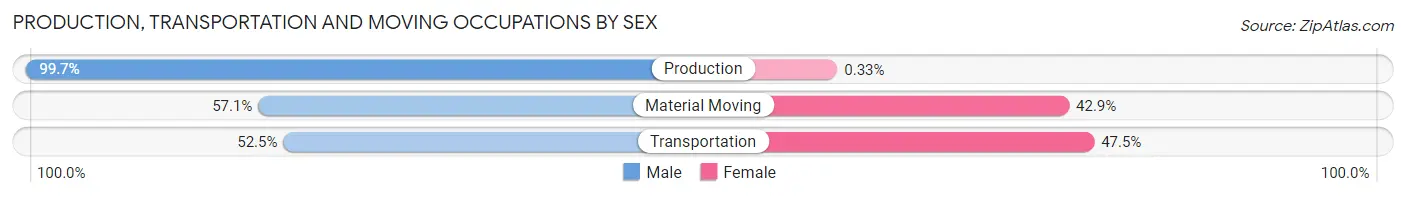
| Occupation | Male | Female |
| Production | 301 (99.7%) | 1 (0.3%) |
| Transportation | 93 (52.5%) | 84 (47.5%) |
| Material Moving | 60 (57.1%) | 45 (42.9%) |
| Total (Category) | 454 (77.7%) | 130 (22.3%) |
| Total (Overall) | 1,650 (50.8%) | 1,597 (49.2%) |
Employment Industries by Sex in Greene County
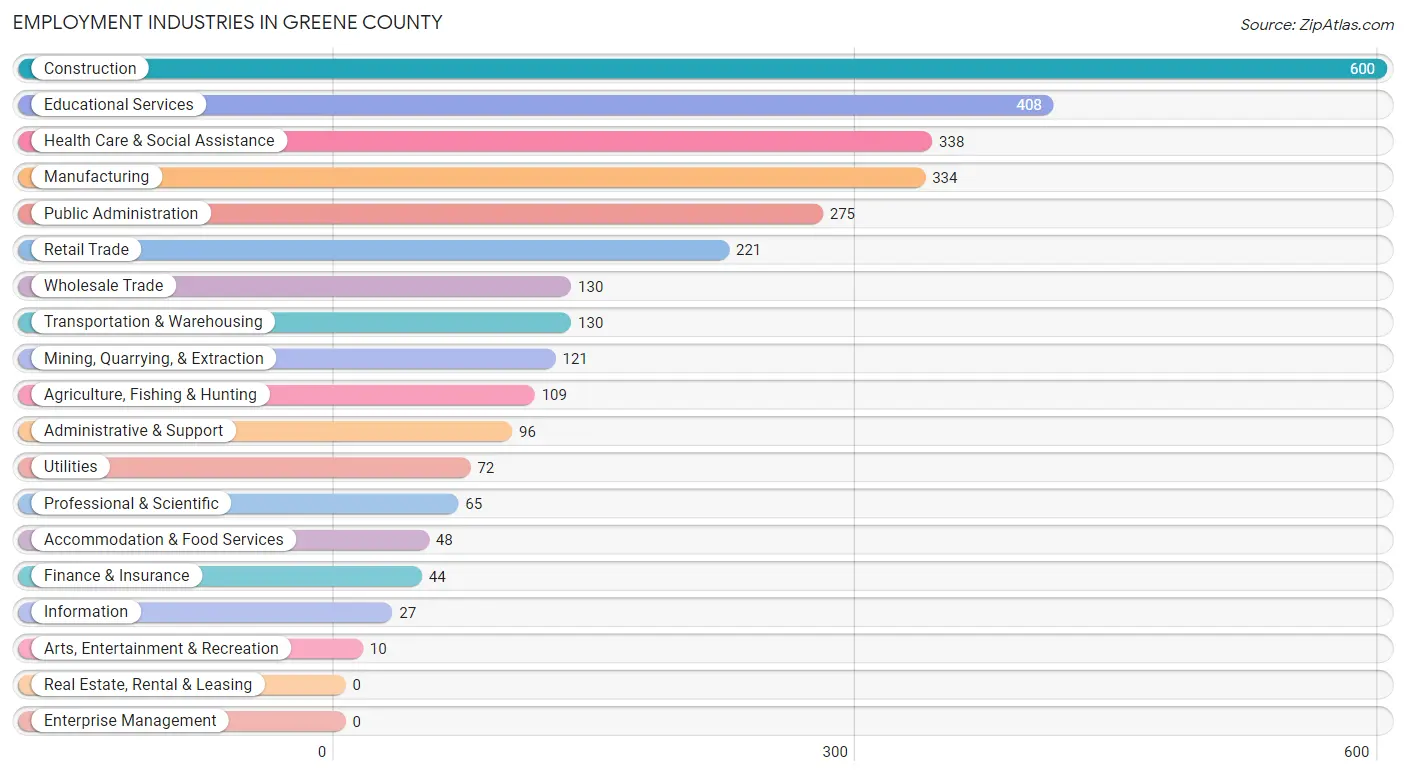
Employment Industries in Greene County
The major employment industries in Greene County include Construction (600 | 18.5%), Educational Services (408 | 12.6%), Health Care & Social Assistance (338 | 10.4%), Manufacturing (334 | 10.3%), and Public Administration (275 | 8.5%).
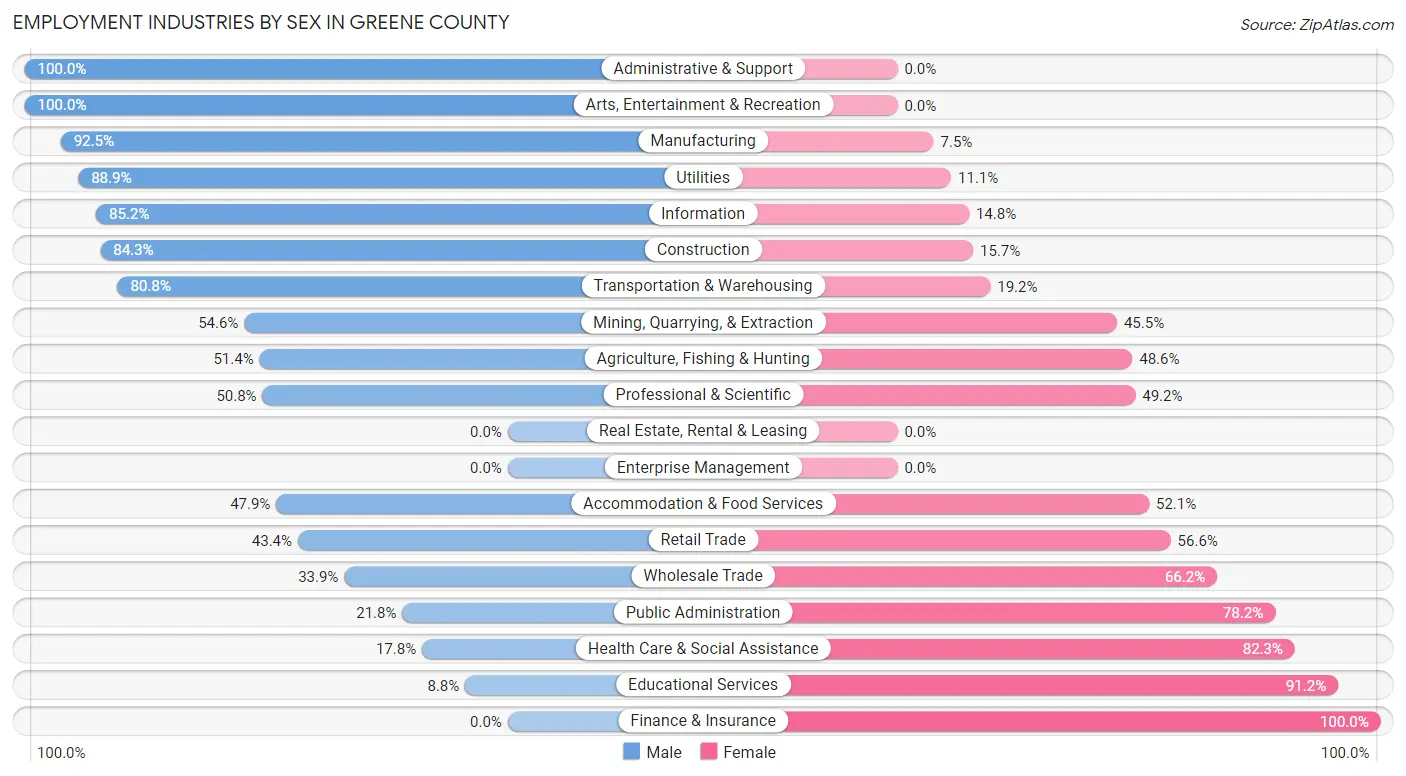
Employment Industries by Sex in Greene County
The Greene County industries that see more men than women are Administrative & Support (100.0%), Arts, Entertainment & Recreation (100.0%), and Manufacturing (92.5%), whereas the industries that tend to have a higher number of women are Finance & Insurance (100.0%), Educational Services (91.2%), and Health Care & Social Assistance (82.3%).
| Industry | Male | Female |
| Agriculture, Fishing & Hunting | 56 (51.4%) | 53 (48.6%) |
| Mining, Quarrying, & Extraction | 66 (54.5%) | 55 (45.5%) |
| Construction | 506 (84.3%) | 94 (15.7%) |
| Manufacturing | 309 (92.5%) | 25 (7.5%) |
| Wholesale Trade | 44 (33.9%) | 86 (66.1%) |
| Retail Trade | 96 (43.4%) | 125 (56.6%) |
| Transportation & Warehousing | 105 (80.8%) | 25 (19.2%) |
| Utilities | 64 (88.9%) | 8 (11.1%) |
| Information | 23 (85.2%) | 4 (14.8%) |
| Finance & Insurance | 0 (0.0%) | 44 (100.0%) |
| Real Estate, Rental & Leasing | 0 (0.0%) | 0 (0.0%) |
| Professional & Scientific | 33 (50.8%) | 32 (49.2%) |
| Enterprise Management | 0 (0.0%) | 0 (0.0%) |
| Administrative & Support | 96 (100.0%) | 0 (0.0%) |
| Educational Services | 36 (8.8%) | 372 (91.2%) |
| Health Care & Social Assistance | 60 (17.7%) | 278 (82.3%) |
| Arts, Entertainment & Recreation | 10 (100.0%) | 0 (0.0%) |
| Accommodation & Food Services | 23 (47.9%) | 25 (52.1%) |
| Public Administration | 60 (21.8%) | 215 (78.2%) |
| Total | 1,650 (50.8%) | 1,597 (49.2%) |
Education in Greene County
School Enrollment in Greene County
The most common levels of schooling among the 2,408 students in Greene County are high school (558 | 23.2%), elementary school (553 | 23.0%), and middle school (526 | 21.8%).
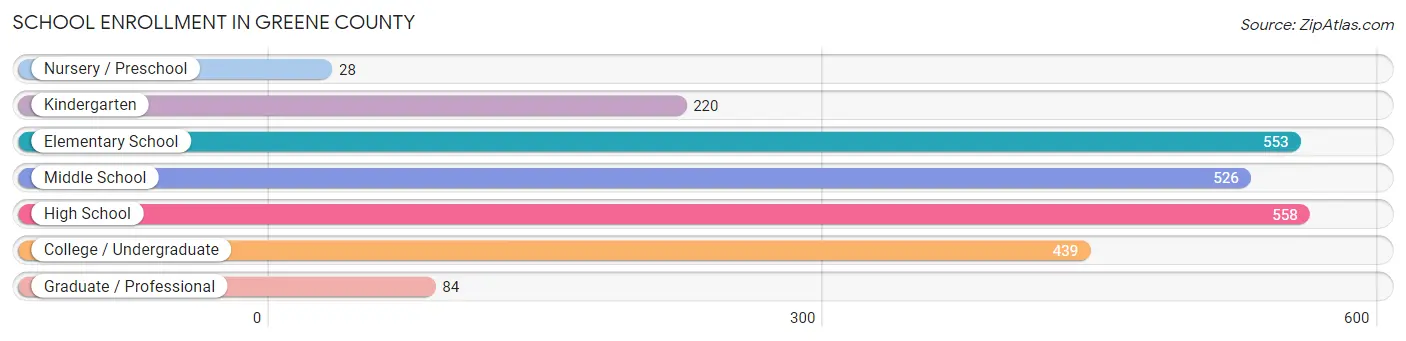
| School Level | # Students | % Students |
| Nursery / Preschool | 28 | 1.2% |
| Kindergarten | 220 | 9.1% |
| Elementary School | 553 | 23.0% |
| Middle School | 526 | 21.8% |
| High School | 558 | 23.2% |
| College / Undergraduate | 439 | 18.2% |
| Graduate / Professional | 84 | 3.5% |
| Total | 2,408 | 100.0% |
School Enrollment by Age by Funding Source in Greene County
Out of a total of 2,408 students who are enrolled in schools in Greene County, 395 (16.4%) attend a private institution, while the remaining 2,013 (83.6%) are enrolled in public schools. The age group of 20 to 24 year olds has the highest likelihood of being enrolled in private schools, with 100 (59.5% in the age bracket) enrolled. Conversely, the age group of 3 to 4 year olds has the lowest likelihood of being enrolled in a private school, with 45 (100.0% in the age bracket) attending a public institution.
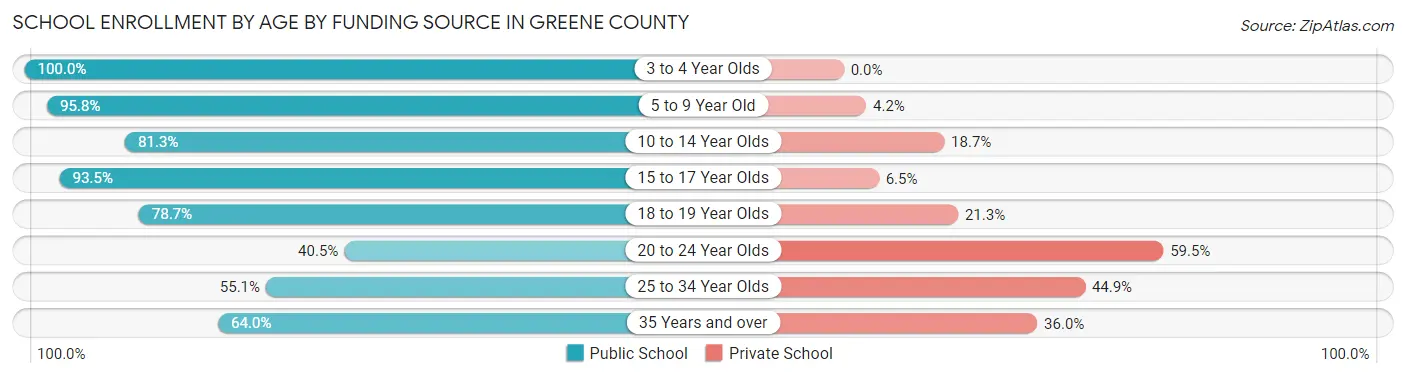
| Age Bracket | Public School | Private School |
| 3 to 4 Year Olds | 45 (100.0%) | 0 (0.0%) |
| 5 to 9 Year Old | 665 (95.8%) | 29 (4.2%) |
| 10 to 14 Year Olds | 482 (81.3%) | 111 (18.7%) |
| 15 to 17 Year Olds | 473 (93.5%) | 33 (6.5%) |
| 18 to 19 Year Olds | 159 (78.7%) | 43 (21.3%) |
| 20 to 24 Year Olds | 68 (40.5%) | 100 (59.5%) |
| 25 to 34 Year Olds | 49 (55.1%) | 40 (44.9%) |
| 35 Years and over | 71 (64.0%) | 40 (36.0%) |
| Total | 2,013 (83.6%) | 395 (16.4%) |
Educational Attainment by Field of Study in Greene County
Education (276 | 23.4%), science & technology (209 | 17.7%), business (205 | 17.4%), arts & humanities (104 | 8.8%), and physical & health sciences (92 | 7.8%) are the most common fields of study among 1,181 individuals in Greene County who have obtained a bachelor's degree or higher.
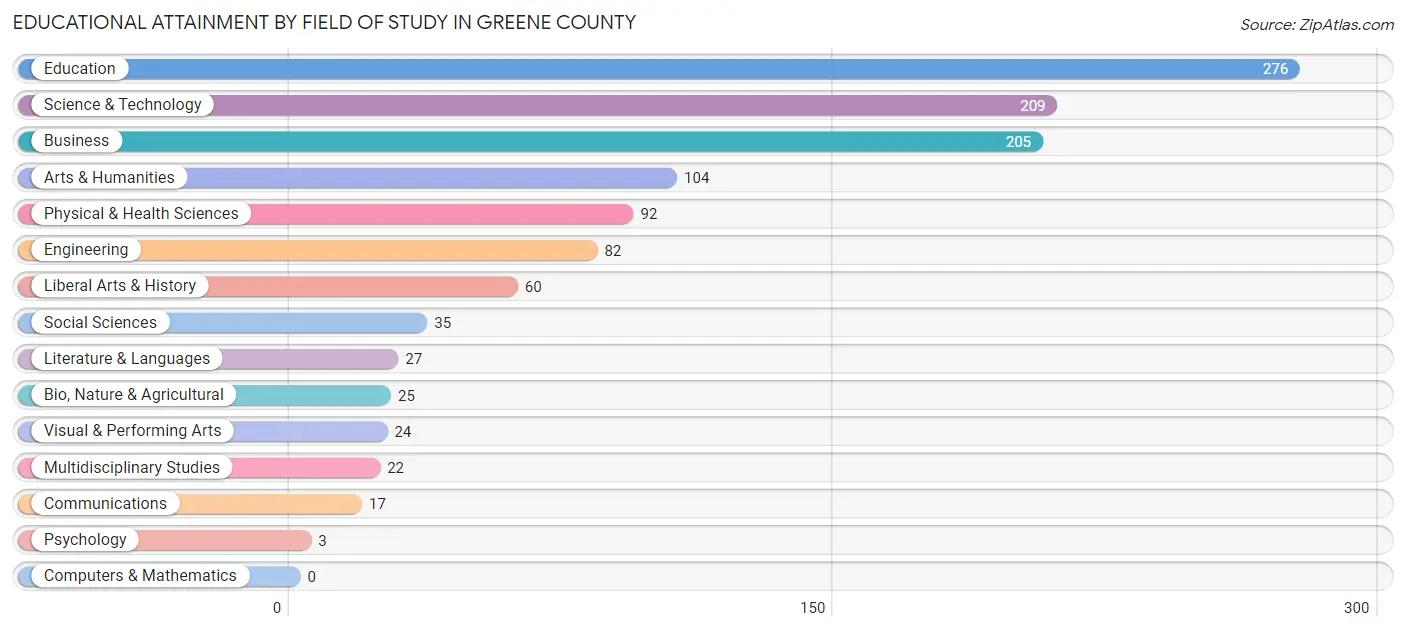
| Field of Study | # Graduates | % Graduates |
| Computers & Mathematics | 0 | 0.0% |
| Bio, Nature & Agricultural | 25 | 2.1% |
| Physical & Health Sciences | 92 | 7.8% |
| Psychology | 3 | 0.3% |
| Social Sciences | 35 | 3.0% |
| Engineering | 82 | 6.9% |
| Multidisciplinary Studies | 22 | 1.9% |
| Science & Technology | 209 | 17.7% |
| Business | 205 | 17.4% |
| Education | 276 | 23.4% |
| Literature & Languages | 27 | 2.3% |
| Liberal Arts & History | 60 | 5.1% |
| Visual & Performing Arts | 24 | 2.0% |
| Communications | 17 | 1.4% |
| Arts & Humanities | 104 | 8.8% |
| Total | 1,181 | 100.0% |
Transportation & Commute in Greene County
Vehicle Availability by Sex in Greene County
The most prevalent vehicle ownership categories in Greene County are males with 3 vehicles (583, accounting for 36.0%) and females with 3 vehicles (385, making up 36.5%).
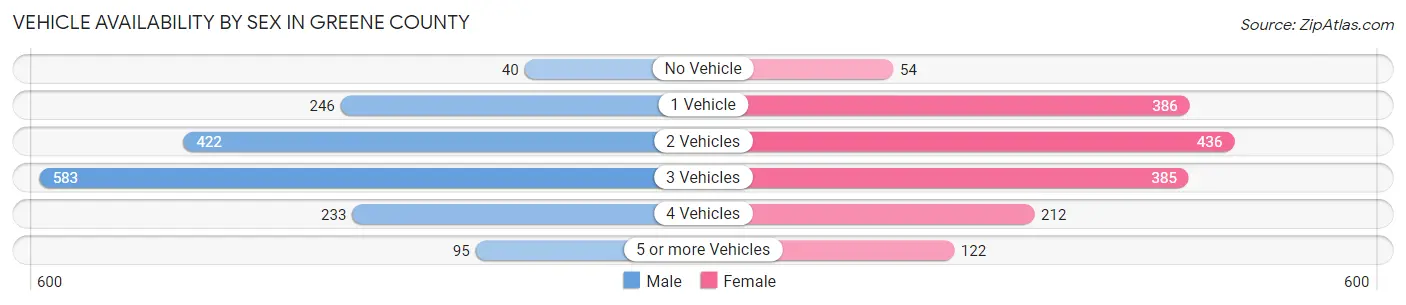
| Vehicles Available | Male | Female |
| No Vehicle | 40 (2.5%) | 54 (3.4%) |
| 1 Vehicle | 246 (15.2%) | 386 (24.2%) |
| 2 Vehicles | 422 (26.1%) | 436 (27.3%) |
| 3 Vehicles | 583 (36.0%) | 385 (24.1%) |
| 4 Vehicles | 233 (14.4%) | 212 (13.3%) |
| 5 or more Vehicles | 95 (5.9%) | 122 (7.6%) |
| Total | 1,619 (100.0%) | 1,595 (100.0%) |
Commute Time in Greene County
The most frequently occuring commute durations in Greene County are 60 to 89 minutes (479 commuters, 15.6%), 15 to 19 minutes (476 commuters, 15.5%), and 45 to 59 minutes (445 commuters, 14.5%).
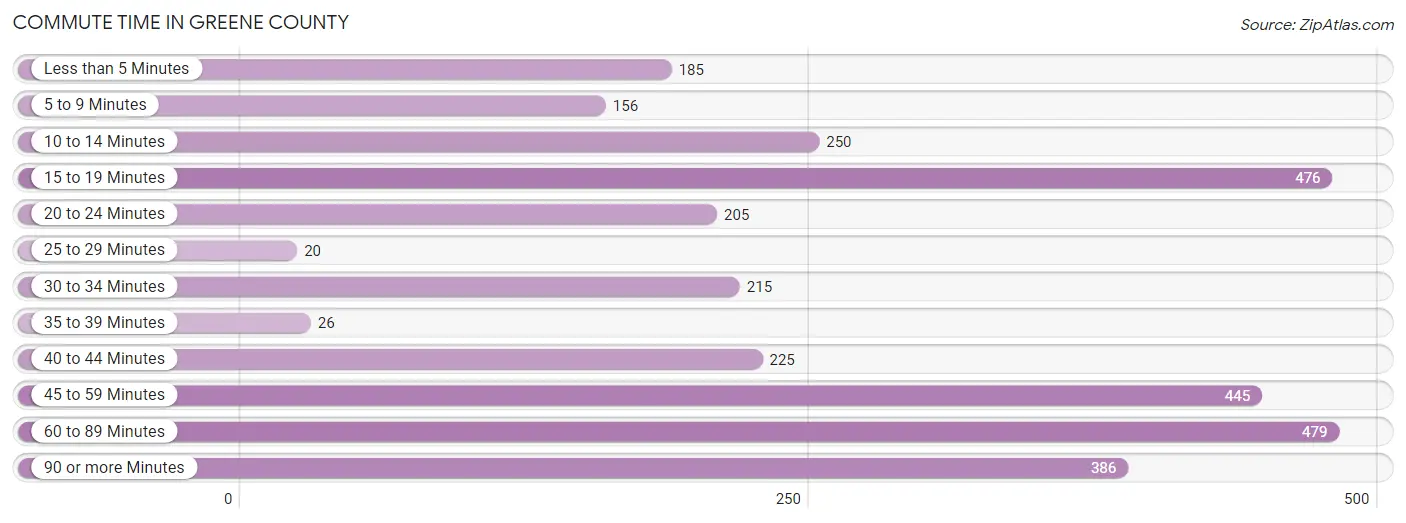
| Commute Time | # Commuters | % Commuters |
| Less than 5 Minutes | 185 | 6.0% |
| 5 to 9 Minutes | 156 | 5.1% |
| 10 to 14 Minutes | 250 | 8.2% |
| 15 to 19 Minutes | 476 | 15.5% |
| 20 to 24 Minutes | 205 | 6.7% |
| 25 to 29 Minutes | 20 | 0.6% |
| 30 to 34 Minutes | 215 | 7.0% |
| 35 to 39 Minutes | 26 | 0.9% |
| 40 to 44 Minutes | 225 | 7.3% |
| 45 to 59 Minutes | 445 | 14.5% |
| 60 to 89 Minutes | 479 | 15.6% |
| 90 or more Minutes | 386 | 12.6% |
Commute Time by Sex in Greene County
The most common commute times in Greene County are 60 to 89 minutes (330 commuters, 21.9%) for males and 15 to 19 minutes (395 commuters, 25.3%) for females.
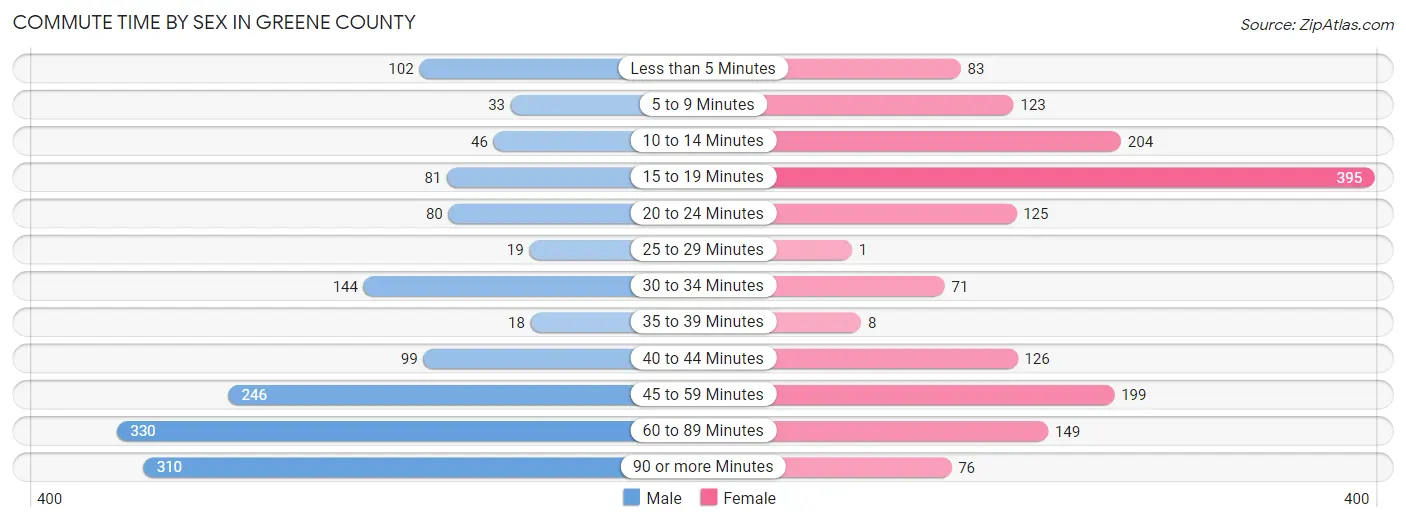
| Commute Time | Male | Female |
| Less than 5 Minutes | 102 (6.8%) | 83 (5.3%) |
| 5 to 9 Minutes | 33 (2.2%) | 123 (7.9%) |
| 10 to 14 Minutes | 46 (3.0%) | 204 (13.1%) |
| 15 to 19 Minutes | 81 (5.4%) | 395 (25.3%) |
| 20 to 24 Minutes | 80 (5.3%) | 125 (8.0%) |
| 25 to 29 Minutes | 19 (1.3%) | 1 (0.1%) |
| 30 to 34 Minutes | 144 (9.6%) | 71 (4.5%) |
| 35 to 39 Minutes | 18 (1.2%) | 8 (0.5%) |
| 40 to 44 Minutes | 99 (6.6%) | 126 (8.1%) |
| 45 to 59 Minutes | 246 (16.3%) | 199 (12.8%) |
| 60 to 89 Minutes | 330 (21.9%) | 149 (9.6%) |
| 90 or more Minutes | 310 (20.6%) | 76 (4.9%) |
Time of Departure to Work by Sex in Greene County
The most frequent times of departure to work in Greene County are 6:00 AM to 6:29 AM (233, 15.4%) for males and 7:00 AM to 7:29 AM (344, 22.1%) for females.
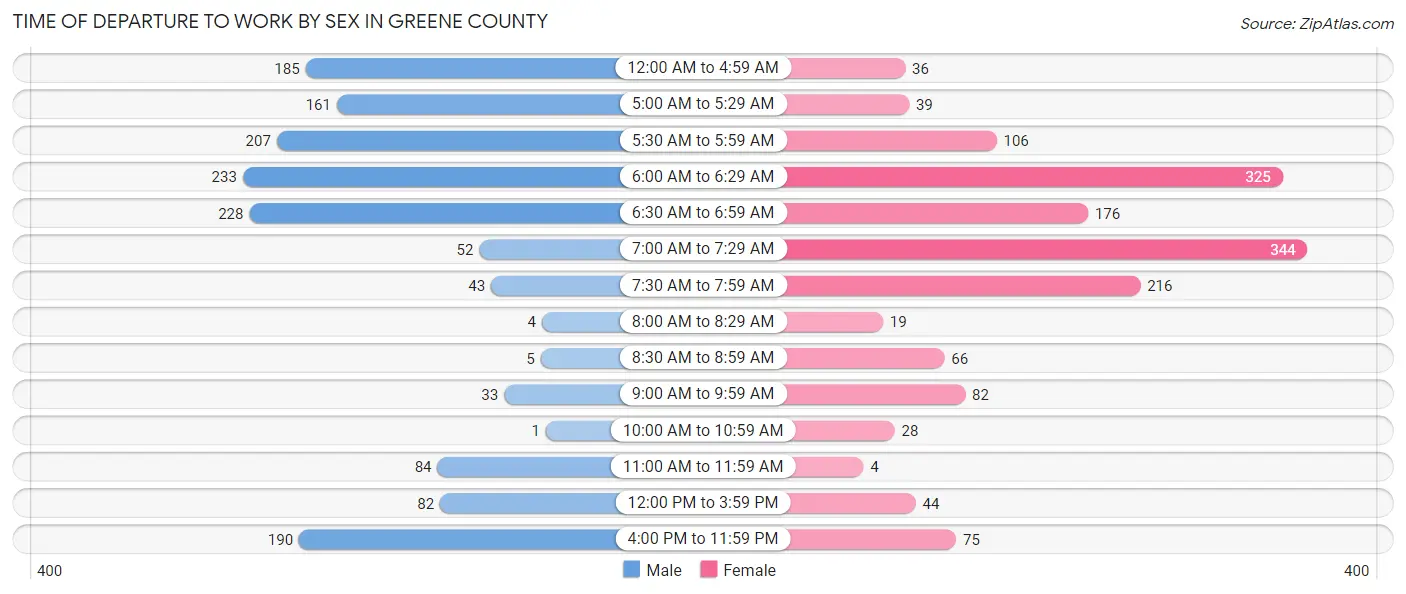
| Time of Departure | Male | Female |
| 12:00 AM to 4:59 AM | 185 (12.3%) | 36 (2.3%) |
| 5:00 AM to 5:29 AM | 161 (10.7%) | 39 (2.5%) |
| 5:30 AM to 5:59 AM | 207 (13.7%) | 106 (6.8%) |
| 6:00 AM to 6:29 AM | 233 (15.4%) | 325 (20.8%) |
| 6:30 AM to 6:59 AM | 228 (15.1%) | 176 (11.3%) |
| 7:00 AM to 7:29 AM | 52 (3.5%) | 344 (22.1%) |
| 7:30 AM to 7:59 AM | 43 (2.9%) | 216 (13.9%) |
| 8:00 AM to 8:29 AM | 4 (0.3%) | 19 (1.2%) |
| 8:30 AM to 8:59 AM | 5 (0.3%) | 66 (4.2%) |
| 9:00 AM to 9:59 AM | 33 (2.2%) | 82 (5.3%) |
| 10:00 AM to 10:59 AM | 1 (0.1%) | 28 (1.8%) |
| 11:00 AM to 11:59 AM | 84 (5.6%) | 4 (0.3%) |
| 12:00 PM to 3:59 PM | 82 (5.4%) | 44 (2.8%) |
| 4:00 PM to 11:59 PM | 190 (12.6%) | 75 (4.8%) |
| Total | 1,508 (100.0%) | 1,560 (100.0%) |
Housing Occupancy in Greene County
Occupancy by Ownership in Greene County
Of the total 3,910 dwellings in Greene County, owner-occupied units account for 2,978 (76.2%), while renter-occupied units make up 932 (23.8%).
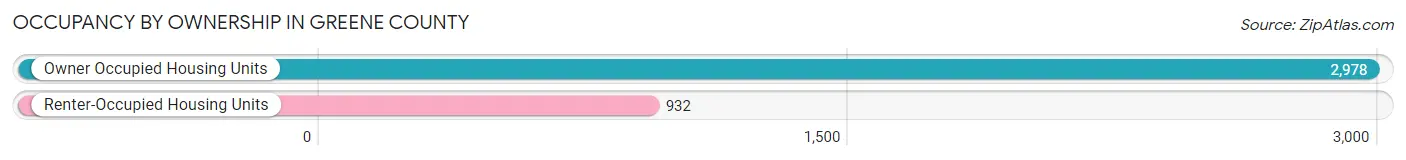
| Occupancy | # Housing Units | % Housing Units |
| Owner Occupied Housing Units | 2,978 | 76.2% |
| Renter-Occupied Housing Units | 932 | 23.8% |
| Total Occupied Housing Units | 3,910 | 100.0% |
Occupancy by Household Size in Greene County
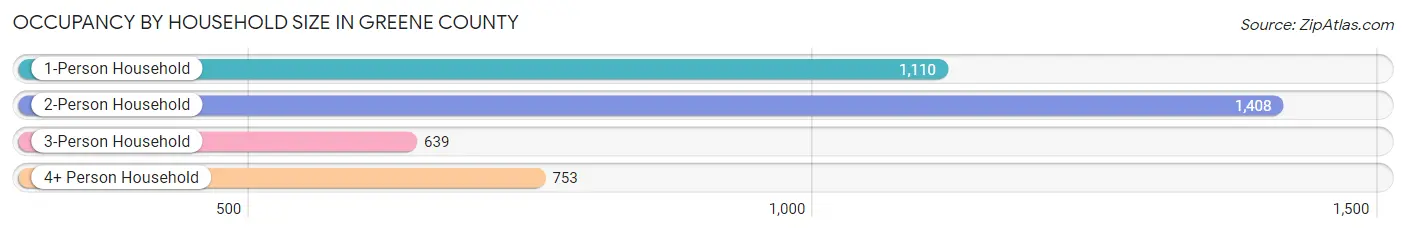
| Household Size | # Housing Units | % Housing Units |
| 1-Person Household | 1,110 | 28.4% |
| 2-Person Household | 1,408 | 36.0% |
| 3-Person Household | 639 | 16.3% |
| 4+ Person Household | 753 | 19.3% |
| Total Housing Units | 3,910 | 100.0% |
Occupancy by Ownership by Household Size in Greene County
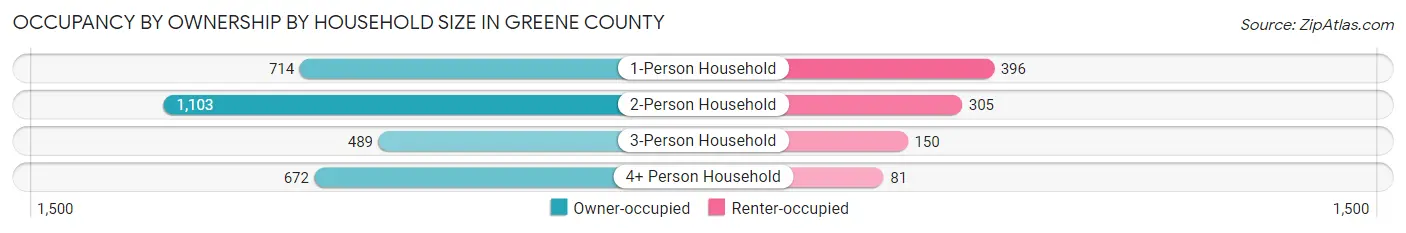
| Household Size | Owner-occupied | Renter-occupied |
| 1-Person Household | 714 (64.3%) | 396 (35.7%) |
| 2-Person Household | 1,103 (78.3%) | 305 (21.7%) |
| 3-Person Household | 489 (76.5%) | 150 (23.5%) |
| 4+ Person Household | 672 (89.2%) | 81 (10.8%) |
| Total Housing Units | 2,978 (76.2%) | 932 (23.8%) |
Occupancy by Educational Attainment in Greene County
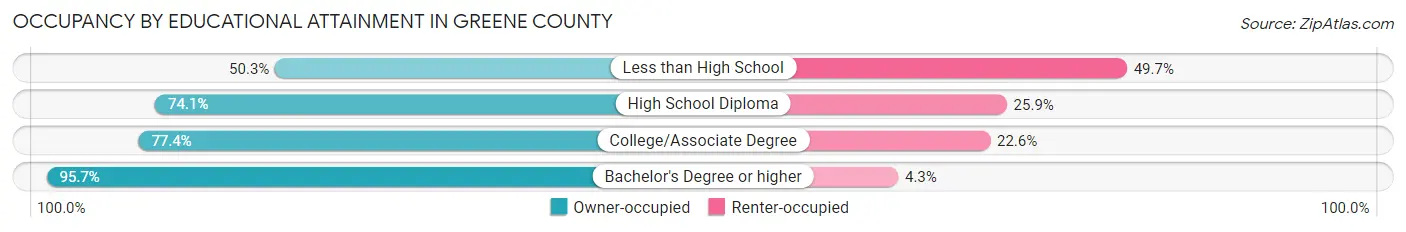
| Household Size | Owner-occupied | Renter-occupied |
| Less than High School | 157 (50.3%) | 155 (49.7%) |
| High School Diploma | 1,192 (74.1%) | 416 (25.9%) |
| College/Associate Degree | 1,166 (77.4%) | 340 (22.6%) |
| Bachelor's Degree or higher | 463 (95.7%) | 21 (4.3%) |
Occupancy by Age of Householder in Greene County
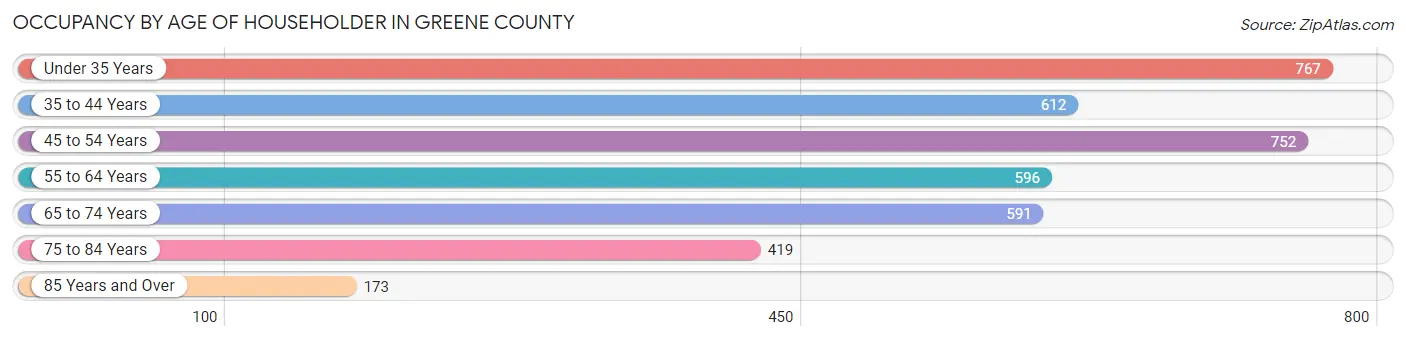
| Age Bracket | # Households | % Households |
| Under 35 Years | 767 | 19.6% |
| 35 to 44 Years | 612 | 15.7% |
| 45 to 54 Years | 752 | 19.2% |
| 55 to 64 Years | 596 | 15.2% |
| 65 to 74 Years | 591 | 15.1% |
| 75 to 84 Years | 419 | 10.7% |
| 85 Years and Over | 173 | 4.4% |
| Total | 3,910 | 100.0% |
Housing Finances in Greene County
Median Income by Occupancy in Greene County
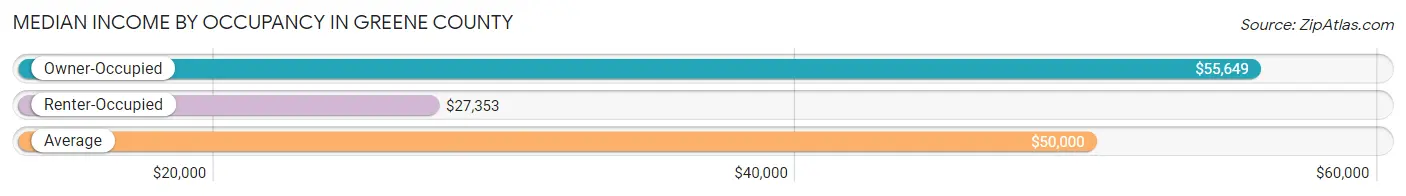
| Occupancy Type | # Households | Median Income |
| Owner-Occupied | 2,978 (76.2%) | $55,649 |
| Renter-Occupied | 932 (23.8%) | $27,353 |
| Average | 3,910 (100.0%) | $50,000 |
Occupancy by Householder Income Bracket in Greene County
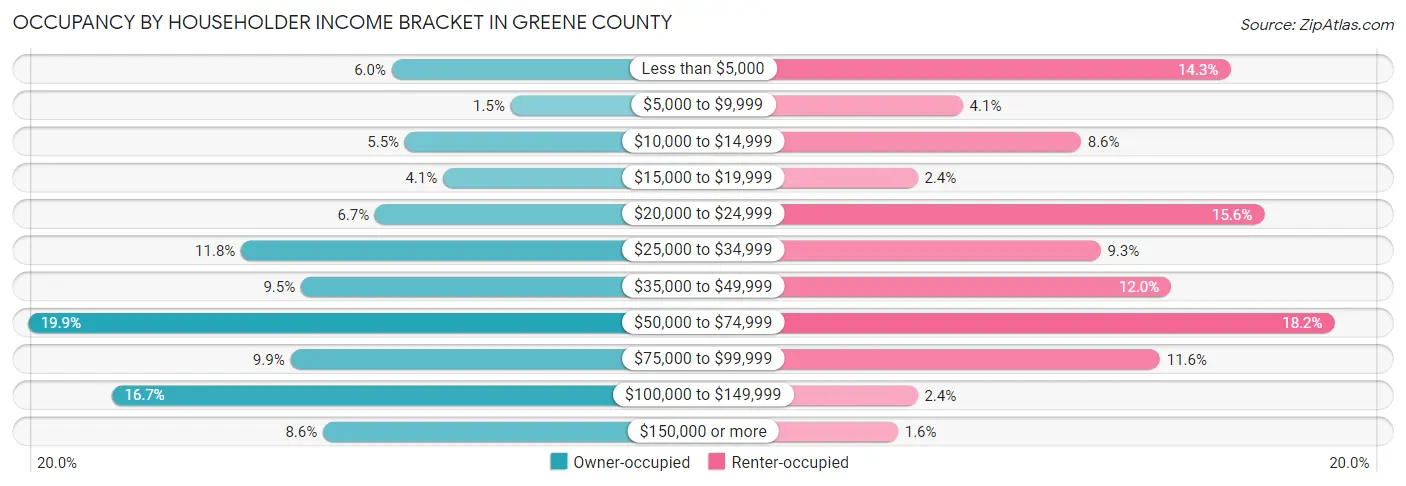
| Income Bracket | Owner-occupied | Renter-occupied |
| Less than $5,000 | 179 (6.0%) | 133 (14.3%) |
| $5,000 to $9,999 | 44 (1.5%) | 38 (4.1%) |
| $10,000 to $14,999 | 164 (5.5%) | 80 (8.6%) |
| $15,000 to $19,999 | 121 (4.1%) | 22 (2.4%) |
| $20,000 to $24,999 | 198 (6.7%) | 145 (15.6%) |
| $25,000 to $34,999 | 350 (11.7%) | 87 (9.3%) |
| $35,000 to $49,999 | 282 (9.5%) | 112 (12.0%) |
| $50,000 to $74,999 | 592 (19.9%) | 170 (18.2%) |
| $75,000 to $99,999 | 294 (9.9%) | 108 (11.6%) |
| $100,000 to $149,999 | 497 (16.7%) | 22 (2.4%) |
| $150,000 or more | 257 (8.6%) | 15 (1.6%) |
| Total | 2,978 (100.0%) | 932 (100.0%) |
Monthly Housing Cost Tiers in Greene County
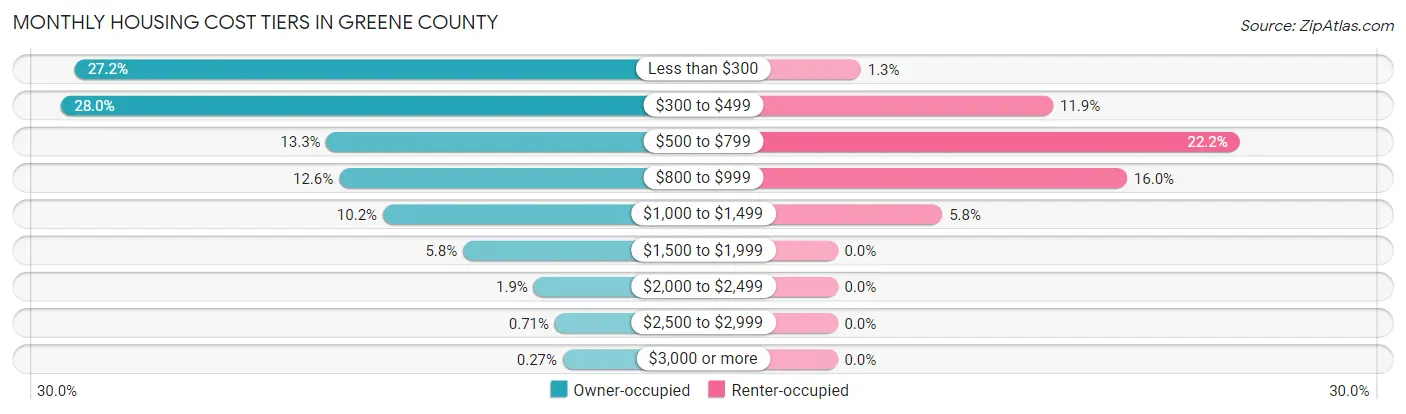
| Monthly Cost | Owner-occupied | Renter-occupied |
| Less than $300 | 811 (27.2%) | 12 (1.3%) |
| $300 to $499 | 833 (28.0%) | 111 (11.9%) |
| $500 to $799 | 397 (13.3%) | 207 (22.2%) |
| $800 to $999 | 376 (12.6%) | 149 (16.0%) |
| $1,000 to $1,499 | 304 (10.2%) | 54 (5.8%) |
| $1,500 to $1,999 | 172 (5.8%) | 0 (0.0%) |
| $2,000 to $2,499 | 56 (1.9%) | 0 (0.0%) |
| $2,500 to $2,999 | 21 (0.7%) | 0 (0.0%) |
| $3,000 or more | 8 (0.3%) | 0 (0.0%) |
| Total | 2,978 (100.0%) | 932 (100.0%) |
Physical Housing Characteristics in Greene County
Housing Structures in Greene County
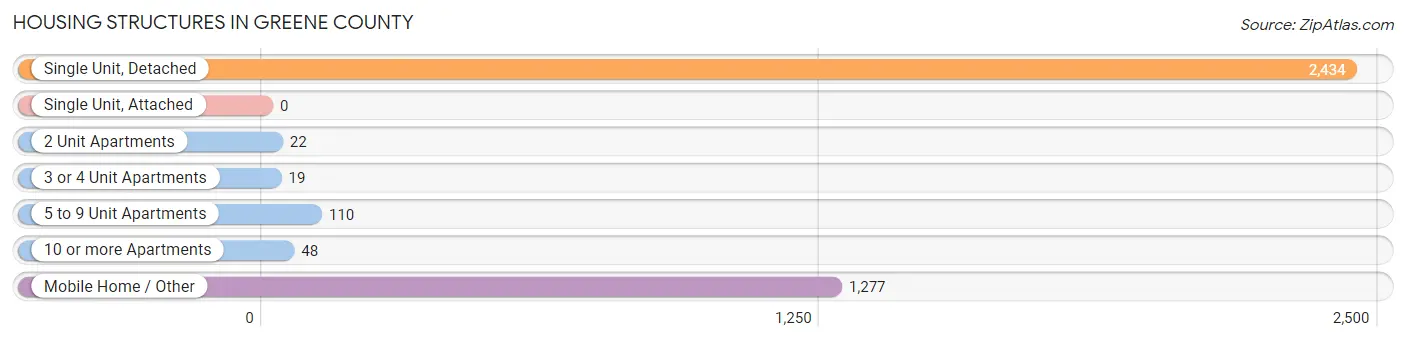
| Structure Type | # Housing Units | % Housing Units |
| Single Unit, Detached | 2,434 | 62.3% |
| Single Unit, Attached | 0 | 0.0% |
| 2 Unit Apartments | 22 | 0.6% |
| 3 or 4 Unit Apartments | 19 | 0.5% |
| 5 to 9 Unit Apartments | 110 | 2.8% |
| 10 or more Apartments | 48 | 1.2% |
| Mobile Home / Other | 1,277 | 32.7% |
| Total | 3,910 | 100.0% |
Housing Structures by Occupancy in Greene County
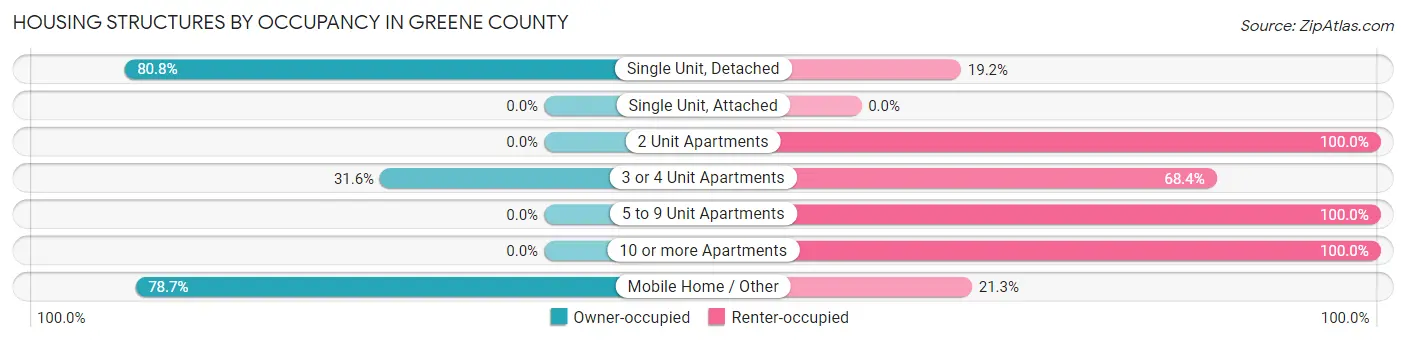
| Structure Type | Owner-occupied | Renter-occupied |
| Single Unit, Detached | 1,967 (80.8%) | 467 (19.2%) |
| Single Unit, Attached | 0 (0.0%) | 0 (0.0%) |
| 2 Unit Apartments | 0 (0.0%) | 22 (100.0%) |
| 3 or 4 Unit Apartments | 6 (31.6%) | 13 (68.4%) |
| 5 to 9 Unit Apartments | 0 (0.0%) | 110 (100.0%) |
| 10 or more Apartments | 0 (0.0%) | 48 (100.0%) |
| Mobile Home / Other | 1,005 (78.7%) | 272 (21.3%) |
| Total | 2,978 (76.2%) | 932 (23.8%) |
Housing Structures by Number of Rooms in Greene County
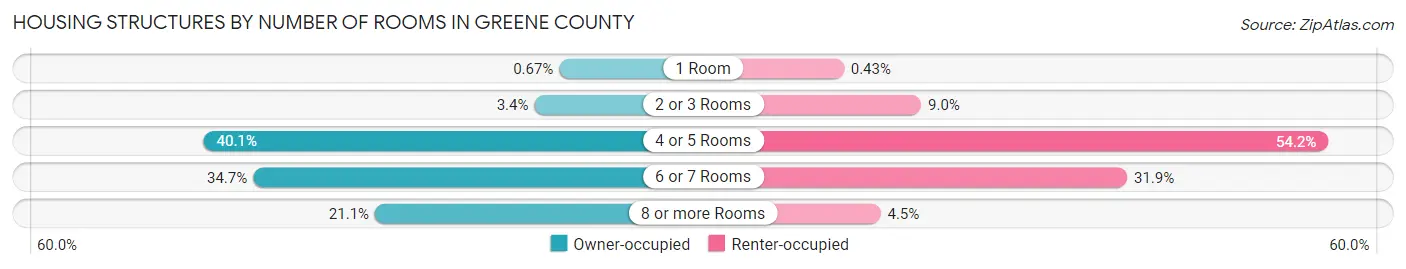
| Number of Rooms | Owner-occupied | Renter-occupied |
| 1 Room | 20 (0.7%) | 4 (0.4%) |
| 2 or 3 Rooms | 102 (3.4%) | 84 (9.0%) |
| 4 or 5 Rooms | 1,195 (40.1%) | 505 (54.2%) |
| 6 or 7 Rooms | 1,032 (34.6%) | 297 (31.9%) |
| 8 or more Rooms | 629 (21.1%) | 42 (4.5%) |
| Total | 2,978 (100.0%) | 932 (100.0%) |
Housing Structure by Heating Type in Greene County
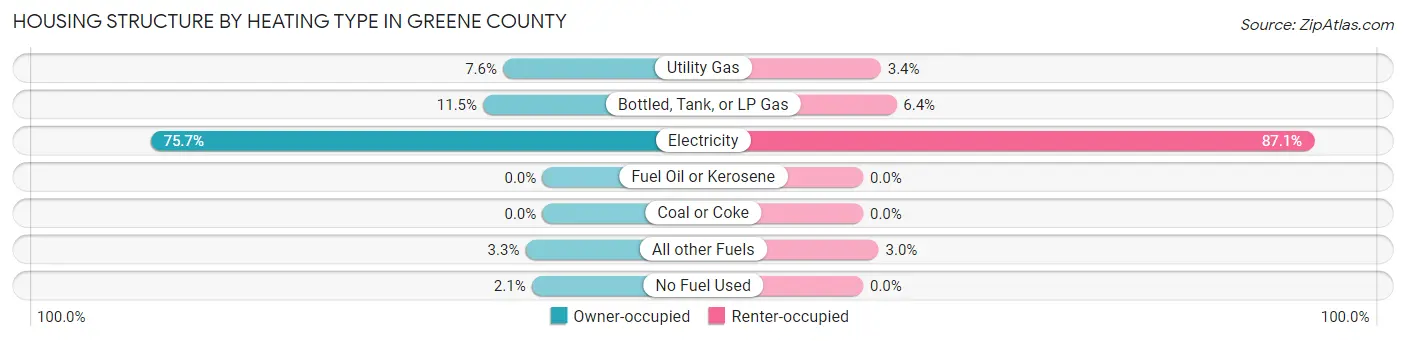
| Heating Type | Owner-occupied | Renter-occupied |
| Utility Gas | 226 (7.6%) | 32 (3.4%) |
| Bottled, Tank, or LP Gas | 341 (11.5%) | 60 (6.4%) |
| Electricity | 2,253 (75.6%) | 812 (87.1%) |
| Fuel Oil or Kerosene | 0 (0.0%) | 0 (0.0%) |
| Coal or Coke | 0 (0.0%) | 0 (0.0%) |
| All other Fuels | 97 (3.3%) | 28 (3.0%) |
| No Fuel Used | 61 (2.1%) | 0 (0.0%) |
| Total | 2,978 (100.0%) | 932 (100.0%) |
Household Vehicle Usage in Greene County
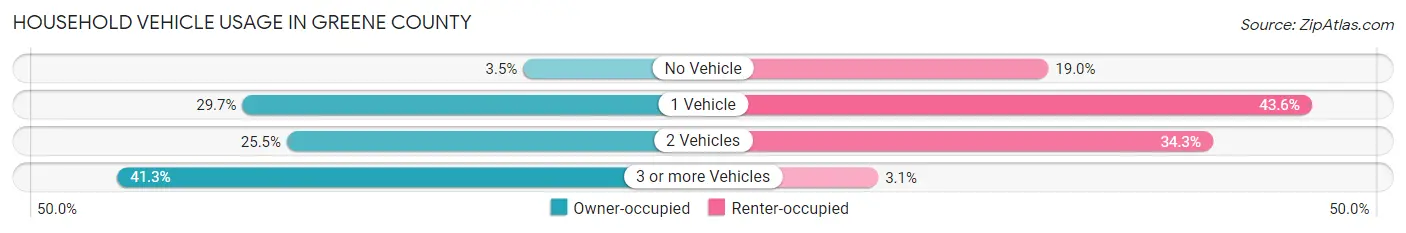
| Vehicles per Household | Owner-occupied | Renter-occupied |
| No Vehicle | 103 (3.5%) | 177 (19.0%) |
| 1 Vehicle | 884 (29.7%) | 406 (43.6%) |
| 2 Vehicles | 760 (25.5%) | 320 (34.3%) |
| 3 or more Vehicles | 1,231 (41.3%) | 29 (3.1%) |
| Total | 2,978 (100.0%) | 932 (100.0%) |
Real Estate & Mortgages in Greene County
Real Estate and Mortgage Overview in Greene County
| Characteristic | Without Mortgage | With Mortgage |
| Housing Units | 1,992 | 986 |
| Median Property Value | $95,300 | $112,500 |
| Median Household Income | $53,393 | $110 |
| Monthly Housing Costs | $367 | $8 |
| Real Estate Taxes | $757 | $102 |
Property Value by Mortgage Status in Greene County
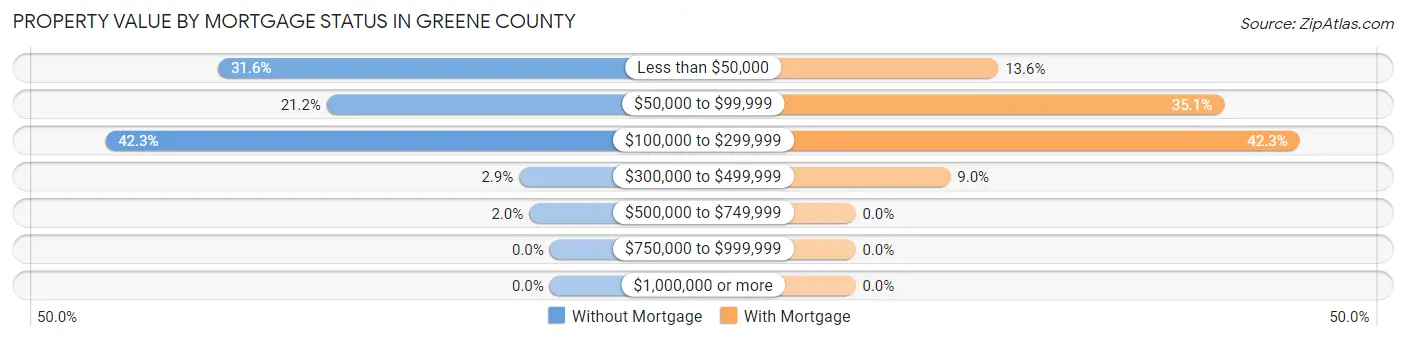
| Property Value | Without Mortgage | With Mortgage |
| Less than $50,000 | 629 (31.6%) | 134 (13.6%) |
| $50,000 to $99,999 | 423 (21.2%) | 346 (35.1%) |
| $100,000 to $299,999 | 843 (42.3%) | 417 (42.3%) |
| $300,000 to $499,999 | 58 (2.9%) | 89 (9.0%) |
| $500,000 to $749,999 | 39 (2.0%) | 0 (0.0%) |
| $750,000 to $999,999 | 0 (0.0%) | 0 (0.0%) |
| $1,000,000 or more | 0 (0.0%) | 0 (0.0%) |
| Total | 1,992 (100.0%) | 986 (100.0%) |
Household Income by Mortgage Status in Greene County
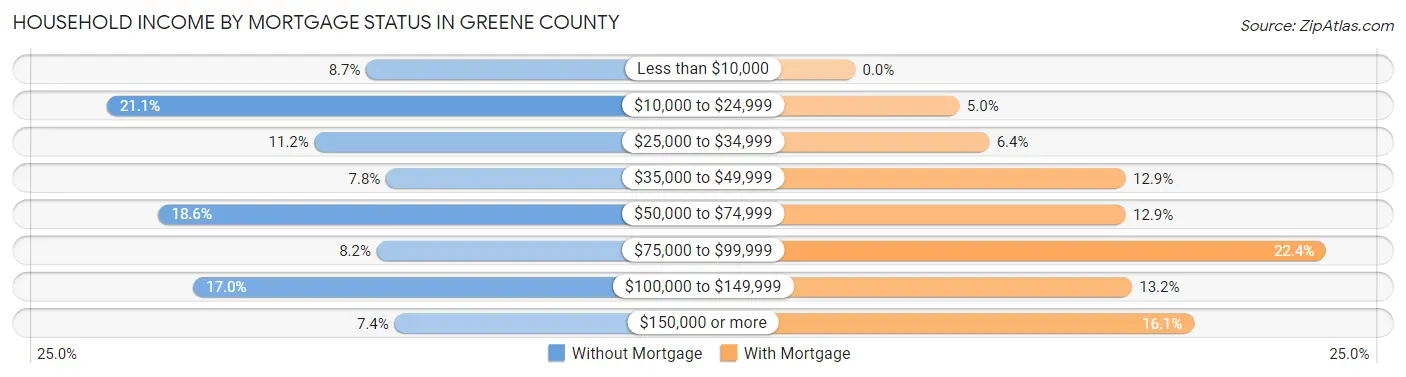
| Household Income | Without Mortgage | With Mortgage |
| Less than $10,000 | 174 (8.7%) | 0 (0.0%) |
| $10,000 to $24,999 | 420 (21.1%) | 49 (5.0%) |
| $25,000 to $34,999 | 223 (11.2%) | 63 (6.4%) |
| $35,000 to $49,999 | 155 (7.8%) | 127 (12.9%) |
| $50,000 to $74,999 | 371 (18.6%) | 127 (12.9%) |
| $75,000 to $99,999 | 164 (8.2%) | 221 (22.4%) |
| $100,000 to $149,999 | 338 (17.0%) | 130 (13.2%) |
| $150,000 or more | 147 (7.4%) | 159 (16.1%) |
| Total | 1,992 (100.0%) | 986 (100.0%) |
Property Value to Household Income Ratio in Greene County
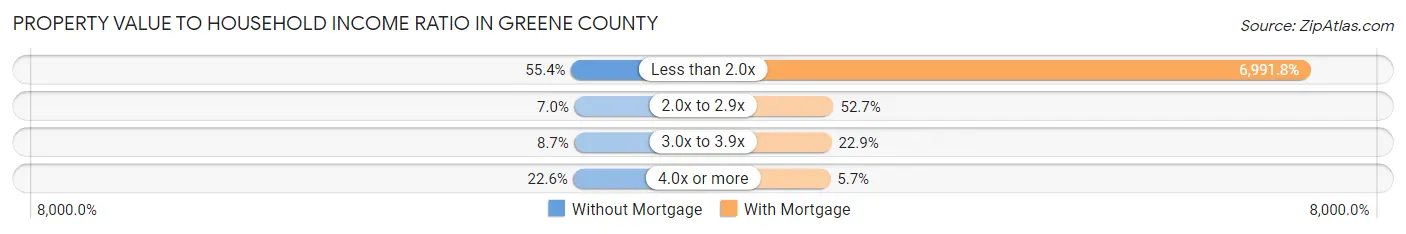
| Value-to-Income Ratio | Without Mortgage | With Mortgage |
| Less than 2.0x | 1,103 (55.4%) | 68,939 (6,991.8%) |
| 2.0x to 2.9x | 139 (7.0%) | 520 (52.7%) |
| 3.0x to 3.9x | 174 (8.7%) | 226 (22.9%) |
| 4.0x or more | 451 (22.6%) | 56 (5.7%) |
| Total | 1,992 (100.0%) | 986 (100.0%) |
Real Estate Taxes by Mortgage Status in Greene County
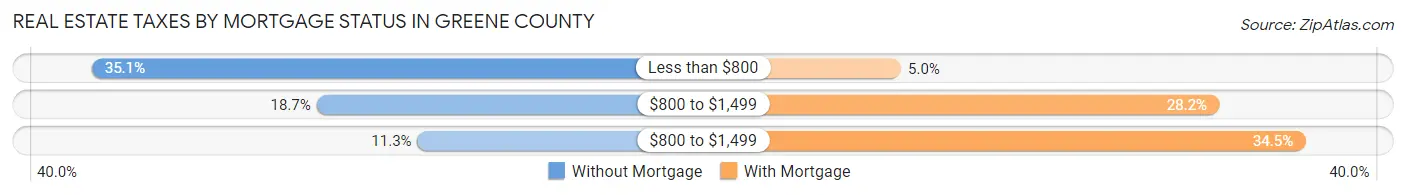
| Property Taxes | Without Mortgage | With Mortgage |
| Less than $800 | 699 (35.1%) | 49 (5.0%) |
| $800 to $1,499 | 372 (18.7%) | 278 (28.2%) |
| $800 to $1,499 | 225 (11.3%) | 340 (34.5%) |
| Total | 1,992 (100.0%) | 986 (100.0%) |
Health & Disability in Greene County
Health Insurance Coverage by Age in Greene County
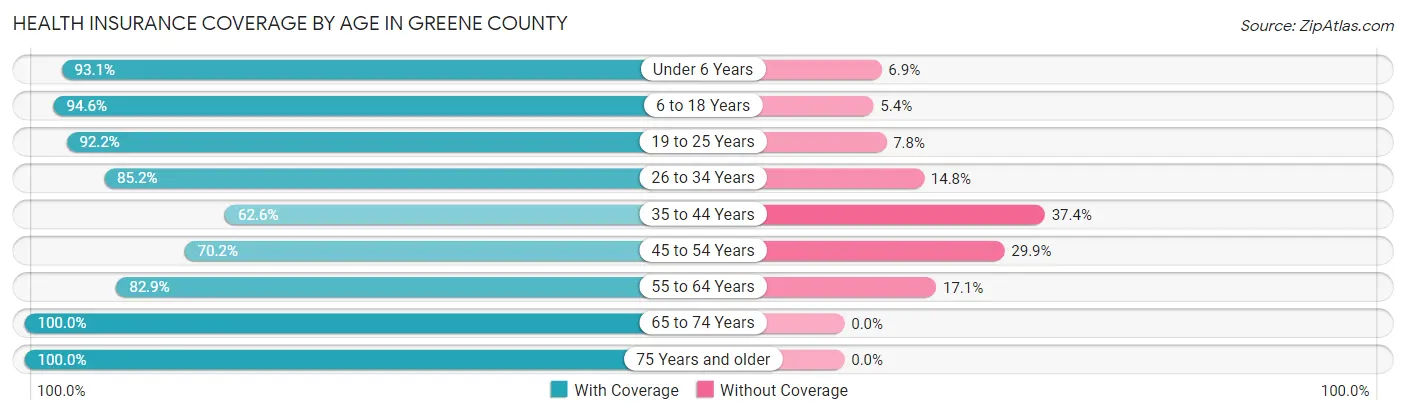
| Age Bracket | With Coverage | Without Coverage |
| Under 6 Years | 780 (93.1%) | 58 (6.9%) |
| 6 to 18 Years | 1,707 (94.6%) | 98 (5.4%) |
| 19 to 25 Years | 873 (92.2%) | 74 (7.8%) |
| 26 to 34 Years | 947 (85.2%) | 165 (14.8%) |
| 35 to 44 Years | 769 (62.6%) | 459 (37.4%) |
| 45 to 54 Years | 839 (70.2%) | 357 (29.8%) |
| 55 to 64 Years | 901 (82.9%) | 186 (17.1%) |
| 65 to 74 Years | 974 (100.0%) | 0 (0.0%) |
| 75 Years and older | 735 (100.0%) | 0 (0.0%) |
| Total | 8,525 (85.9%) | 1,397 (14.1%) |
Health Insurance Coverage by Citizenship Status in Greene County
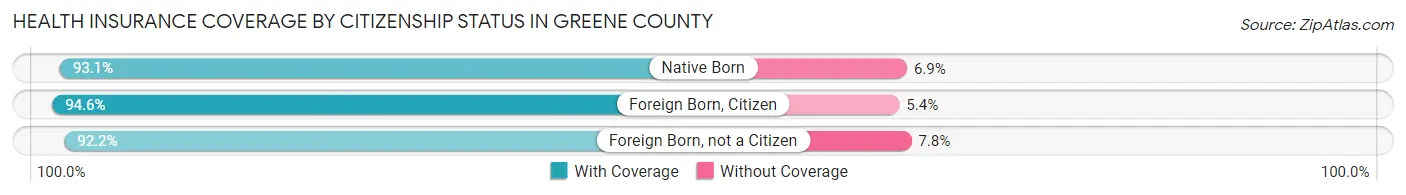
| Citizenship Status | With Coverage | Without Coverage |
| Native Born | 780 (93.1%) | 58 (6.9%) |
| Foreign Born, Citizen | 1,707 (94.6%) | 98 (5.4%) |
| Foreign Born, not a Citizen | 873 (92.2%) | 74 (7.8%) |
Health Insurance Coverage by Household Income in Greene County
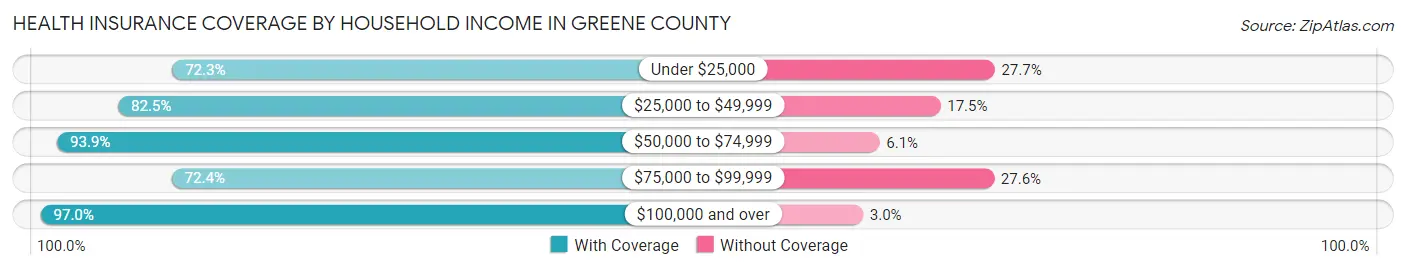
| Household Income | With Coverage | Without Coverage |
| Under $25,000 | 1,464 (72.3%) | 560 (27.7%) |
| $25,000 to $49,999 | 1,371 (82.5%) | 291 (17.5%) |
| $50,000 to $74,999 | 1,771 (93.9%) | 115 (6.1%) |
| $75,000 to $99,999 | 886 (72.4%) | 337 (27.6%) |
| $100,000 and over | 3,033 (97.0%) | 94 (3.0%) |
Public vs Private Health Insurance Coverage by Age in Greene County
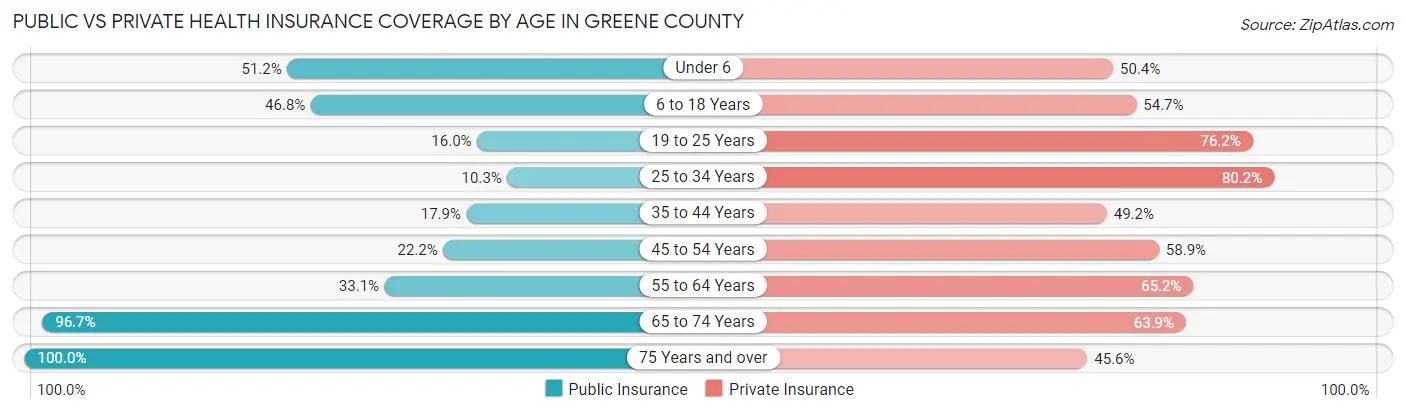
| Age Bracket | Public Insurance | Private Insurance |
| Under 6 | 429 (51.2%) | 422 (50.4%) |
| 6 to 18 Years | 845 (46.8%) | 987 (54.7%) |
| 19 to 25 Years | 151 (16.0%) | 722 (76.2%) |
| 25 to 34 Years | 115 (10.3%) | 892 (80.2%) |
| 35 to 44 Years | 220 (17.9%) | 604 (49.2%) |
| 45 to 54 Years | 266 (22.2%) | 704 (58.9%) |
| 55 to 64 Years | 360 (33.1%) | 709 (65.2%) |
| 65 to 74 Years | 942 (96.7%) | 622 (63.9%) |
| 75 Years and over | 735 (100.0%) | 335 (45.6%) |
| Total | 4,063 (40.9%) | 5,997 (60.4%) |
Disability Status by Sex by Age in Greene County
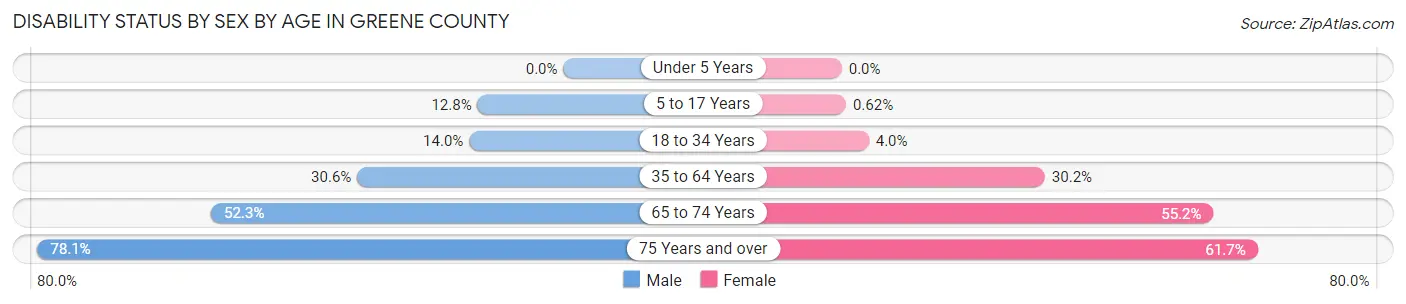
| Age Bracket | Male | Female |
| Under 5 Years | 0 (0.0%) | 0 (0.0%) |
| 5 to 17 Years | 133 (12.8%) | 5 (0.6%) |
| 18 to 34 Years | 165 (14.0%) | 39 (4.0%) |
| 35 to 64 Years | 413 (30.6%) | 652 (30.2%) |
| 65 to 74 Years | 226 (52.3%) | 299 (55.2%) |
| 75 Years and over | 221 (78.1%) | 279 (61.7%) |
Disability Class by Sex by Age in Greene County
Disability Class: Hearing Difficulty
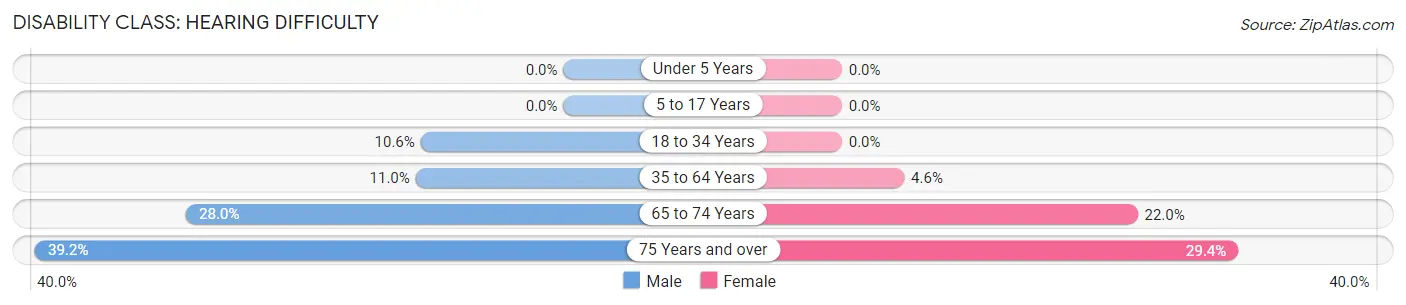
| Age Bracket | Male | Female |
| Under 5 Years | 0 (0.0%) | 0 (0.0%) |
| 5 to 17 Years | 0 (0.0%) | 0 (0.0%) |
| 18 to 34 Years | 125 (10.6%) | 0 (0.0%) |
| 35 to 64 Years | 148 (11.0%) | 100 (4.6%) |
| 65 to 74 Years | 121 (28.0%) | 119 (22.0%) |
| 75 Years and over | 111 (39.2%) | 133 (29.4%) |
Disability Class: Vision Difficulty
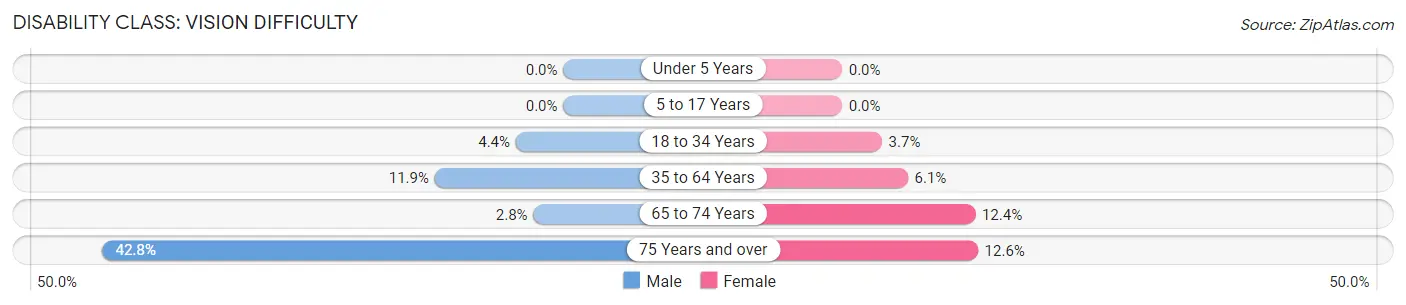
| Age Bracket | Male | Female |
| Under 5 Years | 0 (0.0%) | 0 (0.0%) |
| 5 to 17 Years | 0 (0.0%) | 0 (0.0%) |
| 18 to 34 Years | 52 (4.4%) | 36 (3.7%) |
| 35 to 64 Years | 161 (11.9%) | 132 (6.1%) |
| 65 to 74 Years | 12 (2.8%) | 67 (12.4%) |
| 75 Years and over | 121 (42.8%) | 57 (12.6%) |
Disability Class: Cognitive Difficulty
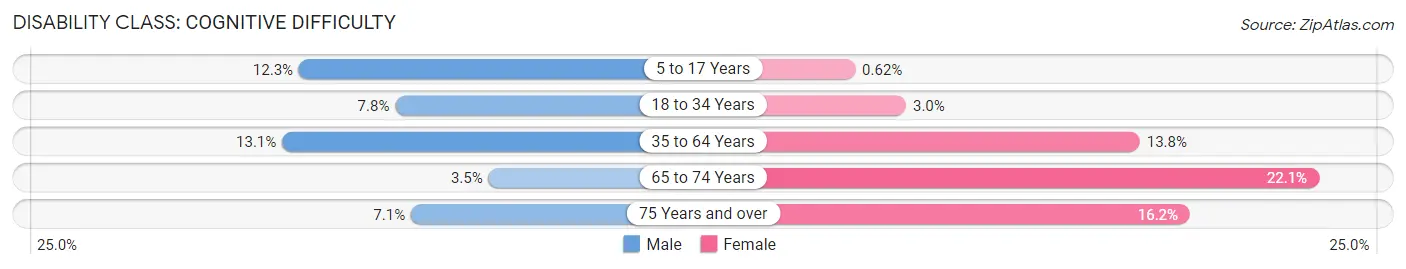
| Age Bracket | Male | Female |
| 5 to 17 Years | 128 (12.3%) | 5 (0.6%) |
| 18 to 34 Years | 92 (7.8%) | 29 (3.0%) |
| 35 to 64 Years | 176 (13.1%) | 299 (13.8%) |
| 65 to 74 Years | 15 (3.5%) | 120 (22.1%) |
| 75 Years and over | 20 (7.1%) | 73 (16.2%) |
Disability Class: Ambulatory Difficulty
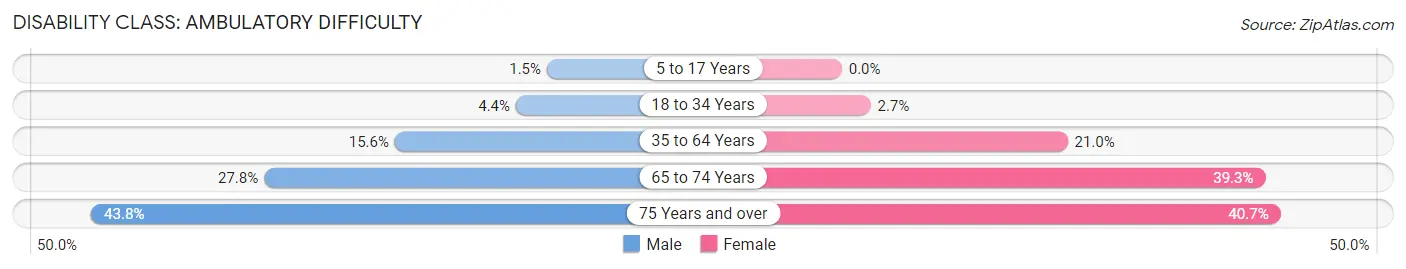
| Age Bracket | Male | Female |
| 5 to 17 Years | 16 (1.5%) | 0 (0.0%) |
| 18 to 34 Years | 52 (4.4%) | 26 (2.7%) |
| 35 to 64 Years | 211 (15.6%) | 453 (20.9%) |
| 65 to 74 Years | 120 (27.8%) | 213 (39.3%) |
| 75 Years and over | 124 (43.8%) | 184 (40.7%) |
Disability Class: Self-Care Difficulty
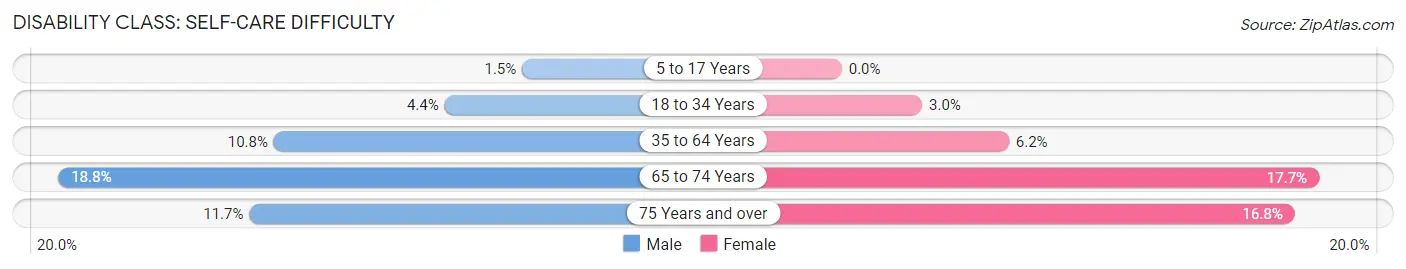
| Age Bracket | Male | Female |
| 5 to 17 Years | 16 (1.5%) | 0 (0.0%) |
| 18 to 34 Years | 52 (4.4%) | 29 (3.0%) |
| 35 to 64 Years | 145 (10.7%) | 134 (6.2%) |
| 65 to 74 Years | 81 (18.8%) | 96 (17.7%) |
| 75 Years and over | 33 (11.7%) | 76 (16.8%) |
Technology Access in Greene County
Computing Device Access in Greene County
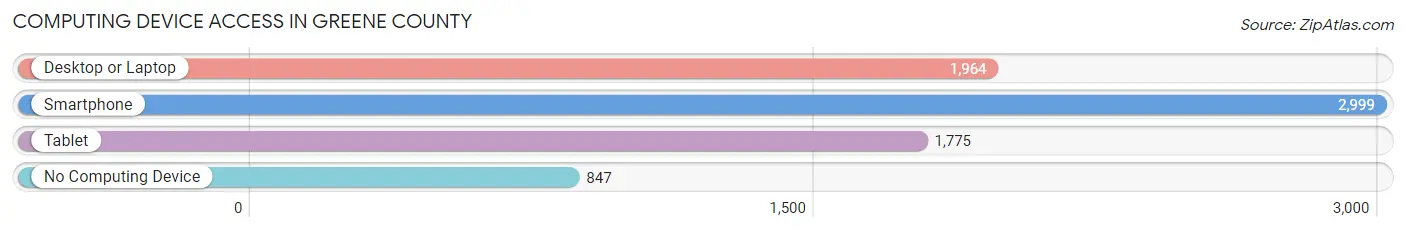
| Device Type | # Households | % Households |
| Desktop or Laptop | 1,964 | 50.2% |
| Smartphone | 2,999 | 76.7% |
| Tablet | 1,775 | 45.4% |
| No Computing Device | 847 | 21.7% |
| Total | 3,910 | 100.0% |
Internet Access in Greene County
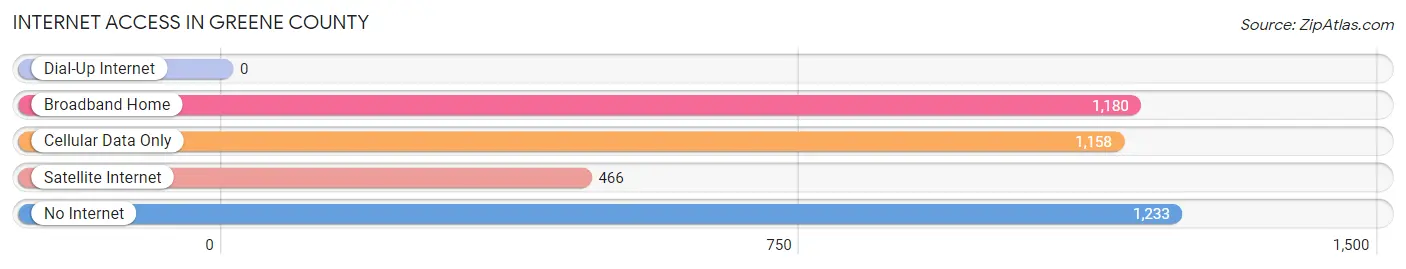
| Internet Type | # Households | % Households |
| Dial-Up Internet | 0 | 0.0% |
| Broadband Home | 1,180 | 30.2% |
| Cellular Data Only | 1,158 | 29.6% |
| Satellite Internet | 466 | 11.9% |
| No Internet | 1,233 | 31.5% |
| Total | 3,910 | 100.0% |
Greene County Summary
Greene County is located in the southeastern corner of Mississippi, and is bordered by the states of Alabama and Louisiana. It is part of the Mississippi Delta region, and is known for its rich agricultural heritage. The county was established in 1811, and is named after Revolutionary War hero General Nathanael Greene.
Geography
Greene County covers an area of 576 square miles, and is located in the southeastern corner of Mississippi. It is bordered by the states of Alabama and Louisiana, and is part of the Mississippi Delta region. The county is mostly flat, with some rolling hills in the northern part. The main rivers in the county are the Big Black River, the Little Sunflower River, and the Yazoo River. The county is also home to several lakes, including Lake Mary Crawford, Lake George, and Lake Washington.
The climate in Greene County is humid subtropical, with hot, humid summers and mild winters. The average annual temperature is around 70 degrees Fahrenheit, and the average annual precipitation is around 50 inches.
Economy
Agriculture is the main economic driver in Greene County. The county is known for its rich agricultural heritage, and is home to a variety of crops, including cotton, soybeans, corn, and wheat. The county is also home to several large poultry farms, and is a major producer of eggs and poultry products.
In addition to agriculture, Greene County is home to several manufacturing companies, including a furniture factory, a paper mill, and a plastics plant. The county is also home to several retail stores, restaurants, and other businesses.
Demographics
As of the 2010 census, Greene County had a population of 14,400. The population is mostly white (77.3%), with African Americans making up the majority of the remaining population (20.2%). The median household income in the county is $35,000, and the median age is 38.
The county is home to several small towns, including Leakesville, State Line, and McLain. The county seat is Leakesville, which is home to the Greene County Courthouse.
Conclusion
Greene County is a rural county located in the southeastern corner of Mississippi. It is known for its rich agricultural heritage, and is home to a variety of crops, poultry farms, and manufacturing companies. The county has a population of 14,400, and the median household income is $35,000. Greene County is a great place to live and work, and is a great example of the rural Mississippi Delta region.
Common Questions
What is Per Capita Income in Greene County?
Per Capita income in Greene County is $18,257.
What is the Median Family Income in Greene County?
Median Family Income in Greene County is $63,668.
What is the Median Household income in Greene County?
Median Household Income in Greene County is $50,000.
What is Income or Wage Gap in Greene County?
Income or Wage Gap in Greene County is 47.9%.
Women in Greene County earn 52.1 cents for every dollar earned by a man.
What is Inequality or Gini Index in Greene County?
Inequality or Gini Index in Greene County is 0.47.
What is the Total Population of Greene County?
Total Population of Greene County is 13,672.
What is the Total Male Population of Greene County?
Total Male Population of Greene County is 8,378.
What is the Total Female Population of Greene County?
Total Female Population of Greene County is 5,294.
What is the Ratio of Males per 100 Females in Greene County?
There are 158.25 Males per 100 Females in Greene County.
What is the Ratio of Females per 100 Males in Greene County?
There are 63.19 Females per 100 Males in Greene County.
What is the Median Population Age in Greene County?
Median Population Age in Greene County is 39.7 Years.
What is the Average Family Size in Greene County
Average Family Size in Greene County is 3.1 People.
What is the Average Household Size in Greene County
Average Household Size in Greene County is 2.5 People.
How Large is the Labor Force in Greene County?
There are 3,711 People in the Labor Forcein in Greene County.
What is the Percentage of People in the Labor Force in Greene County?
32.2% of People are in the Labor Force in Greene County.
What is the Unemployment Rate in Greene County?
Unemployment Rate in Greene County is 12.6%.