Covington County, MS Map & Demographics
Covington County Map
Covington County Overview
$24,147
PER CAPITA INCOME
$51,913
AVG FAMILY INCOME
$40,164
AVG HOUSEHOLD INCOME
29.1%
WAGE / INCOME GAP [ % ]
70.9¢/ $1
WAGE / INCOME GAP [ $ ]
$12,267
FAMILY INCOME DEFICIT
0.49
INEQUALITY / GINI INDEX
18,323
TOTAL POPULATION
9,001
MALE POPULATION
9,322
FEMALE POPULATION
96.56
MALES / 100 FEMALES
103.57
FEMALES / 100 MALES
37.8
MEDIAN AGE
3.2
AVG FAMILY SIZE
2.6
AVG HOUSEHOLD SIZE
7,603
LABOR FORCE [ PEOPLE ]
53.4%
PERCENT IN LABOR FORCE
5.8%
UNEMPLOYMENT RATE
Income in Covington County
Income Overview in Covington County
Per Capita Income in Covington County is $24,147, while median incomes of families and households are $51,913 and $40,164 respectively.
| Characteristic | Number | Measure |
| Per Capita Income | 18,323 | $24,147 |
| Median Family Income | 4,732 | $51,913 |
| Mean Family Income | 4,732 | $69,018 |
| Median Household Income | 6,954 | $40,164 |
| Mean Household Income | 6,954 | $58,449 |
| Income Deficit | 4,732 | $12,267 |
| Wage / Income Gap (%) | 18,323 | 29.06% |
| Wage / Income Gap ($) | 18,323 | 70.94¢ per $1 |
| Gini / Inequality Index | 18,323 | 0.49 |
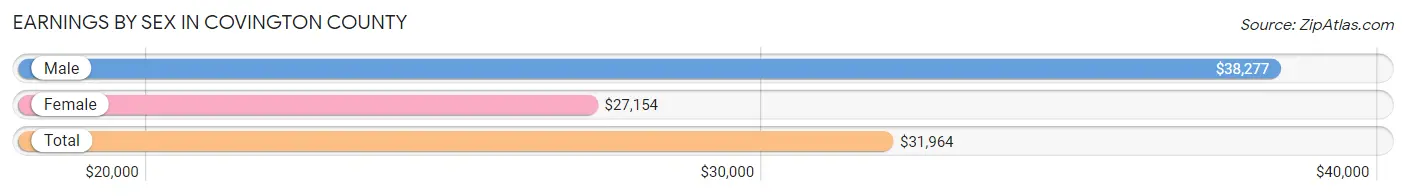
Earnings by Sex in Covington County
Average Earnings in Covington County are $31,964, $38,277 for men and $27,154 for women, a difference of 29.1%.
| Sex | Number | Average Earnings |
| Male | 4,161 (51.9%) | $38,277 |
| Female | 3,852 (48.1%) | $27,154 |
| Total | 8,013 (100.0%) | $31,964 |
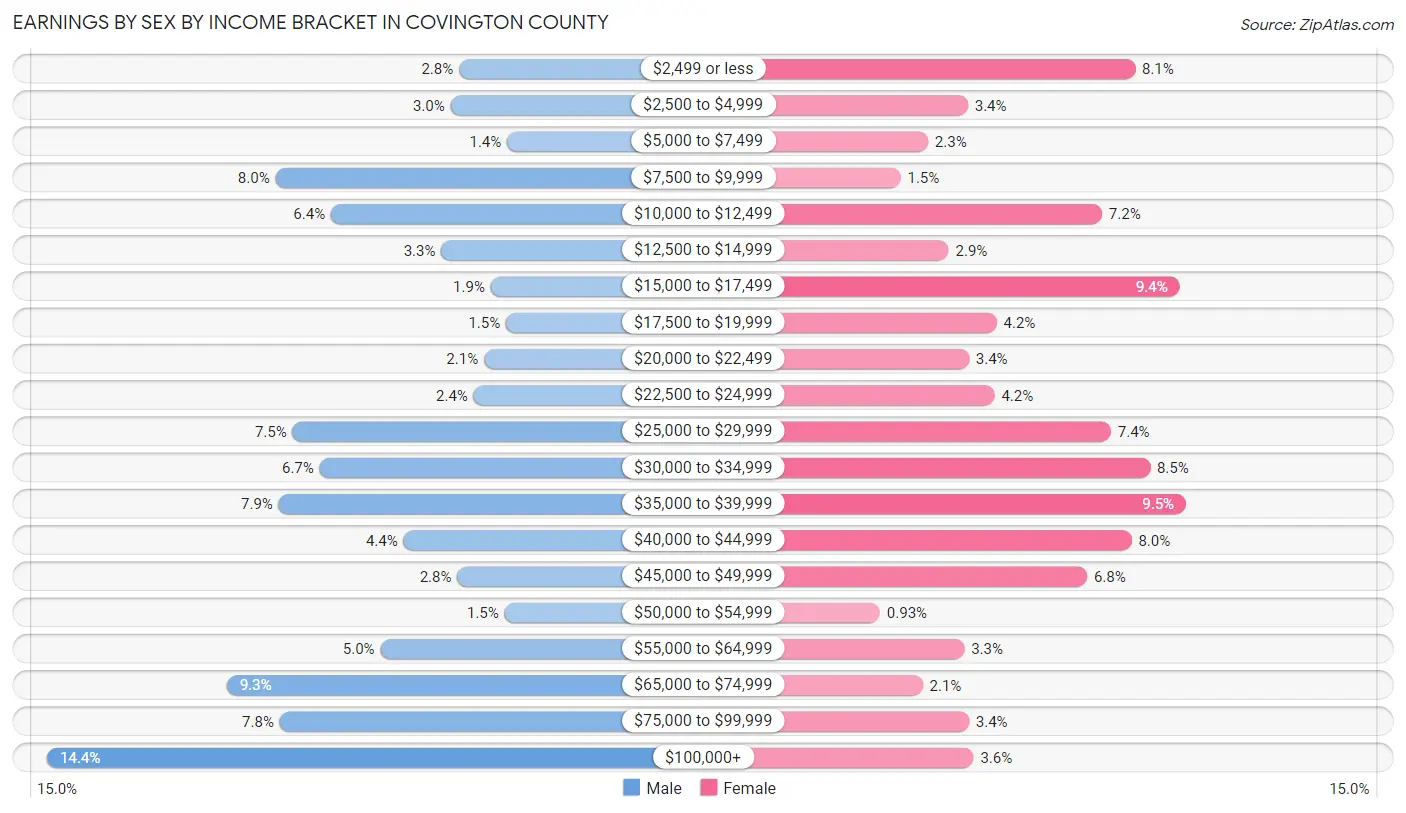
Earnings by Sex by Income Bracket in Covington County
The most common earnings brackets in Covington County are $100,000+ for men (598 | 14.4%) and $35,000 to $39,999 for women (367 | 9.5%).
| Income | Male | Female |
| $2,499 or less | 116 (2.8%) | 312 (8.1%) |
| $2,500 to $4,999 | 126 (3.0%) | 131 (3.4%) |
| $5,000 to $7,499 | 60 (1.4%) | 88 (2.3%) |
| $7,500 to $9,999 | 331 (8.0%) | 58 (1.5%) |
| $10,000 to $12,499 | 266 (6.4%) | 276 (7.2%) |
| $12,500 to $14,999 | 137 (3.3%) | 110 (2.9%) |
| $15,000 to $17,499 | 79 (1.9%) | 360 (9.3%) |
| $17,500 to $19,999 | 61 (1.5%) | 162 (4.2%) |
| $20,000 to $22,499 | 87 (2.1%) | 132 (3.4%) |
| $22,500 to $24,999 | 99 (2.4%) | 160 (4.2%) |
| $25,000 to $29,999 | 311 (7.5%) | 286 (7.4%) |
| $30,000 to $34,999 | 279 (6.7%) | 328 (8.5%) |
| $35,000 to $39,999 | 327 (7.9%) | 367 (9.5%) |
| $40,000 to $44,999 | 181 (4.3%) | 308 (8.0%) |
| $45,000 to $49,999 | 118 (2.8%) | 260 (6.8%) |
| $50,000 to $54,999 | 63 (1.5%) | 36 (0.9%) |
| $55,000 to $64,999 | 208 (5.0%) | 127 (3.3%) |
| $65,000 to $74,999 | 388 (9.3%) | 82 (2.1%) |
| $75,000 to $99,999 | 326 (7.8%) | 132 (3.4%) |
| $100,000+ | 598 (14.4%) | 137 (3.6%) |
| Total | 4,161 (100.0%) | 3,852 (100.0%) |
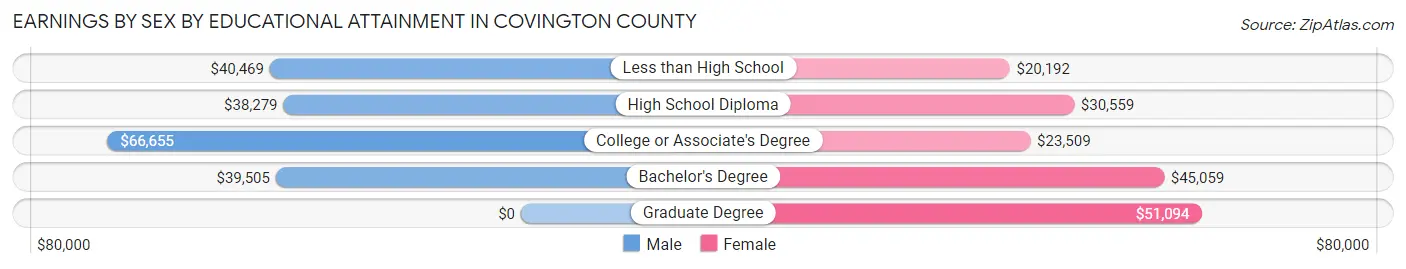
Earnings by Sex by Educational Attainment in Covington County
Average earnings in Covington County are $47,788 for men and $30,908 for women, a difference of 35.3%. Men with an educational attainment of college or associate's degree enjoy the highest average annual earnings of $66,655, while those with high school diploma education earn the least with $38,279. Women with an educational attainment of graduate degree earn the most with the average annual earnings of $51,094, while those with less than high school education have the smallest earnings of $20,192.
| Educational Attainment | Male Income | Female Income |
| Less than High School | $40,469 | $20,192 |
| High School Diploma | $38,279 | $30,559 |
| College or Associate's Degree | $66,655 | $23,509 |
| Bachelor's Degree | $39,505 | $45,059 |
| Graduate Degree | - | - |
| Total | $47,788 | $30,908 |
Family Income in Covington County
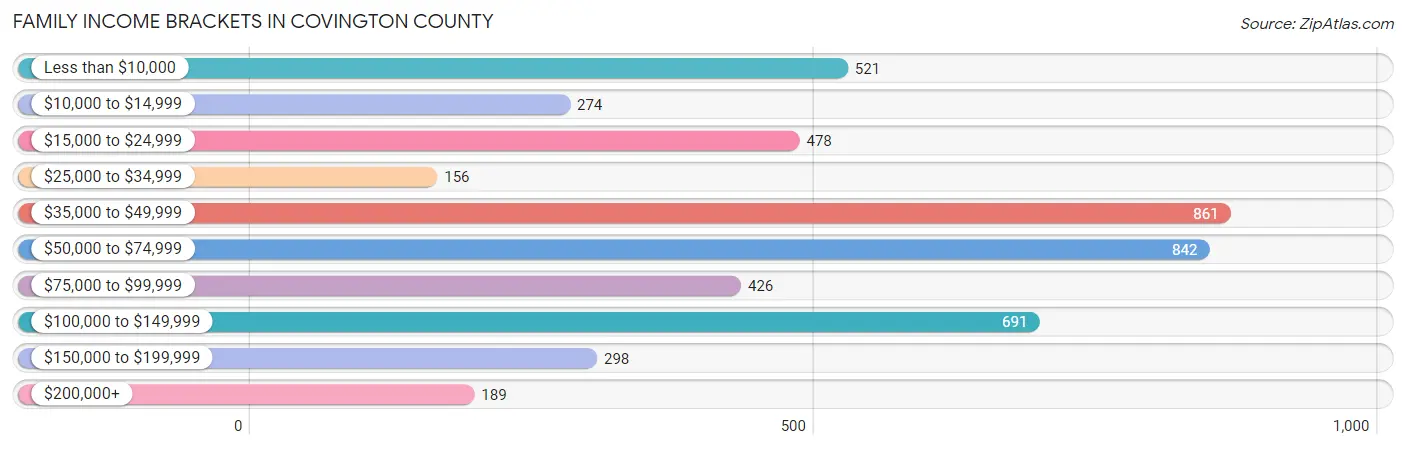
Family Income Brackets in Covington County
According to the Covington County family income data, there are 861 families falling into the $35,000 to $49,999 income range, which is the most common income bracket and makes up 18.2% of all families. Conversely, the $25,000 to $34,999 income bracket is the least frequent group with only 156 families (3.3%) belonging to this category.
| Income Bracket | # Families | % Families |
| Less than $10,000 | 521 | 11.0% |
| $10,000 to $14,999 | 274 | 5.8% |
| $15,000 to $24,999 | 478 | 10.1% |
| $25,000 to $34,999 | 156 | 3.3% |
| $35,000 to $49,999 | 861 | 18.2% |
| $50,000 to $74,999 | 842 | 17.8% |
| $75,000 to $99,999 | 426 | 9.0% |
| $100,000 to $149,999 | 691 | 14.6% |
| $150,000 to $199,999 | 298 | 6.3% |
| $200,000+ | 189 | 4.0% |
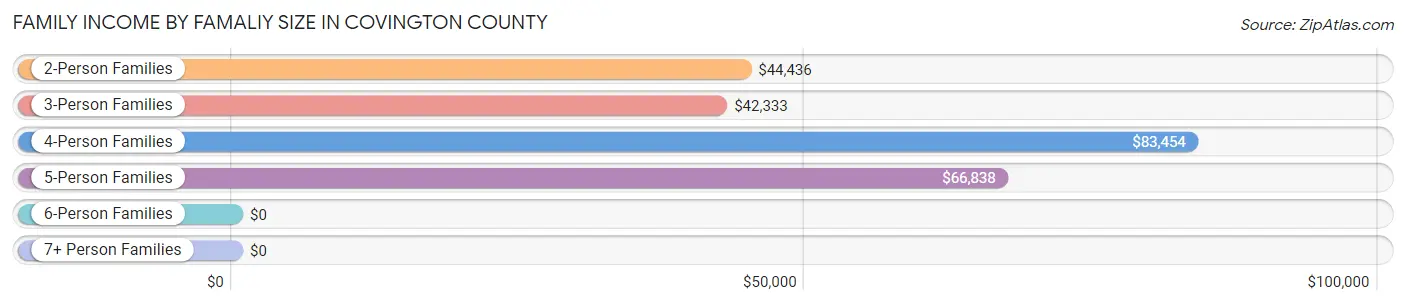
Family Income by Famaliy Size in Covington County
4-person families (1,005 | 21.2%) account for the highest median family income in Covington County with $83,454 per family, while 2-person families (2,365 | 50.0%) have the highest median income of $22,218 per family member.
| Income Bracket | # Families | Median Income |
| 2-Person Families | 2,365 (50.0%) | $44,436 |
| 3-Person Families | 884 (18.7%) | $42,333 |
| 4-Person Families | 1,005 (21.2%) | $83,454 |
| 5-Person Families | 283 (6.0%) | $66,838 |
| 6-Person Families | 195 (4.1%) | $0 |
| 7+ Person Families | 0 (0.0%) | $0 |
| Total | 4,732 (100.0%) | $51,913 |
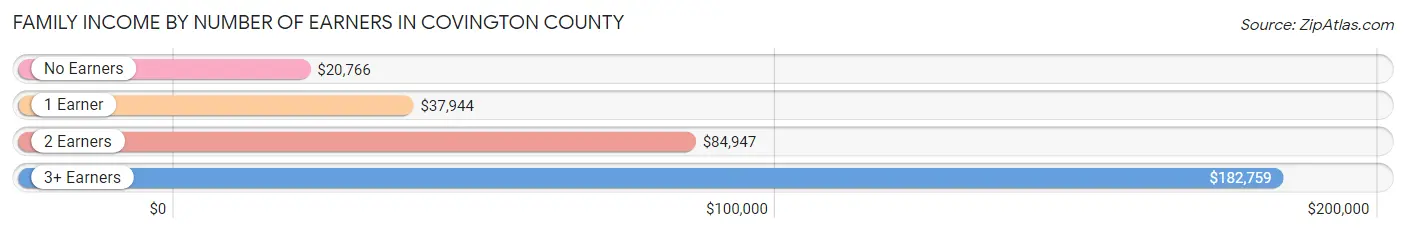
Family Income by Number of Earners in Covington County
The median family income in Covington County is $51,913, with families comprising 3+ earners (278) having the highest median family income of $182,759, while families with no earners (1,269) have the lowest median family income of $20,766, accounting for 5.9% and 26.8% of families, respectively.
| Number of Earners | # Families | Median Income |
| No Earners | 1,269 (26.8%) | $20,766 |
| 1 Earner | 1,628 (34.4%) | $37,944 |
| 2 Earners | 1,557 (32.9%) | $84,947 |
| 3+ Earners | 278 (5.9%) | $182,759 |
| Total | 4,732 (100.0%) | $51,913 |
Household Income in Covington County
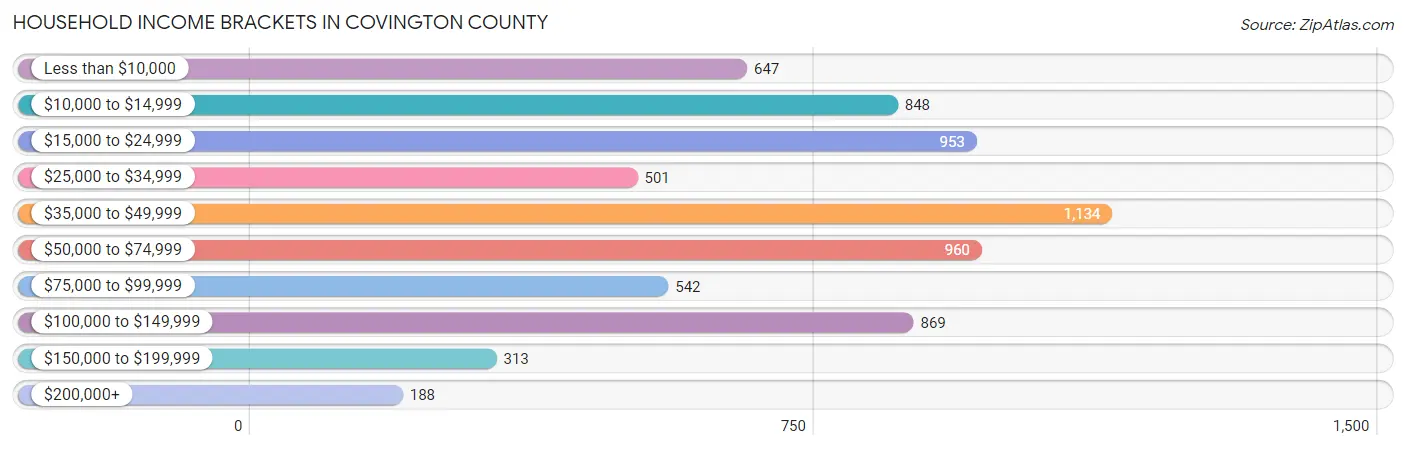
Household Income Brackets in Covington County
With 1,134 households falling in the category, the $35,000 to $49,999 income range is the most frequent in Covington County, accounting for 16.3% of all households. In contrast, only 188 households (2.7%) fall into the $200,000+ income bracket, making it the least populous group.
| Income Bracket | # Households | % Households |
| Less than $10,000 | 647 | 9.3% |
| $10,000 to $14,999 | 848 | 12.2% |
| $15,000 to $24,999 | 953 | 13.7% |
| $25,000 to $34,999 | 501 | 7.2% |
| $35,000 to $49,999 | 1,134 | 16.3% |
| $50,000 to $74,999 | 960 | 13.8% |
| $75,000 to $99,999 | 542 | 7.8% |
| $100,000 to $149,999 | 869 | 12.5% |
| $150,000 to $199,999 | 313 | 4.5% |
| $200,000+ | 188 | 2.7% |
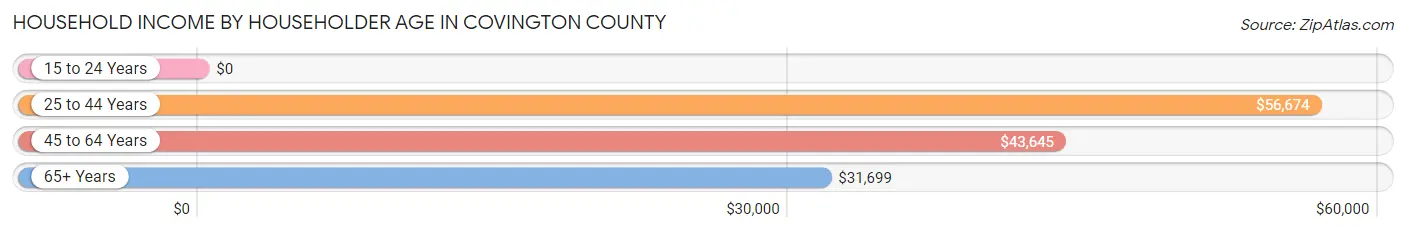
Household Income by Householder Age in Covington County
The median household income in Covington County is $40,164, with the highest median household income of $56,674 found in the 25 to 44 years age bracket for the primary householder. A total of 2,025 households (29.1%) fall into this category. Meanwhile, the 15 to 24 years age bracket for the primary householder has the lowest median household income of $0, with 303 households (4.4%) in this group.
| Income Bracket | # Households | Median Income |
| 15 to 24 Years | 303 (4.4%) | $0 |
| 25 to 44 Years | 2,025 (29.1%) | $56,674 |
| 45 to 64 Years | 2,847 (40.9%) | $43,645 |
| 65+ Years | 1,779 (25.6%) | $31,699 |
| Total | 6,954 (100.0%) | $40,164 |
Poverty in Covington County
Income Below Poverty by Sex and Age in Covington County
With 19.7% poverty level for males and 27.4% for females among the residents of Covington County, 15 year old males and under 5 year old females are the most vulnerable to poverty, with 71 males (77.2%) and 323 females (62.5%) in their respective age groups living below the poverty level.
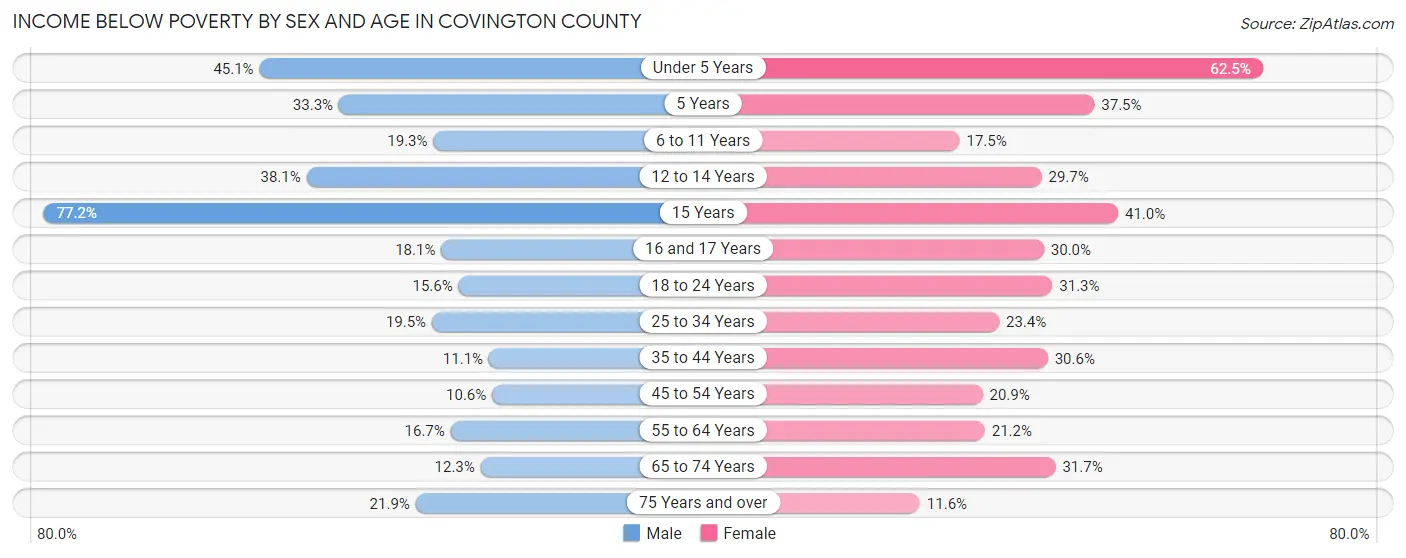
| Age Bracket | Male | Female |
| Under 5 Years | 292 (45.1%) | 323 (62.5%) |
| 5 Years | 17 (33.3%) | 48 (37.5%) |
| 6 to 11 Years | 137 (19.3%) | 110 (17.5%) |
| 12 to 14 Years | 175 (38.1%) | 159 (29.7%) |
| 15 Years | 71 (77.2%) | 121 (41.0%) |
| 16 and 17 Years | 64 (18.1%) | 6 (30.0%) |
| 18 to 24 Years | 138 (15.6%) | 248 (31.3%) |
| 25 to 34 Years | 213 (19.5%) | 237 (23.4%) |
| 35 to 44 Years | 122 (11.1%) | 389 (30.6%) |
| 45 to 54 Years | 106 (10.6%) | 233 (20.9%) |
| 55 to 64 Years | 185 (16.7%) | 263 (21.2%) |
| 65 to 74 Years | 95 (12.3%) | 304 (31.7%) |
| 75 Years and over | 116 (21.9%) | 79 (11.6%) |
| Total | 1,731 (19.7%) | 2,520 (27.4%) |
Income Above Poverty by Sex and Age in Covington County
According to the poverty statistics in Covington County, males aged 45 to 54 years and females aged 75 years and over are the age groups that are most secure financially, with 89.4% of males and 88.4% of females in these age groups living above the poverty line.
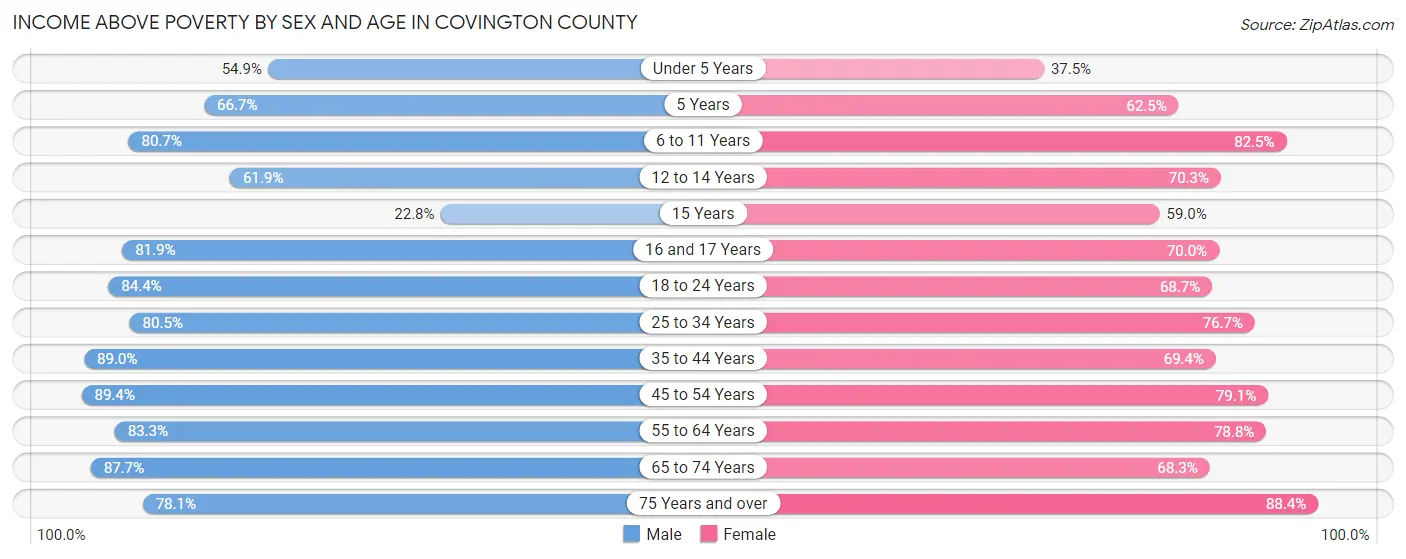
| Age Bracket | Male | Female |
| Under 5 Years | 355 (54.9%) | 194 (37.5%) |
| 5 Years | 34 (66.7%) | 80 (62.5%) |
| 6 to 11 Years | 573 (80.7%) | 519 (82.5%) |
| 12 to 14 Years | 284 (61.9%) | 377 (70.3%) |
| 15 Years | 21 (22.8%) | 174 (59.0%) |
| 16 and 17 Years | 289 (81.9%) | 14 (70.0%) |
| 18 to 24 Years | 749 (84.4%) | 545 (68.7%) |
| 25 to 34 Years | 879 (80.5%) | 778 (76.6%) |
| 35 to 44 Years | 982 (88.9%) | 883 (69.4%) |
| 45 to 54 Years | 896 (89.4%) | 882 (79.1%) |
| 55 to 64 Years | 920 (83.3%) | 976 (78.8%) |
| 65 to 74 Years | 678 (87.7%) | 654 (68.3%) |
| 75 Years and over | 413 (78.1%) | 602 (88.4%) |
| Total | 7,073 (80.3%) | 6,678 (72.6%) |
Income Below Poverty Among Married-Couple Families in Covington County
The poverty statistics for married-couple families in Covington County show that 8.6% or 273 of the total 3,171 families live below the poverty line. Families with 3 or 4 children have the highest poverty rate of 14.3%, comprising of 56 families. On the other hand, families with 1 or 2 children have the lowest poverty rate of 4.0%, which includes 39 families.
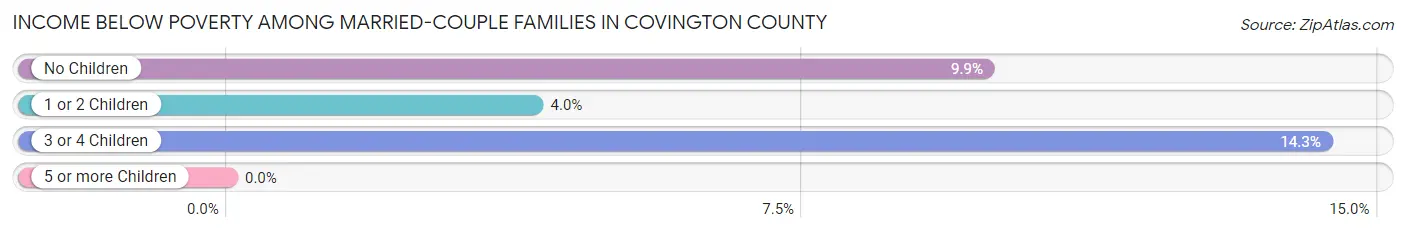
| Children | Above Poverty | Below Poverty |
| No Children | 1,623 (90.1%) | 178 (9.9%) |
| 1 or 2 Children | 939 (96.0%) | 39 (4.0%) |
| 3 or 4 Children | 336 (85.7%) | 56 (14.3%) |
| 5 or more Children | 0 (0.0%) | 0 (0.0%) |
| Total | 2,898 (91.4%) | 273 (8.6%) |
Income Below Poverty Among Single-Parent Households in Covington County
According to the poverty data in Covington County, 25.0% or 36 single-father households and 51.7% or 733 single-mother households are living below the poverty line. Among single-father households, those with 1 or 2 children have the highest poverty rate, with 36 households (100.0%) experiencing poverty. Likewise, among single-mother households, those with 3 or 4 children have the highest poverty rate, with 226 households (96.2%) falling below the poverty line.
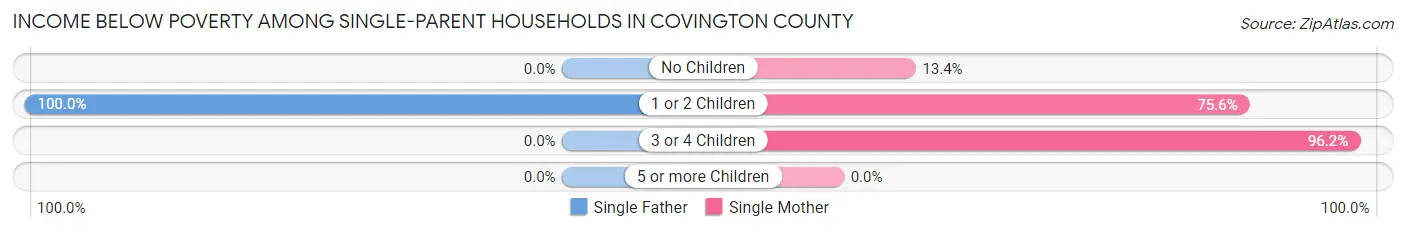
| Children | Single Father | Single Mother |
| No Children | 0 (0.0%) | 83 (13.4%) |
| 1 or 2 Children | 36 (100.0%) | 424 (75.6%) |
| 3 or 4 Children | 0 (0.0%) | 226 (96.2%) |
| 5 or more Children | 0 (0.0%) | 0 (0.0%) |
| Total | 36 (25.0%) | 733 (51.7%) |
Income Below Poverty Among Married-Couple vs Single-Parent Households in Covington County
The poverty data for Covington County shows that 273 of the married-couple family households (8.6%) and 769 of the single-parent households (49.3%) are living below the poverty level. Within the married-couple family households, those with 3 or 4 children have the highest poverty rate, with 56 households (14.3%) falling below the poverty line. Among the single-parent households, those with 3 or 4 children have the highest poverty rate, with 226 household (96.2%) living below poverty.
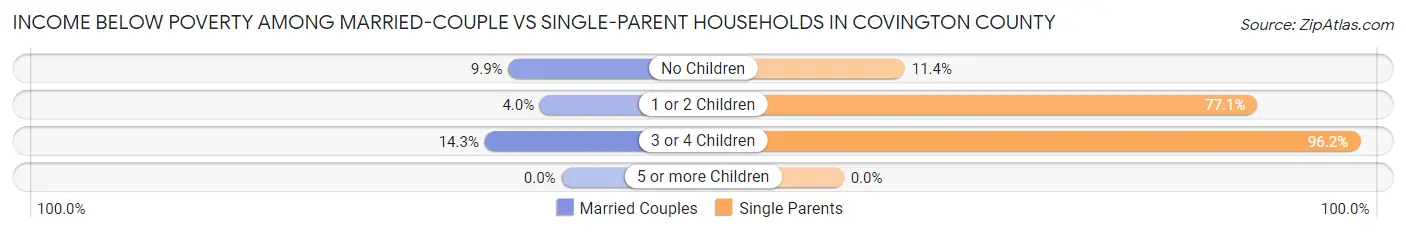
| Children | Married-Couple Families | Single-Parent Households |
| No Children | 178 (9.9%) | 83 (11.4%) |
| 1 or 2 Children | 39 (4.0%) | 460 (77.0%) |
| 3 or 4 Children | 56 (14.3%) | 226 (96.2%) |
| 5 or more Children | 0 (0.0%) | 0 (0.0%) |
| Total | 273 (8.6%) | 769 (49.3%) |
Race in Covington County
The most populous races in Covington County are White / Caucasian (11,101 | 60.6%), Black / African American (6,394 | 34.9%), and Two or more Races (632 | 3.5%).
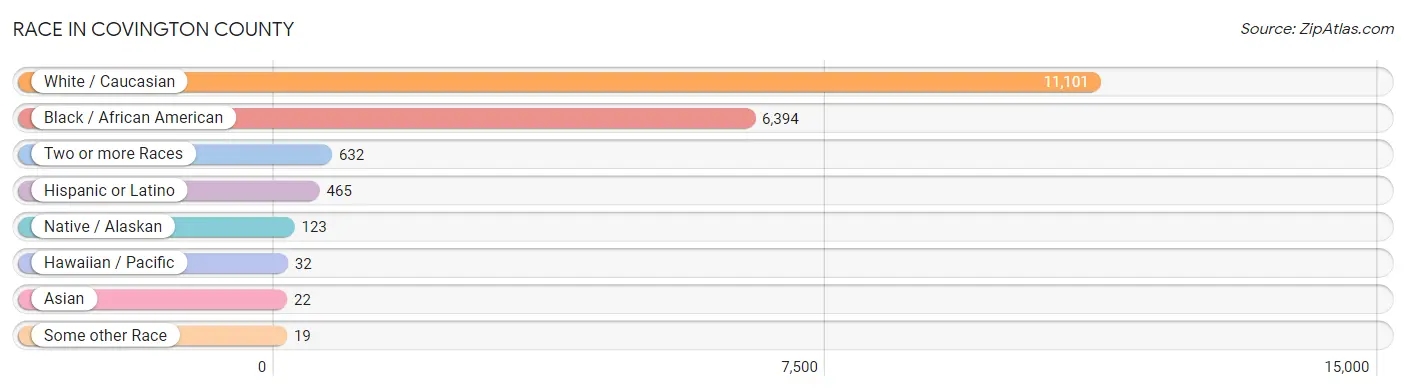
| Race | # Population | % Population |
| Asian | 22 | 0.1% |
| Black / African American | 6,394 | 34.9% |
| Hawaiian / Pacific | 32 | 0.2% |
| Hispanic or Latino | 465 | 2.5% |
| Native / Alaskan | 123 | 0.7% |
| White / Caucasian | 11,101 | 60.6% |
| Two or more Races | 632 | 3.5% |
| Some other Race | 19 | 0.1% |
| Total | 18,323 | 100.0% |
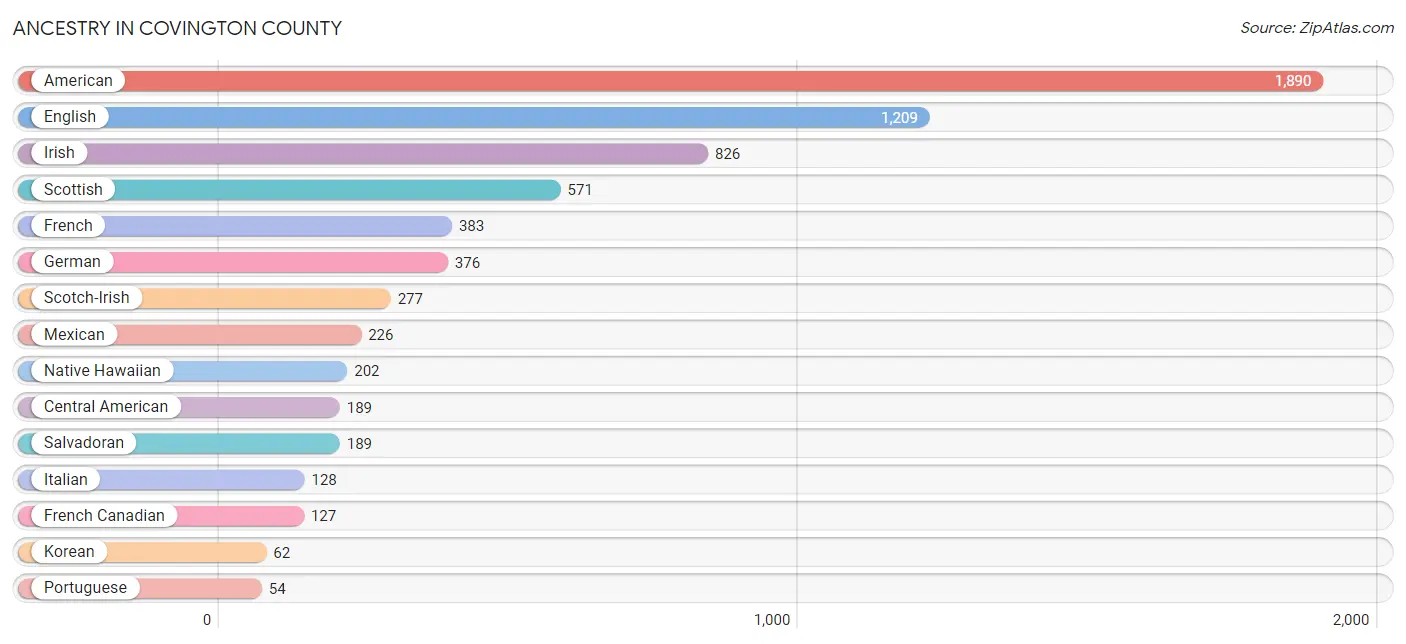
Ancestry in Covington County
The most populous ancestries reported in Covington County are American (1,890 | 10.3%), English (1,209 | 6.6%), Irish (826 | 4.5%), Scottish (571 | 3.1%), and French (383 | 2.1%), together accounting for 26.6% of all Covington County residents.
| Ancestry | # Population | % Population |
| African | 4 | 0.0% |
| American | 1,890 | 10.3% |
| Arab | 46 | 0.3% |
| Argentinean | 17 | 0.1% |
| Austrian | 9 | 0.1% |
| Barbadian | 38 | 0.2% |
| Brazilian | 39 | 0.2% |
| British | 2 | 0.0% |
| Burmese | 8 | 0.0% |
| Cajun | 42 | 0.2% |
| Central American | 189 | 1.0% |
| Cherokee | 8 | 0.0% |
| Czechoslovakian | 8 | 0.0% |
| English | 1,209 | 6.6% |
| Ethiopian | 8 | 0.0% |
| European | 52 | 0.3% |
| French | 383 | 2.1% |
| French Canadian | 127 | 0.7% |
| German | 376 | 2.1% |
| Hungarian | 1 | 0.0% |
| Indian (Asian) | 30 | 0.2% |
| Irish | 826 | 4.5% |
| Italian | 128 | 0.7% |
| Japanese | 8 | 0.0% |
| Korean | 62 | 0.3% |
| Lebanese | 46 | 0.3% |
| Maltese | 2 | 0.0% |
| Mexican | 226 | 1.2% |
| Native Hawaiian | 202 | 1.1% |
| Navajo | 15 | 0.1% |
| Norwegian | 1 | 0.0% |
| Portuguese | 54 | 0.3% |
| Puerto Rican | 30 | 0.2% |
| Salvadoran | 189 | 1.0% |
| Scandinavian | 30 | 0.2% |
| Scotch-Irish | 277 | 1.5% |
| Scottish | 571 | 3.1% |
| South American | 17 | 0.1% |
| Subsaharan African | 12 | 0.1% |
| Swedish | 2 | 0.0% |
| Welsh | 34 | 0.2% |
| West Indian | 42 | 0.2% | View All 42 Rows |
Immigrants in Covington County
The most numerous immigrant groups reported in Covington County came from Latin America (160 | 0.9%), Central America (152 | 0.8%), El Salvador (152 | 0.8%), Europe (29 | 0.2%), and Germany (29 | 0.2%), together accounting for 2.9% of all Covington County residents.
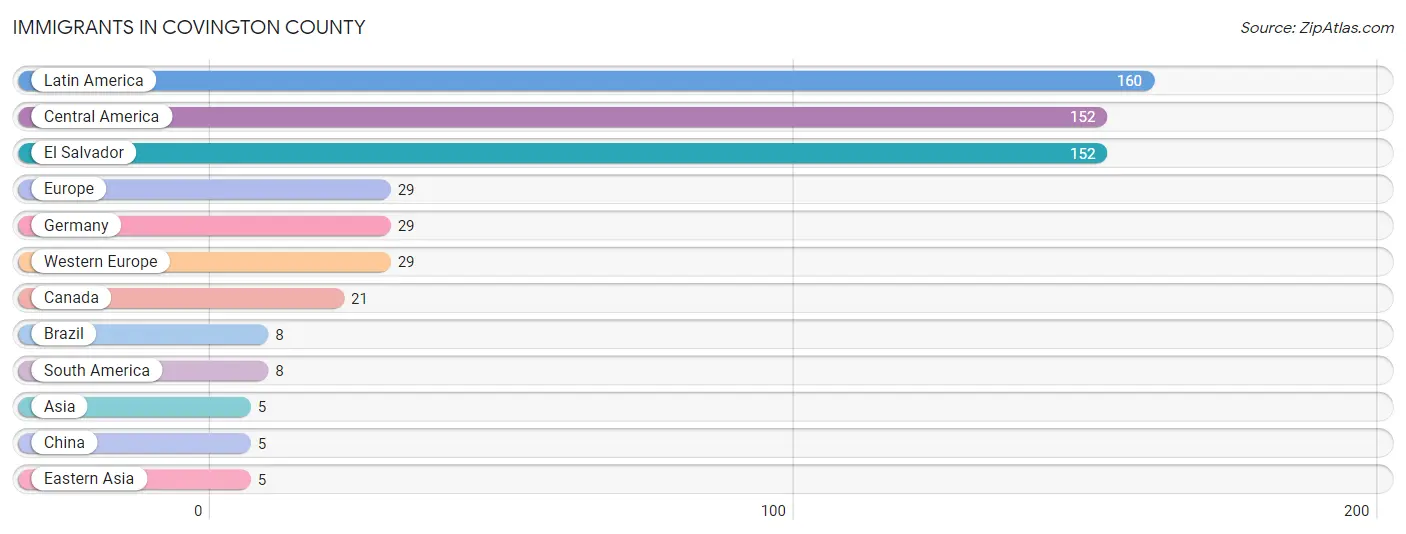
| Immigration Origin | # Population | % Population |
| Asia | 5 | 0.0% |
| Brazil | 8 | 0.0% |
| Canada | 21 | 0.1% |
| Central America | 152 | 0.8% |
| China | 5 | 0.0% |
| Eastern Asia | 5 | 0.0% |
| El Salvador | 152 | 0.8% |
| Europe | 29 | 0.2% |
| Germany | 29 | 0.2% |
| Latin America | 160 | 0.9% |
| South America | 8 | 0.0% |
| Western Europe | 29 | 0.2% | View All 12 Rows |
Sex and Age in Covington County
Sex and Age in Covington County
The most populous age groups in Covington County are 10 to 14 Years (817 | 9.1%) for men and 35 to 39 Years (780 | 8.4%) for women.
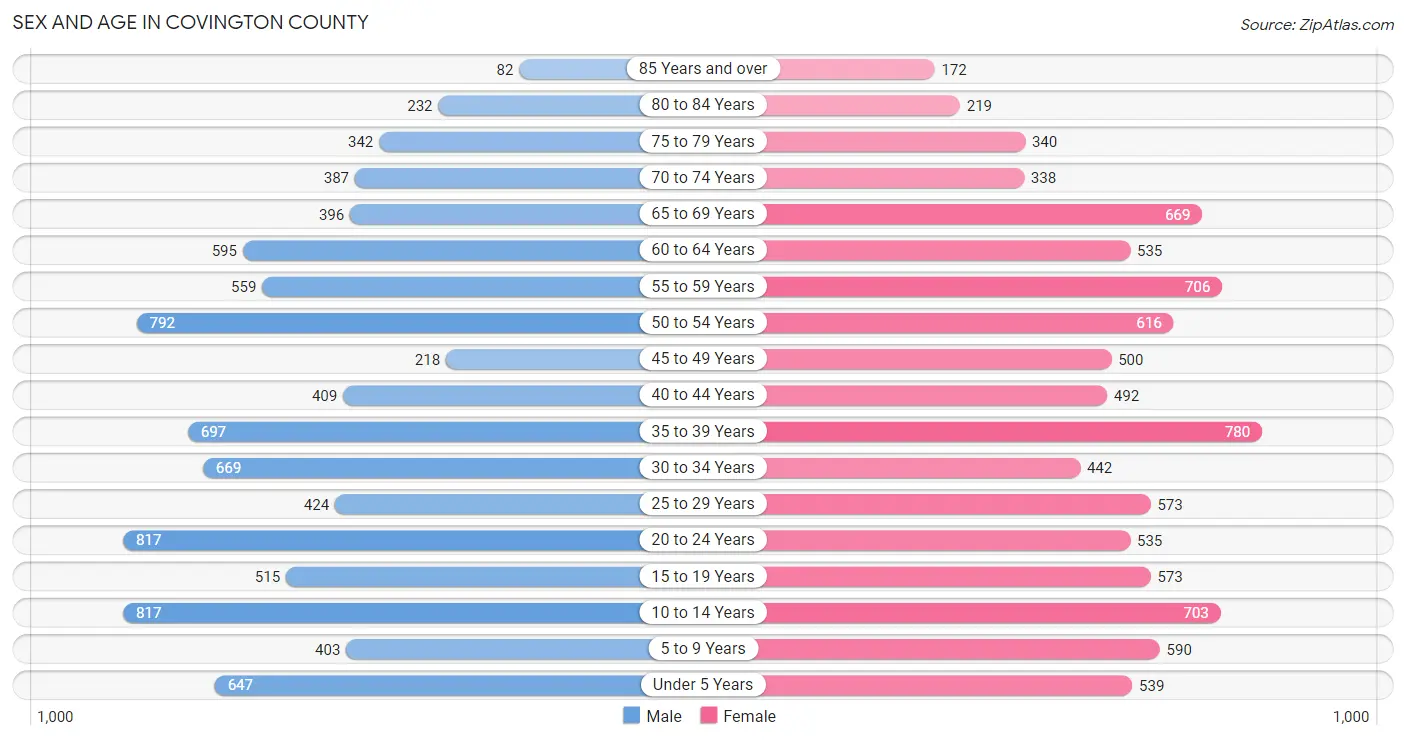
| Age Bracket | Male | Female |
| Under 5 Years | 647 (7.2%) | 539 (5.8%) |
| 5 to 9 Years | 403 (4.5%) | 590 (6.3%) |
| 10 to 14 Years | 817 (9.1%) | 703 (7.5%) |
| 15 to 19 Years | 515 (5.7%) | 573 (6.1%) |
| 20 to 24 Years | 817 (9.1%) | 535 (5.7%) |
| 25 to 29 Years | 424 (4.7%) | 573 (6.1%) |
| 30 to 34 Years | 669 (7.4%) | 442 (4.7%) |
| 35 to 39 Years | 697 (7.7%) | 780 (8.4%) |
| 40 to 44 Years | 409 (4.5%) | 492 (5.3%) |
| 45 to 49 Years | 218 (2.4%) | 500 (5.4%) |
| 50 to 54 Years | 792 (8.8%) | 616 (6.6%) |
| 55 to 59 Years | 559 (6.2%) | 706 (7.6%) |
| 60 to 64 Years | 595 (6.6%) | 535 (5.7%) |
| 65 to 69 Years | 396 (4.4%) | 669 (7.2%) |
| 70 to 74 Years | 387 (4.3%) | 338 (3.6%) |
| 75 to 79 Years | 342 (3.8%) | 340 (3.6%) |
| 80 to 84 Years | 232 (2.6%) | 219 (2.4%) |
| 85 Years and over | 82 (0.9%) | 172 (1.8%) |
| Total | 9,001 (100.0%) | 9,322 (100.0%) |
Families and Households in Covington County
Median Family Size in Covington County
The median family size in Covington County is 3.25 persons per family, with married-couple families (3,171 | 67.0%) accounting for the largest median family size of 3.37 persons per family. On the other hand, single female/mother families (1,417 | 29.9%) represent the smallest median family size with 2.98 persons per family.
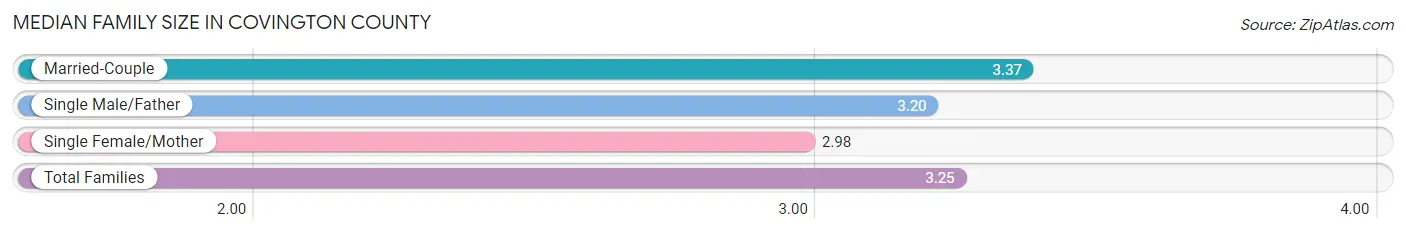
| Family Type | # Families | Family Size |
| Married-Couple | 3,171 (67.0%) | 3.37 |
| Single Male/Father | 144 (3.0%) | 3.20 |
| Single Female/Mother | 1,417 (29.9%) | 2.98 |
| Total Families | 4,732 (100.0%) | 3.25 |
Median Household Size in Covington County
The median household size in Covington County is 2.59 persons per household, with married-couple households (3,171 | 45.6%) accounting for the largest median household size of 3.37 persons per household. non-family households (2,222 | 32.0%) represent the smallest median household size with 1.13 persons per household.
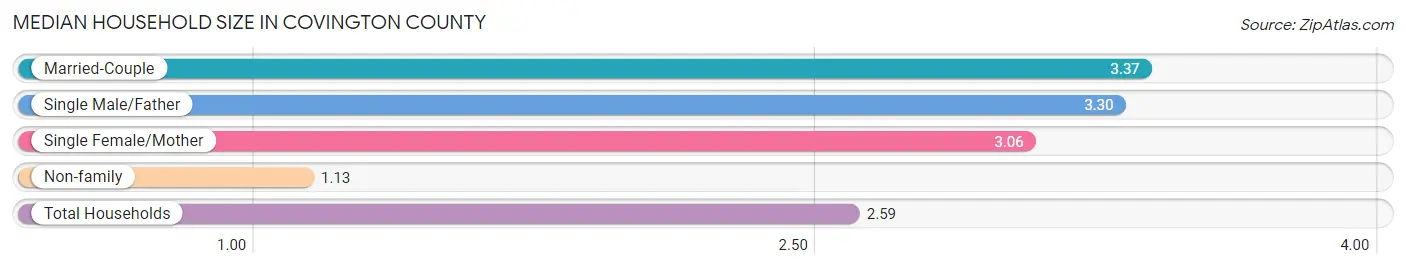
| Household Type | # Households | Household Size |
| Married-Couple | 3,171 (45.6%) | 3.37 |
| Single Male/Father | 144 (2.1%) | 3.30 |
| Single Female/Mother | 1,417 (20.4%) | 3.06 |
| Non-family | 2,222 (32.0%) | 1.13 |
| Total Households | 6,954 (100.0%) | 2.59 |
Household Size by Marriage Status in Covington County
Out of a total of 6,954 households in Covington County, 4,732 (68.0%) are family households, while 2,222 (32.0%) are nonfamily households. The most numerous type of family households are 2-person households, comprising 2,268, and the most common type of nonfamily households are 1-person households, comprising 2,005.
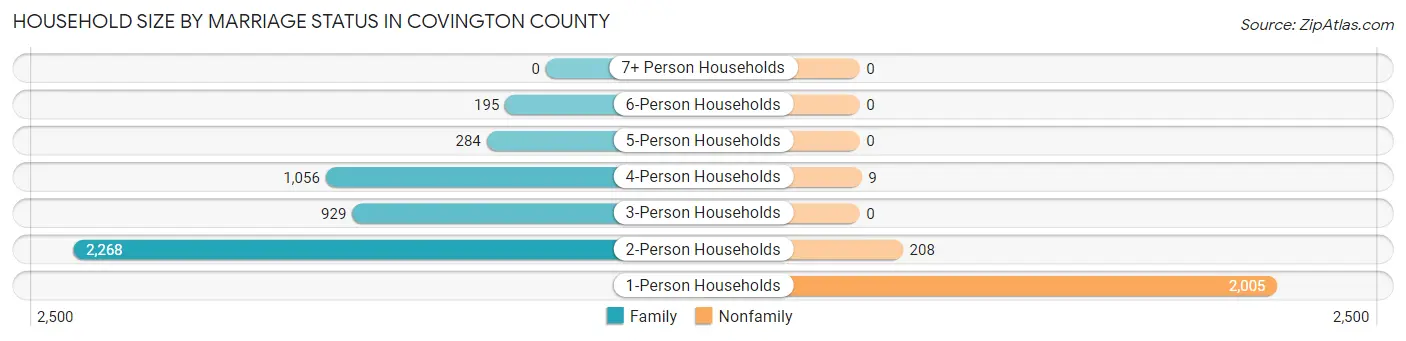
| Household Size | Family Households | Nonfamily Households |
| 1-Person Households | - | 2,005 (28.8%) |
| 2-Person Households | 2,268 (32.6%) | 208 (3.0%) |
| 3-Person Households | 929 (13.4%) | 0 (0.0%) |
| 4-Person Households | 1,056 (15.2%) | 9 (0.1%) |
| 5-Person Households | 284 (4.1%) | 0 (0.0%) |
| 6-Person Households | 195 (2.8%) | 0 (0.0%) |
| 7+ Person Households | 0 (0.0%) | 0 (0.0%) |
| Total | 4,732 (68.0%) | 2,222 (32.0%) |
Female Fertility in Covington County
Fertility by Age in Covington County
Average fertility rate in Covington County is 60.0 births per 1,000 women. Women in the age bracket of 20 to 34 years have the highest fertility rate with 125.0 births per 1,000 women. Women in the age bracket of 20 to 34 years acount for 80.7% of all women with births.
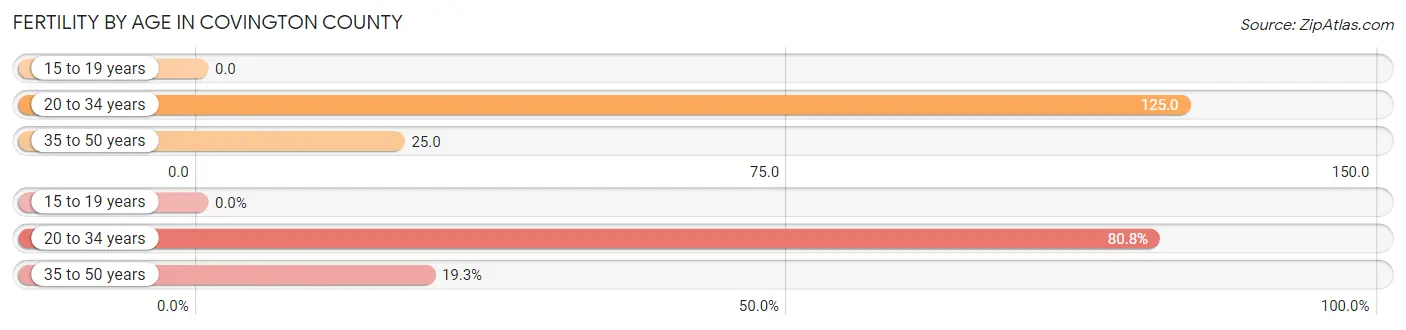
| Age Bracket | Women with Births | Births / 1,000 Women |
| 15 to 19 years | 0 (0.0%) | 0.0 |
| 20 to 34 years | 193 (80.7%) | 125.0 |
| 35 to 50 years | 46 (19.3%) | 25.0 |
| Total | 239 (100.0%) | 60.0 |
Fertility by Age by Marriage Status in Covington County
30.1% of women with births (239) in Covington County are married. The highest percentage of unmarried women with births falls into 20 to 34 years age bracket with 80.3% of them unmarried at the time of birth, while the lowest percentage of unmarried women with births belong to 35 to 50 years age bracket with 26.1% of them unmarried.
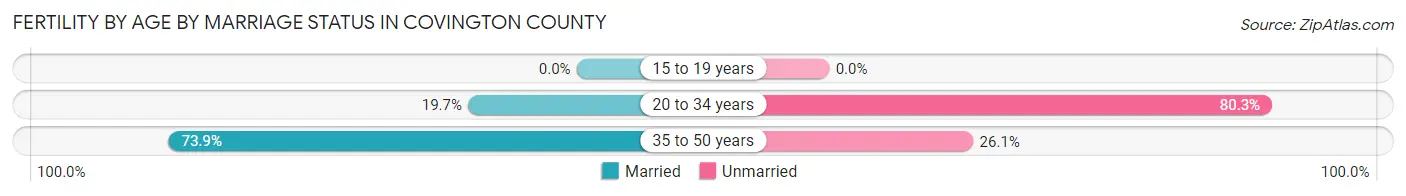
| Age Bracket | Married | Unmarried |
| 15 to 19 years | 0 (0.0%) | 0 (0.0%) |
| 20 to 34 years | 38 (19.7%) | 155 (80.3%) |
| 35 to 50 years | 34 (73.9%) | 12 (26.1%) |
| Total | 72 (30.1%) | 167 (69.9%) |
Fertility by Education in Covington County
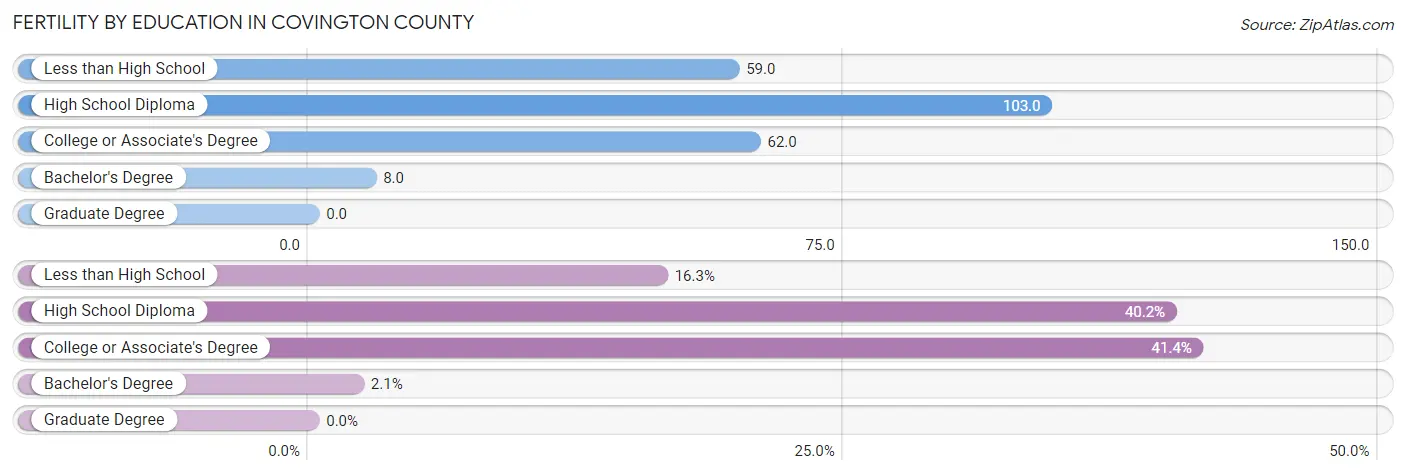
| Educational Attainment | Women with Births | Births / 1,000 Women |
| Less than High School | 39 (16.3%) | 59.0 |
| High School Diploma | 96 (40.2%) | 103.0 |
| College or Associate's Degree | 99 (41.4%) | 62.0 |
| Bachelor's Degree | 5 (2.1%) | 8.0 |
| Graduate Degree | 0 (0.0%) | 0.0 |
| Total | 239 (100.0%) | 60.0 |
Fertility by Education by Marriage Status in Covington County
69.9% of women with births in Covington County are unmarried. Women with the educational attainment of less than high school are most likely to be married with 100.0% of them married at childbirth, while women with the educational attainment of college or associate's degree are least likely to be married with 87.9% of them unmarried at childbirth.
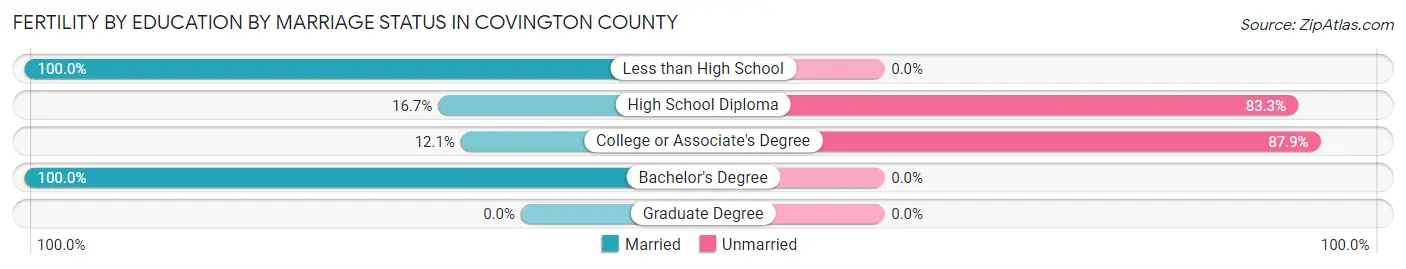
| Educational Attainment | Married | Unmarried |
| Less than High School | 39 (100.0%) | 0 (0.0%) |
| High School Diploma | 16 (16.7%) | 80 (83.3%) |
| College or Associate's Degree | 12 (12.1%) | 87 (87.9%) |
| Bachelor's Degree | 5 (100.0%) | 0 (0.0%) |
| Graduate Degree | 0 (0.0%) | 0 (0.0%) |
| Total | 72 (30.1%) | 167 (69.9%) |
Employment Characteristics in Covington County
Employment by Class of Employer in Covington County
Among the 7,108 employed individuals in Covington County, private company employees (4,785 | 67.3%), state government employees (665 | 9.4%), and local government employees (613 | 8.6%) make up the most common classes of employment.
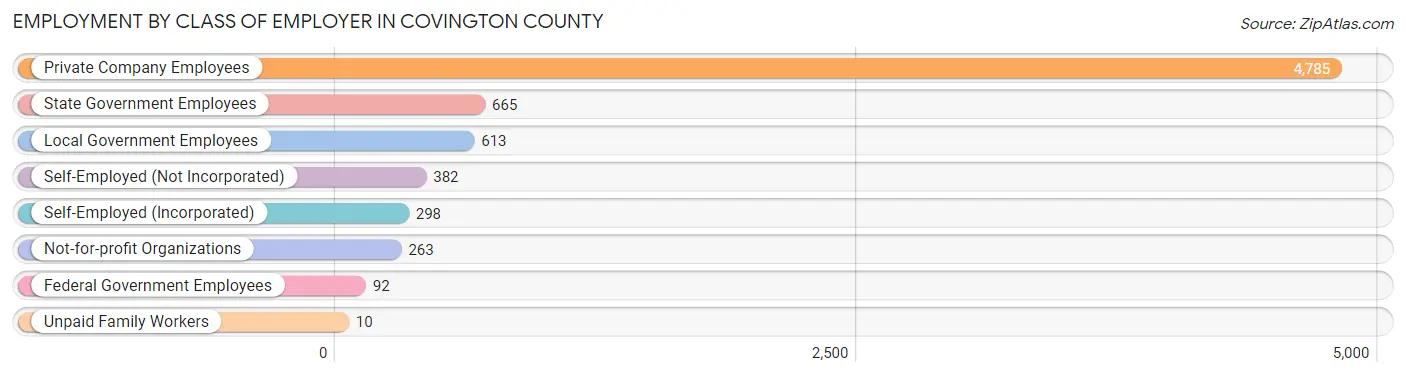
| Employer Class | # Employees | % Employees |
| Private Company Employees | 4,785 | 67.3% |
| Self-Employed (Incorporated) | 298 | 4.2% |
| Self-Employed (Not Incorporated) | 382 | 5.4% |
| Not-for-profit Organizations | 263 | 3.7% |
| Local Government Employees | 613 | 8.6% |
| State Government Employees | 665 | 9.4% |
| Federal Government Employees | 92 | 1.3% |
| Unpaid Family Workers | 10 | 0.1% |
| Total | 7,108 | 100.0% |
Employment Status by Age in Covington County
According to the labor force statistics for Covington County, out of the total population over 16 years of age (14,237), 53.4% or 7,603 individuals are in the labor force, with 5.8% or 441 of them unemployed. The age group with the highest labor force participation rate is 20 to 24 years, with 87.5% or 1,183 individuals in the labor force. Within the labor force, the 16 to 19 years age range has the highest percentage of unemployed individuals, with 50.0% or 51 of them being unemployed.
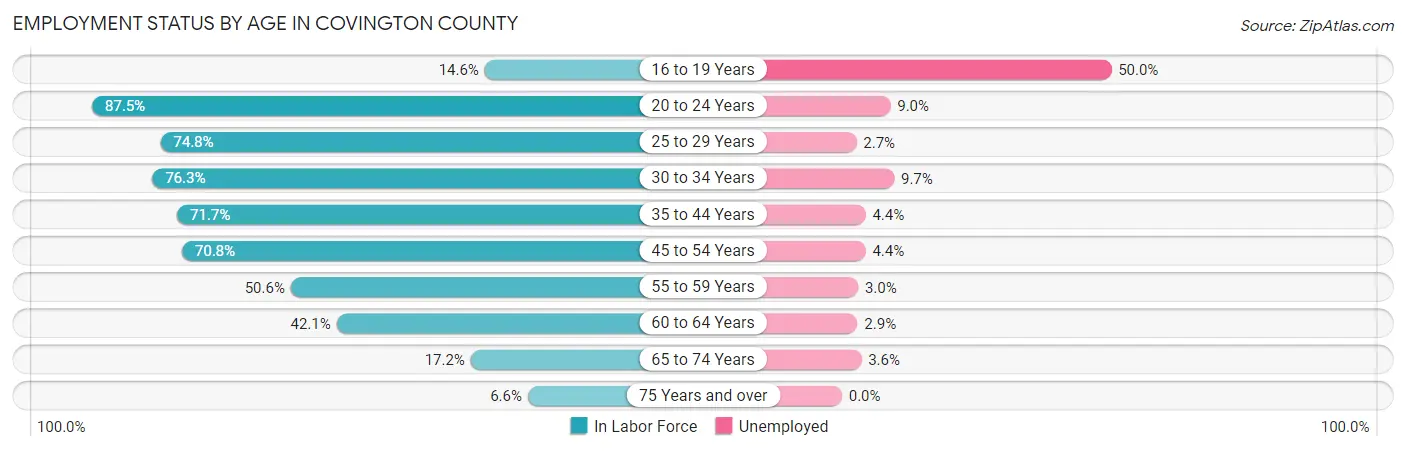
| Age Bracket | In Labor Force | Unemployed |
| 16 to 19 Years | 102 (14.6%) | 51 (50.0%) |
| 20 to 24 Years | 1,183 (87.5%) | 106 (9.0%) |
| 25 to 29 Years | 746 (74.8%) | 20 (2.7%) |
| 30 to 34 Years | 848 (76.3%) | 82 (9.7%) |
| 35 to 44 Years | 1,705 (71.7%) | 75 (4.4%) |
| 45 to 54 Years | 1,505 (70.8%) | 66 (4.4%) |
| 55 to 59 Years | 640 (50.6%) | 19 (3.0%) |
| 60 to 64 Years | 476 (42.1%) | 14 (2.9%) |
| 65 to 74 Years | 308 (17.2%) | 11 (3.6%) |
| 75 Years and over | 92 (6.6%) | 0 (0.0%) |
| Total | 7,603 (53.4%) | 441 (5.8%) |
Employment Status by Educational Attainment in Covington County
According to labor force statistics for Covington County, 65.7% of individuals (5,918) out of the total population between 25 and 64 years of age (9,007) are in the labor force, with 4.7% or 278 of them being unemployed. The group with the highest labor force participation rate are those with the educational attainment of bachelor's degree or higher, with 82.0% or 1,207 individuals in the labor force. Within the labor force, individuals with less than high school education have the highest percentage of unemployment, with 17.6% or 104 of them being unemployed.
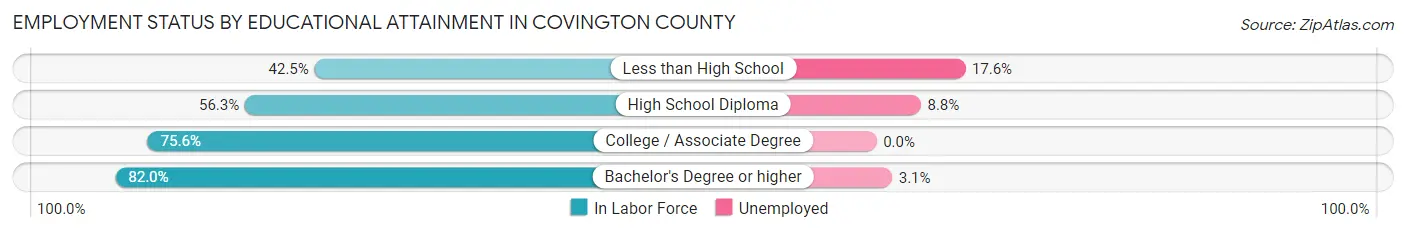
| Educational Attainment | In Labor Force | Unemployed |
| Less than High School | 591 (42.5%) | 245 (17.6%) |
| High School Diploma | 1,529 (56.3%) | 239 (8.8%) |
| College / Associate Degree | 2,592 (75.6%) | 0 (0.0%) |
| Bachelor's Degree or higher | 1,207 (82.0%) | 46 (3.1%) |
| Total | 5,918 (65.7%) | 423 (4.7%) |
Employment Occupations by Sex in Covington County
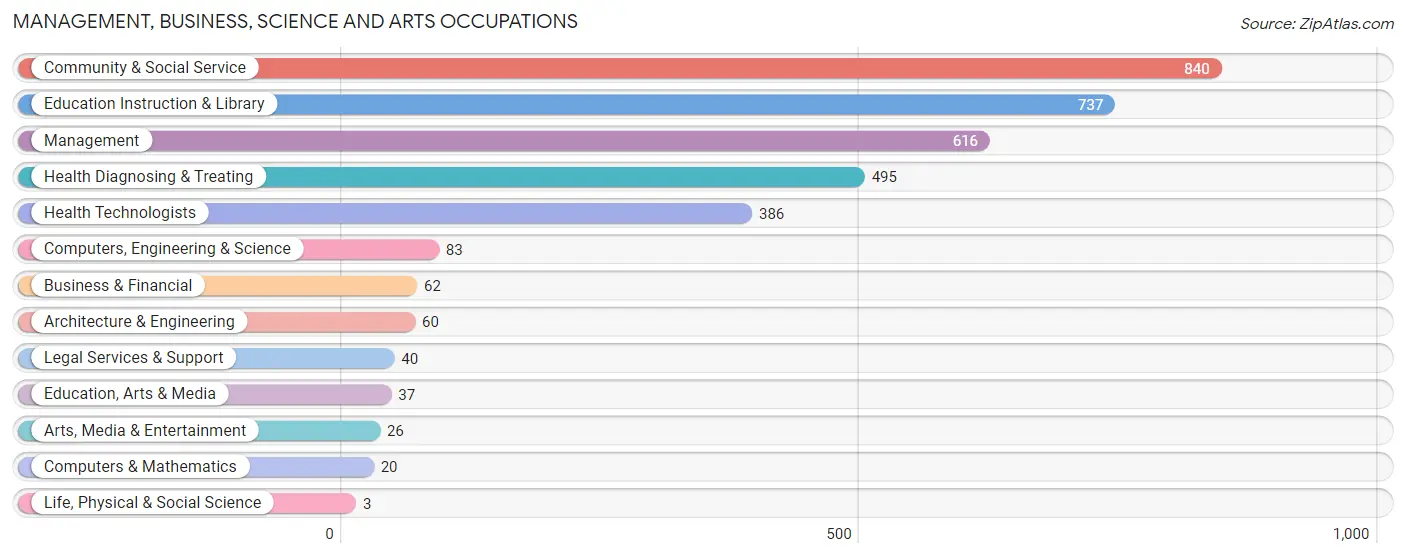
Management, Business, Science and Arts Occupations
The most common Management, Business, Science and Arts occupations in Covington County are Community & Social Service (840 | 11.8%), Education Instruction & Library (737 | 10.3%), Management (616 | 8.6%), Health Diagnosing & Treating (495 | 6.9%), and Health Technologists (386 | 5.4%).
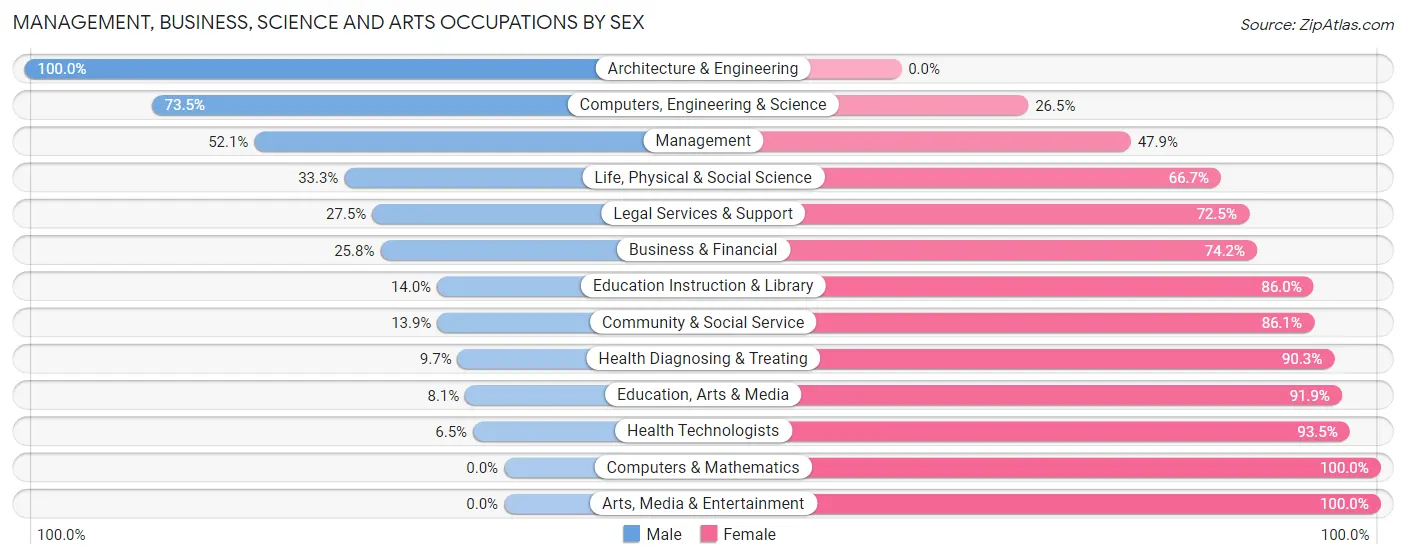
Management, Business, Science and Arts Occupations by Sex
Within the Management, Business, Science and Arts occupations in Covington County, the most male-oriented occupations are Architecture & Engineering (100.0%), Computers, Engineering & Science (73.5%), and Management (52.1%), while the most female-oriented occupations are Computers & Mathematics (100.0%), Arts, Media & Entertainment (100.0%), and Health Technologists (93.5%).
| Occupation | Male | Female |
| Management | 321 (52.1%) | 295 (47.9%) |
| Business & Financial | 16 (25.8%) | 46 (74.2%) |
| Computers, Engineering & Science | 61 (73.5%) | 22 (26.5%) |
| Computers & Mathematics | 0 (0.0%) | 20 (100.0%) |
| Architecture & Engineering | 60 (100.0%) | 0 (0.0%) |
| Life, Physical & Social Science | 1 (33.3%) | 2 (66.7%) |
| Community & Social Service | 117 (13.9%) | 723 (86.1%) |
| Education, Arts & Media | 3 (8.1%) | 34 (91.9%) |
| Legal Services & Support | 11 (27.5%) | 29 (72.5%) |
| Education Instruction & Library | 103 (14.0%) | 634 (86.0%) |
| Arts, Media & Entertainment | 0 (0.0%) | 26 (100.0%) |
| Health Diagnosing & Treating | 48 (9.7%) | 447 (90.3%) |
| Health Technologists | 25 (6.5%) | 361 (93.5%) |
| Total (Category) | 563 (26.9%) | 1,533 (73.1%) |
| Total (Overall) | 3,662 (51.4%) | 3,466 (48.6%) |
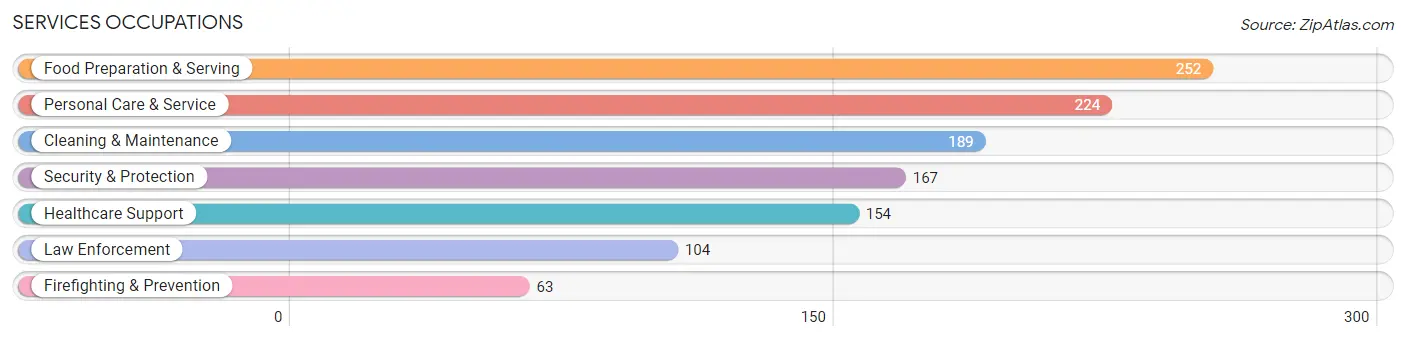
Services Occupations
The most common Services occupations in Covington County are Food Preparation & Serving (252 | 3.5%), Personal Care & Service (224 | 3.1%), Cleaning & Maintenance (189 | 2.6%), Security & Protection (167 | 2.3%), and Healthcare Support (154 | 2.2%).
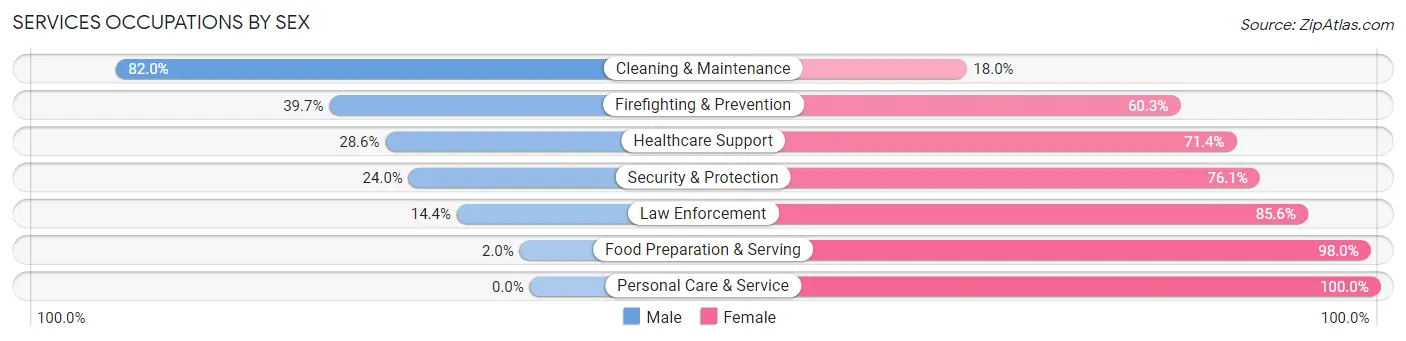
Services Occupations by Sex
Within the Services occupations in Covington County, the most male-oriented occupations are Cleaning & Maintenance (82.0%), Firefighting & Prevention (39.7%), and Healthcare Support (28.6%), while the most female-oriented occupations are Personal Care & Service (100.0%), Food Preparation & Serving (98.0%), and Law Enforcement (85.6%).
| Occupation | Male | Female |
| Healthcare Support | 44 (28.6%) | 110 (71.4%) |
| Security & Protection | 40 (23.9%) | 127 (76.0%) |
| Firefighting & Prevention | 25 (39.7%) | 38 (60.3%) |
| Law Enforcement | 15 (14.4%) | 89 (85.6%) |
| Food Preparation & Serving | 5 (2.0%) | 247 (98.0%) |
| Cleaning & Maintenance | 155 (82.0%) | 34 (18.0%) |
| Personal Care & Service | 0 (0.0%) | 224 (100.0%) |
| Total (Category) | 244 (24.7%) | 742 (75.2%) |
| Total (Overall) | 3,662 (51.4%) | 3,466 (48.6%) |
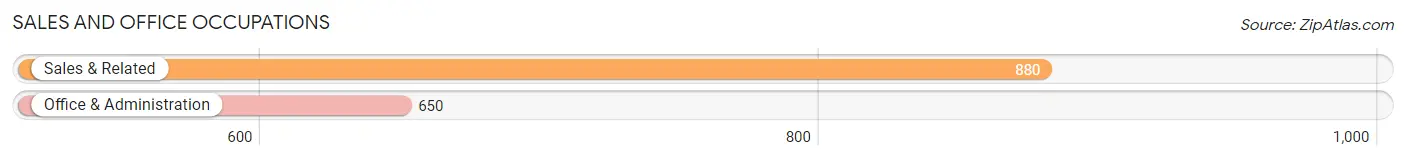
Sales and Office Occupations
The most common Sales and Office occupations in Covington County are Sales & Related (880 | 12.3%), and Office & Administration (650 | 9.1%).
Sales and Office Occupations by Sex
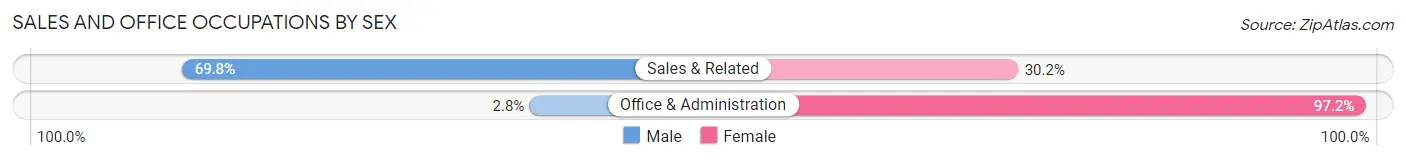
| Occupation | Male | Female |
| Sales & Related | 614 (69.8%) | 266 (30.2%) |
| Office & Administration | 18 (2.8%) | 632 (97.2%) |
| Total (Category) | 632 (41.3%) | 898 (58.7%) |
| Total (Overall) | 3,662 (51.4%) | 3,466 (48.6%) |
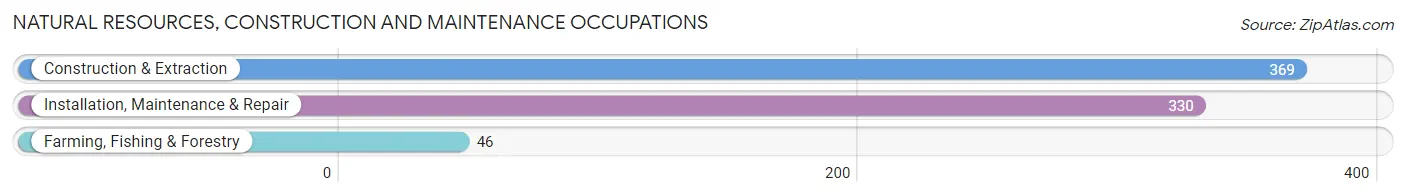
Natural Resources, Construction and Maintenance Occupations
The most common Natural Resources, Construction and Maintenance occupations in Covington County are Construction & Extraction (369 | 5.2%), Installation, Maintenance & Repair (330 | 4.6%), and Farming, Fishing & Forestry (46 | 0.6%).
Natural Resources, Construction and Maintenance Occupations by Sex
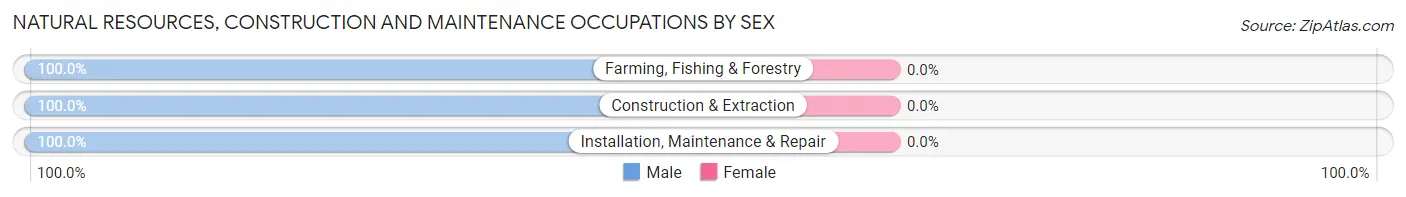
| Occupation | Male | Female |
| Farming, Fishing & Forestry | 46 (100.0%) | 0 (0.0%) |
| Construction & Extraction | 369 (100.0%) | 0 (0.0%) |
| Installation, Maintenance & Repair | 330 (100.0%) | 0 (0.0%) |
| Total (Category) | 745 (100.0%) | 0 (0.0%) |
| Total (Overall) | 3,662 (51.4%) | 3,466 (48.6%) |
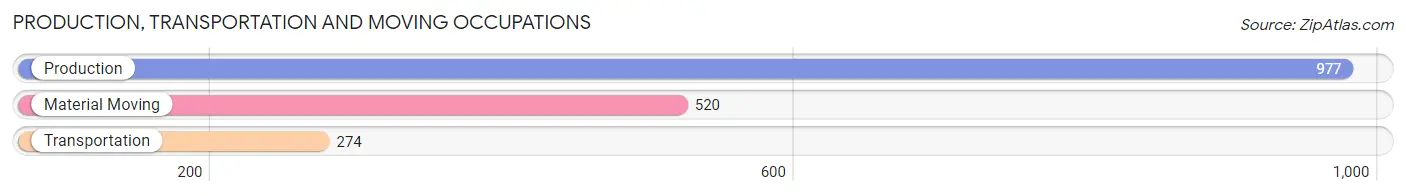
Production, Transportation and Moving Occupations
The most common Production, Transportation and Moving occupations in Covington County are Production (977 | 13.7%), Material Moving (520 | 7.3%), and Transportation (274 | 3.8%).
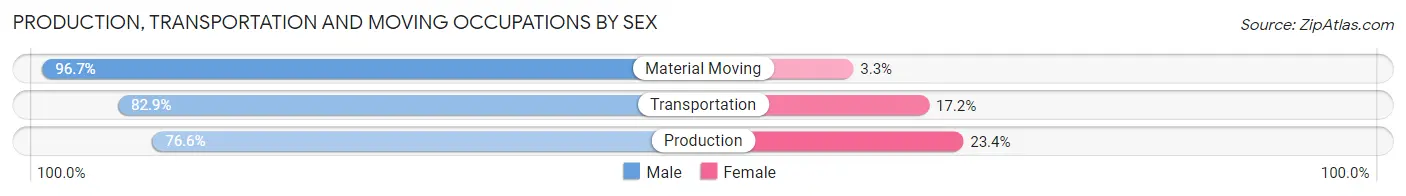
Production, Transportation and Moving Occupations by Sex
| Occupation | Male | Female |
| Production | 748 (76.6%) | 229 (23.4%) |
| Transportation | 227 (82.9%) | 47 (17.2%) |
| Material Moving | 503 (96.7%) | 17 (3.3%) |
| Total (Category) | 1,478 (83.5%) | 293 (16.5%) |
| Total (Overall) | 3,662 (51.4%) | 3,466 (48.6%) |
Employment Industries by Sex in Covington County
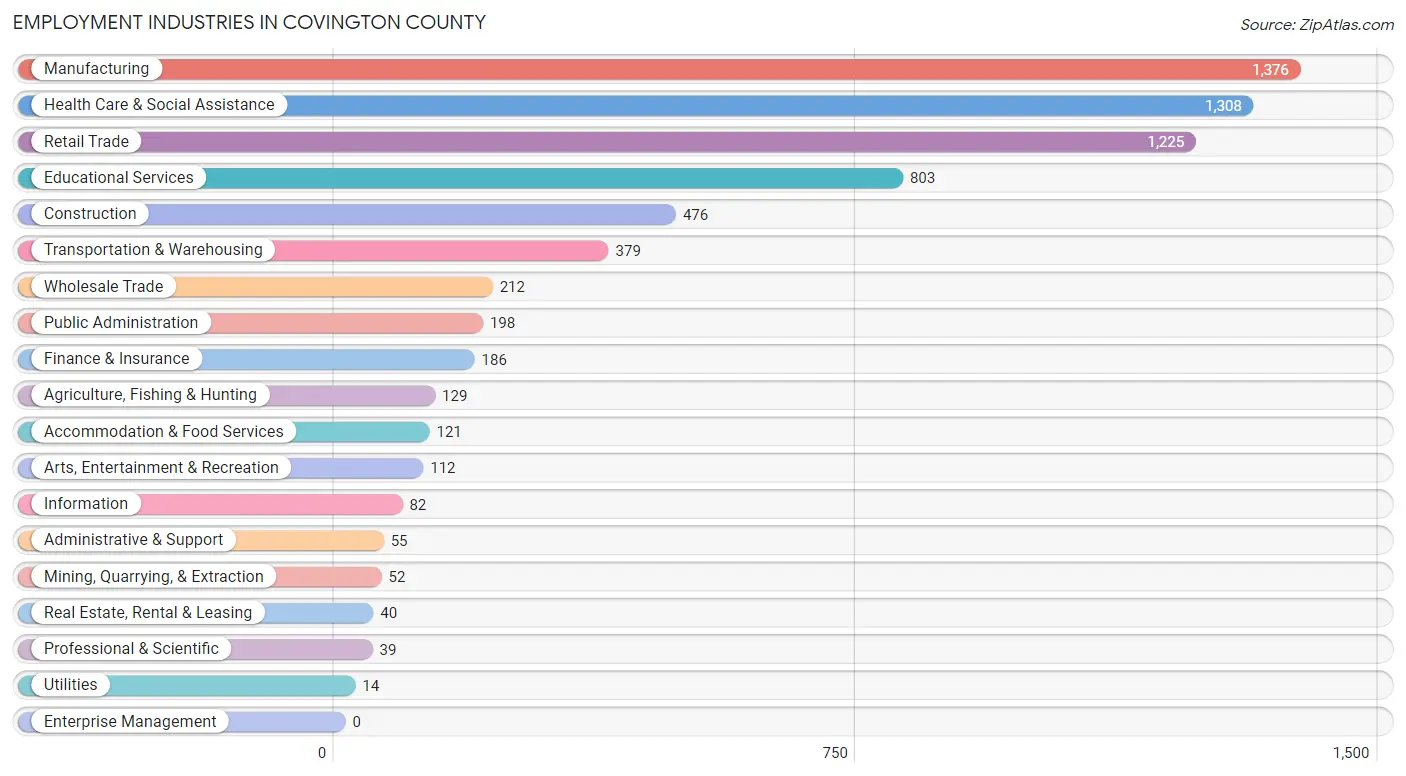
Employment Industries in Covington County
The major employment industries in Covington County include Manufacturing (1,376 | 19.3%), Health Care & Social Assistance (1,308 | 18.3%), Retail Trade (1,225 | 17.2%), Educational Services (803 | 11.3%), and Construction (476 | 6.7%).
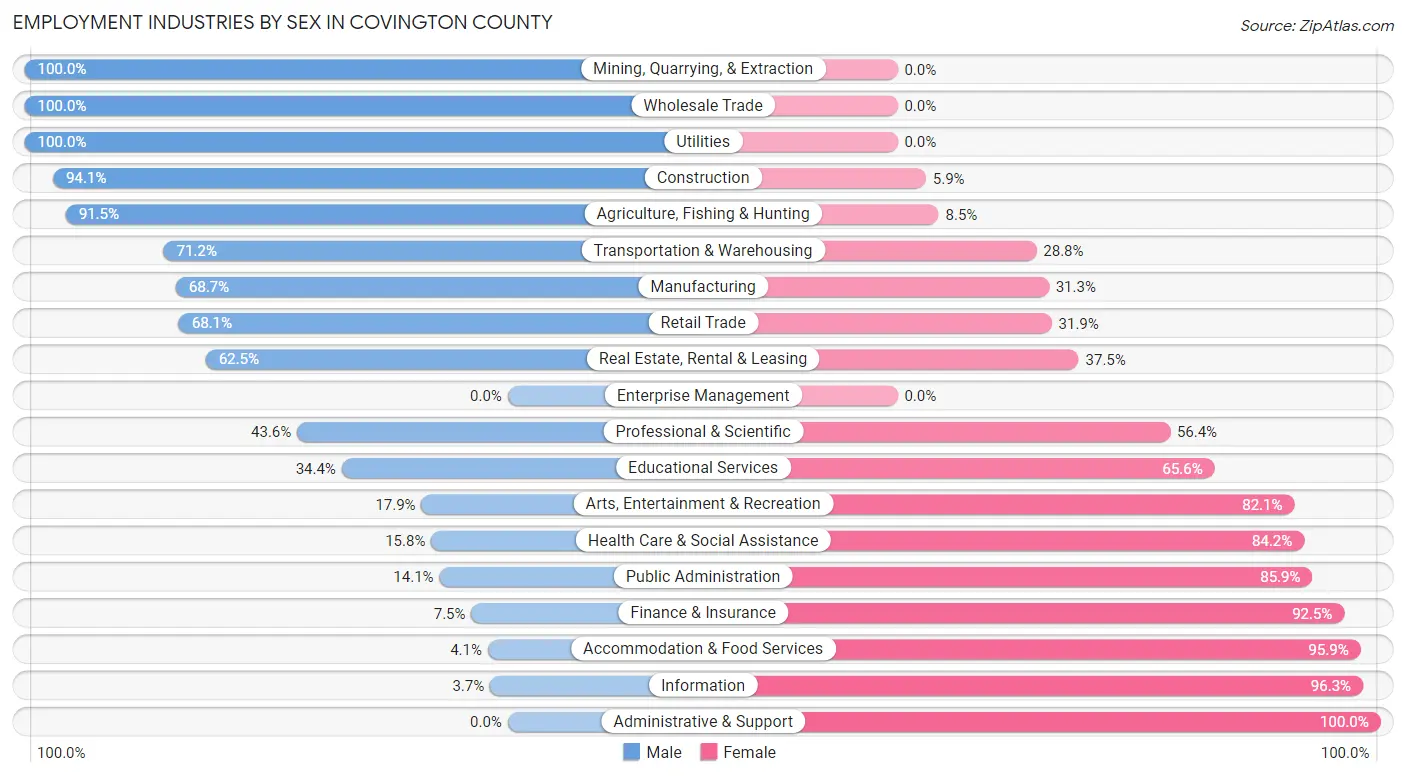
Employment Industries by Sex in Covington County
The Covington County industries that see more men than women are Mining, Quarrying, & Extraction (100.0%), Wholesale Trade (100.0%), and Utilities (100.0%), whereas the industries that tend to have a higher number of women are Administrative & Support (100.0%), Information (96.3%), and Accommodation & Food Services (95.9%).
| Industry | Male | Female |
| Agriculture, Fishing & Hunting | 118 (91.5%) | 11 (8.5%) |
| Mining, Quarrying, & Extraction | 52 (100.0%) | 0 (0.0%) |
| Construction | 448 (94.1%) | 28 (5.9%) |
| Manufacturing | 945 (68.7%) | 431 (31.3%) |
| Wholesale Trade | 212 (100.0%) | 0 (0.0%) |
| Retail Trade | 834 (68.1%) | 391 (31.9%) |
| Transportation & Warehousing | 270 (71.2%) | 109 (28.8%) |
| Utilities | 14 (100.0%) | 0 (0.0%) |
| Information | 3 (3.7%) | 79 (96.3%) |
| Finance & Insurance | 14 (7.5%) | 172 (92.5%) |
| Real Estate, Rental & Leasing | 25 (62.5%) | 15 (37.5%) |
| Professional & Scientific | 17 (43.6%) | 22 (56.4%) |
| Enterprise Management | 0 (0.0%) | 0 (0.0%) |
| Administrative & Support | 0 (0.0%) | 55 (100.0%) |
| Educational Services | 276 (34.4%) | 527 (65.6%) |
| Health Care & Social Assistance | 207 (15.8%) | 1,101 (84.2%) |
| Arts, Entertainment & Recreation | 20 (17.9%) | 92 (82.1%) |
| Accommodation & Food Services | 5 (4.1%) | 116 (95.9%) |
| Public Administration | 28 (14.1%) | 170 (85.9%) |
| Total | 3,662 (51.4%) | 3,466 (48.6%) |
Education in Covington County
School Enrollment in Covington County
The most common levels of schooling among the 3,499 students in Covington County are high school (903 | 25.8%), middle school (842 | 24.1%), and elementary school (761 | 21.7%).
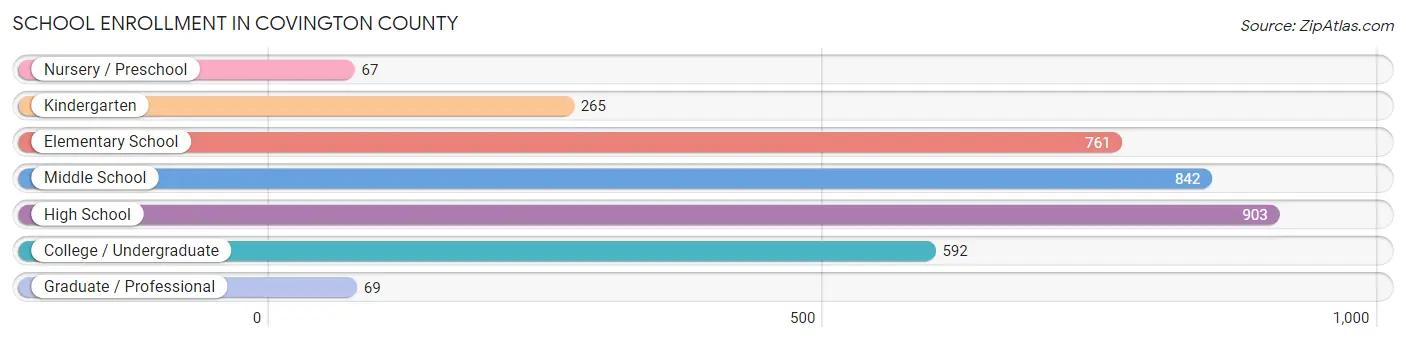
| School Level | # Students | % Students |
| Nursery / Preschool | 67 | 1.9% |
| Kindergarten | 265 | 7.6% |
| Elementary School | 761 | 21.7% |
| Middle School | 842 | 24.1% |
| High School | 903 | 25.8% |
| College / Undergraduate | 592 | 16.9% |
| Graduate / Professional | 69 | 2.0% |
| Total | 3,499 | 100.0% |
School Enrollment by Age by Funding Source in Covington County
Out of a total of 3,499 students who are enrolled in schools in Covington County, 766 (21.9%) attend a private institution, while the remaining 2,733 (78.1%) are enrolled in public schools. The age group of 35 years and over has the highest likelihood of being enrolled in private schools, with 61 (72.6% in the age bracket) enrolled. Conversely, the age group of 18 to 19 year olds has the lowest likelihood of being enrolled in a private school, with 161 (88.9% in the age bracket) attending a public institution.
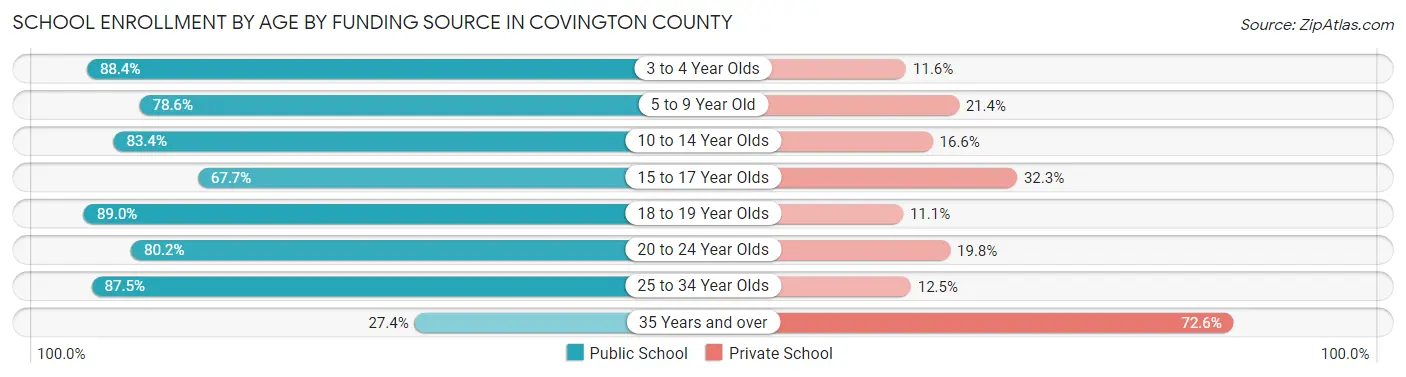
| Age Bracket | Public School | Private School |
| 3 to 4 Year Olds | 152 (88.4%) | 20 (11.6%) |
| 5 to 9 Year Old | 649 (78.6%) | 177 (21.4%) |
| 10 to 14 Year Olds | 781 (83.4%) | 155 (16.6%) |
| 15 to 17 Year Olds | 472 (67.7%) | 225 (32.3%) |
| 18 to 19 Year Olds | 161 (88.9%) | 20 (11.1%) |
| 20 to 24 Year Olds | 368 (80.2%) | 91 (19.8%) |
| 25 to 34 Year Olds | 126 (87.5%) | 18 (12.5%) |
| 35 Years and over | 23 (27.4%) | 61 (72.6%) |
| Total | 2,733 (78.1%) | 766 (21.9%) |
Educational Attainment by Field of Study in Covington County
Education (750 | 36.5%), business (516 | 25.1%), science & technology (279 | 13.6%), engineering (124 | 6.0%), and arts & humanities (94 | 4.6%) are the most common fields of study among 2,053 individuals in Covington County who have obtained a bachelor's degree or higher.
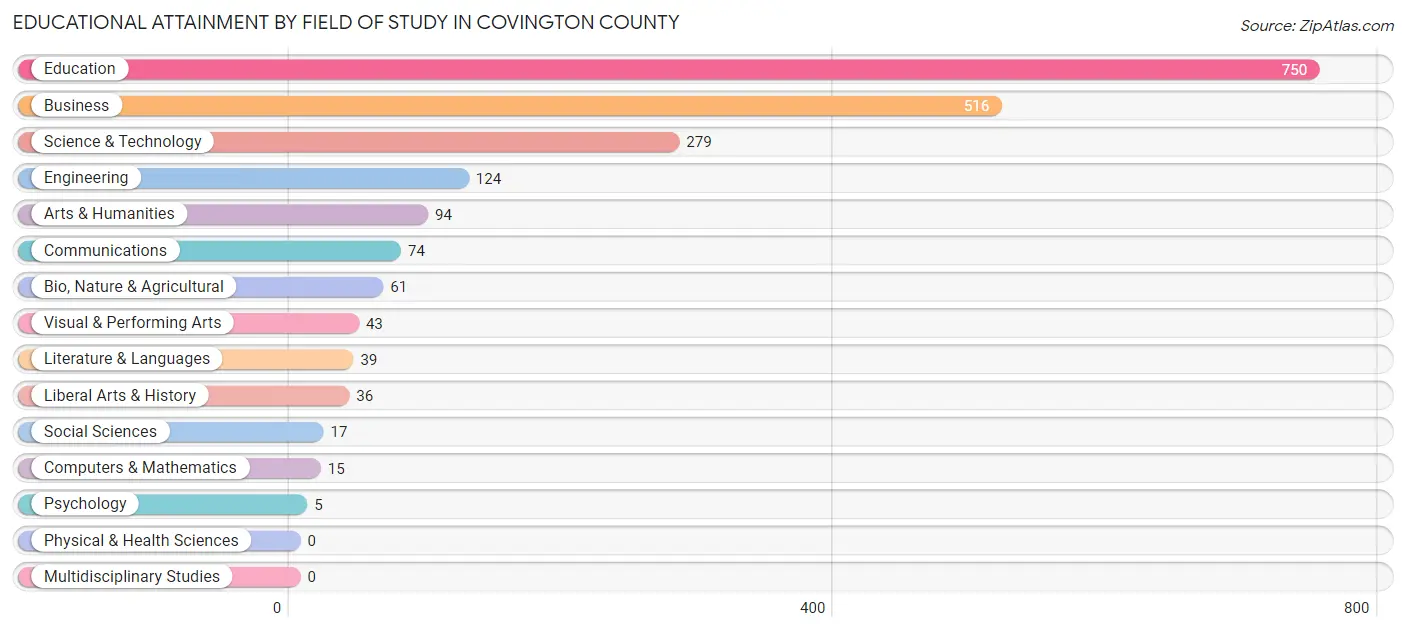
| Field of Study | # Graduates | % Graduates |
| Computers & Mathematics | 15 | 0.7% |
| Bio, Nature & Agricultural | 61 | 3.0% |
| Physical & Health Sciences | 0 | 0.0% |
| Psychology | 5 | 0.2% |
| Social Sciences | 17 | 0.8% |
| Engineering | 124 | 6.0% |
| Multidisciplinary Studies | 0 | 0.0% |
| Science & Technology | 279 | 13.6% |
| Business | 516 | 25.1% |
| Education | 750 | 36.5% |
| Literature & Languages | 39 | 1.9% |
| Liberal Arts & History | 36 | 1.8% |
| Visual & Performing Arts | 43 | 2.1% |
| Communications | 74 | 3.6% |
| Arts & Humanities | 94 | 4.6% |
| Total | 2,053 | 100.0% |
Transportation & Commute in Covington County
Vehicle Availability by Sex in Covington County
The most prevalent vehicle ownership categories in Covington County are males with 2 vehicles (1,755, accounting for 48.6%) and females with 2 vehicles (1,312, making up 50.2%).
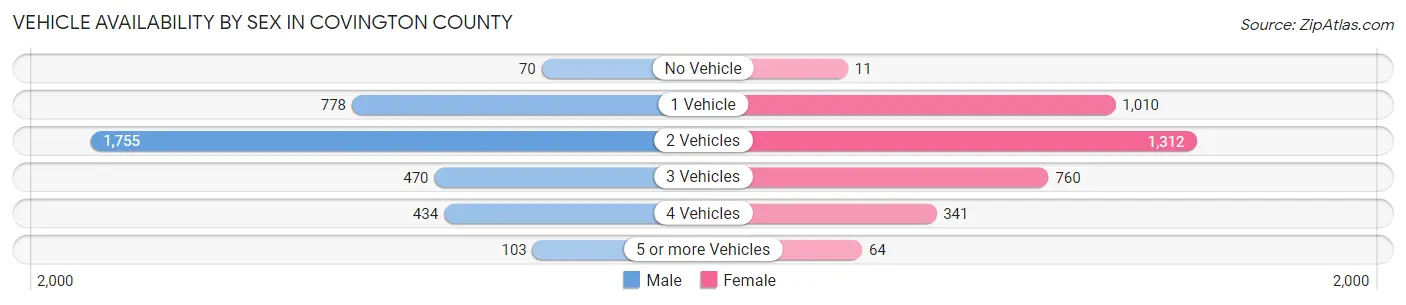
| Vehicles Available | Male | Female |
| No Vehicle | 70 (1.9%) | 11 (0.3%) |
| 1 Vehicle | 778 (21.5%) | 1,010 (28.9%) |
| 2 Vehicles | 1,755 (48.6%) | 1,312 (37.5%) |
| 3 Vehicles | 470 (13.0%) | 760 (21.7%) |
| 4 Vehicles | 434 (12.0%) | 341 (9.8%) |
| 5 or more Vehicles | 103 (2.9%) | 64 (1.8%) |
| Total | 3,610 (100.0%) | 3,498 (100.0%) |
Commute Time in Covington County
The most frequently occuring commute durations in Covington County are 30 to 34 minutes (1,458 commuters, 20.9%), 20 to 24 minutes (1,393 commuters, 20.0%), and 15 to 19 minutes (1,075 commuters, 15.4%).
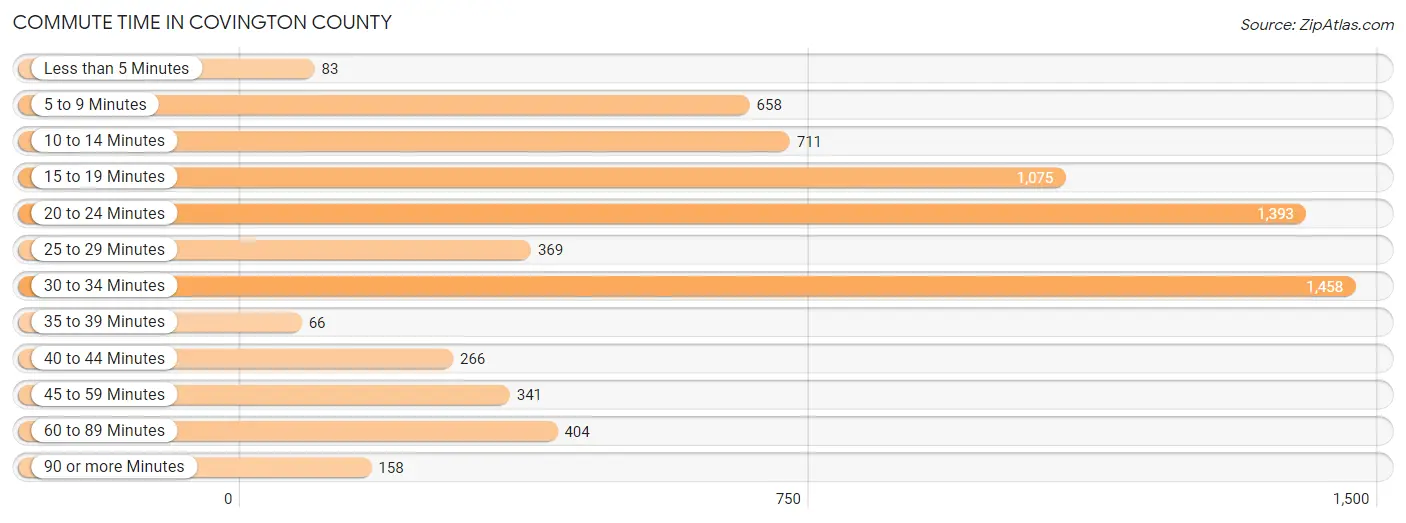
| Commute Time | # Commuters | % Commuters |
| Less than 5 Minutes | 83 | 1.2% |
| 5 to 9 Minutes | 658 | 9.4% |
| 10 to 14 Minutes | 711 | 10.2% |
| 15 to 19 Minutes | 1,075 | 15.4% |
| 20 to 24 Minutes | 1,393 | 20.0% |
| 25 to 29 Minutes | 369 | 5.3% |
| 30 to 34 Minutes | 1,458 | 20.9% |
| 35 to 39 Minutes | 66 | 0.9% |
| 40 to 44 Minutes | 266 | 3.8% |
| 45 to 59 Minutes | 341 | 4.9% |
| 60 to 89 Minutes | 404 | 5.8% |
| 90 or more Minutes | 158 | 2.3% |
Commute Time by Sex in Covington County
The most common commute times in Covington County are 30 to 34 minutes (655 commuters, 18.6%) for males and 30 to 34 minutes (803 commuters, 23.2%) for females.
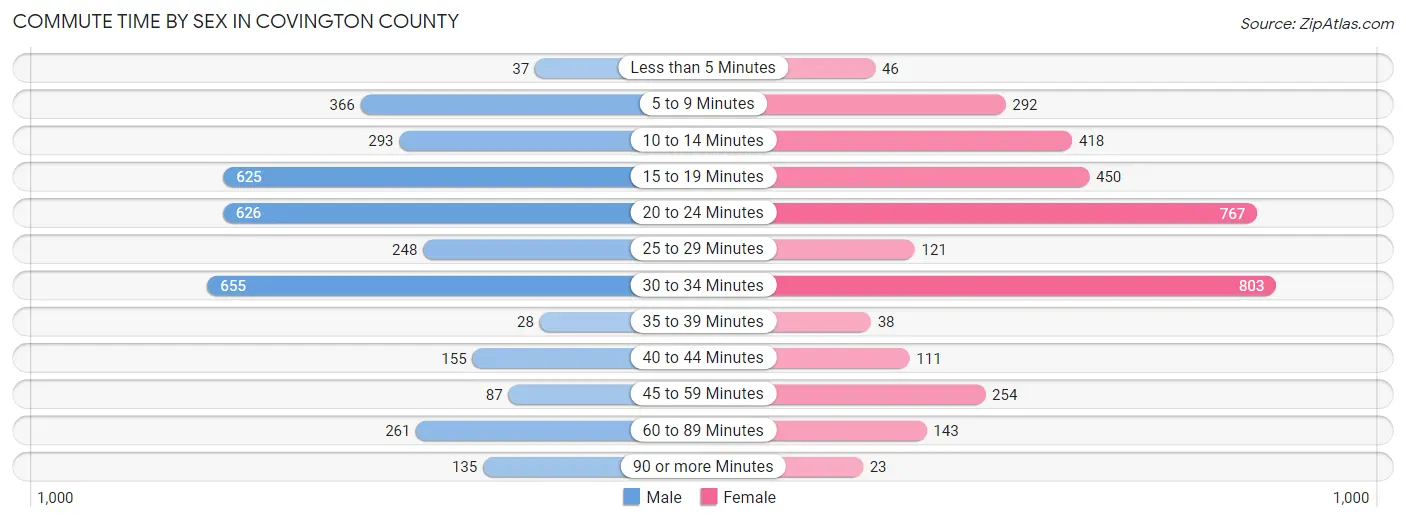
| Commute Time | Male | Female |
| Less than 5 Minutes | 37 (1.1%) | 46 (1.3%) |
| 5 to 9 Minutes | 366 (10.4%) | 292 (8.4%) |
| 10 to 14 Minutes | 293 (8.3%) | 418 (12.1%) |
| 15 to 19 Minutes | 625 (17.8%) | 450 (13.0%) |
| 20 to 24 Minutes | 626 (17.8%) | 767 (22.1%) |
| 25 to 29 Minutes | 248 (7.0%) | 121 (3.5%) |
| 30 to 34 Minutes | 655 (18.6%) | 803 (23.2%) |
| 35 to 39 Minutes | 28 (0.8%) | 38 (1.1%) |
| 40 to 44 Minutes | 155 (4.4%) | 111 (3.2%) |
| 45 to 59 Minutes | 87 (2.5%) | 254 (7.3%) |
| 60 to 89 Minutes | 261 (7.4%) | 143 (4.1%) |
| 90 or more Minutes | 135 (3.8%) | 23 (0.7%) |
Time of Departure to Work by Sex in Covington County
The most frequent times of departure to work in Covington County are 6:00 AM to 6:29 AM (948, 27.0%) for males and 7:00 AM to 7:29 AM (787, 22.7%) for females.
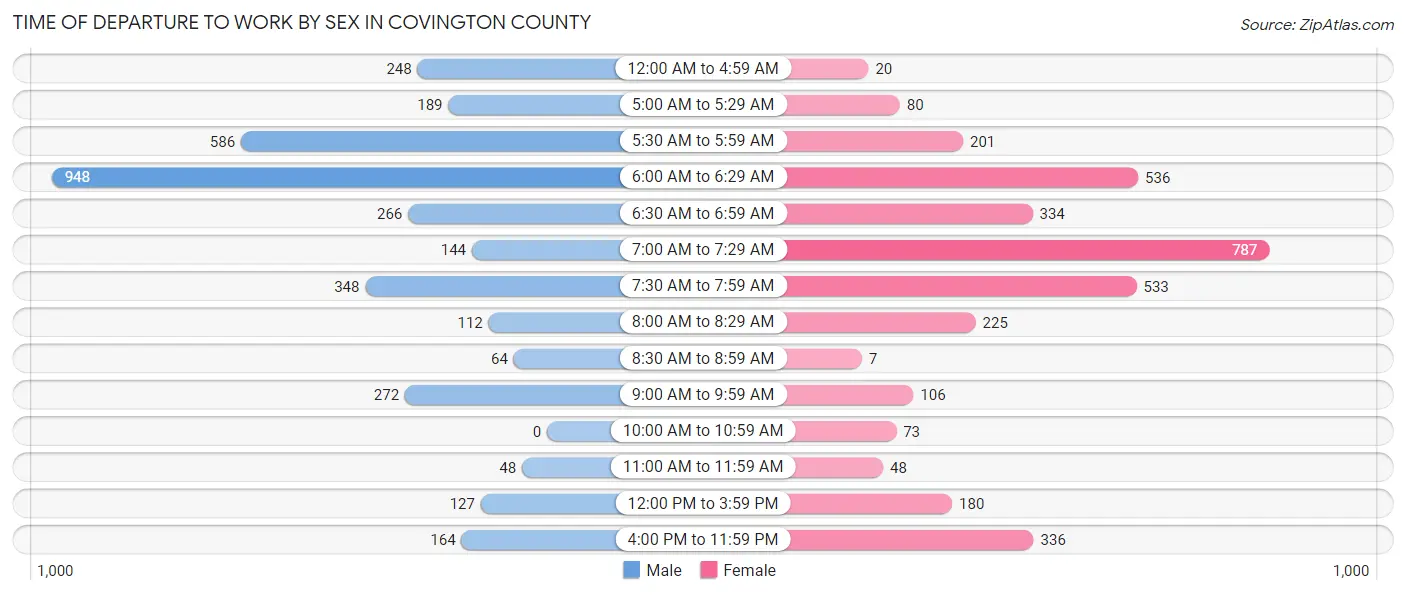
| Time of Departure | Male | Female |
| 12:00 AM to 4:59 AM | 248 (7.0%) | 20 (0.6%) |
| 5:00 AM to 5:29 AM | 189 (5.4%) | 80 (2.3%) |
| 5:30 AM to 5:59 AM | 586 (16.7%) | 201 (5.8%) |
| 6:00 AM to 6:29 AM | 948 (27.0%) | 536 (15.5%) |
| 6:30 AM to 6:59 AM | 266 (7.6%) | 334 (9.6%) |
| 7:00 AM to 7:29 AM | 144 (4.1%) | 787 (22.7%) |
| 7:30 AM to 7:59 AM | 348 (9.9%) | 533 (15.4%) |
| 8:00 AM to 8:29 AM | 112 (3.2%) | 225 (6.5%) |
| 8:30 AM to 8:59 AM | 64 (1.8%) | 7 (0.2%) |
| 9:00 AM to 9:59 AM | 272 (7.7%) | 106 (3.1%) |
| 10:00 AM to 10:59 AM | 0 (0.0%) | 73 (2.1%) |
| 11:00 AM to 11:59 AM | 48 (1.4%) | 48 (1.4%) |
| 12:00 PM to 3:59 PM | 127 (3.6%) | 180 (5.2%) |
| 4:00 PM to 11:59 PM | 164 (4.7%) | 336 (9.7%) |
| Total | 3,516 (100.0%) | 3,466 (100.0%) |
Housing Occupancy in Covington County
Occupancy by Ownership in Covington County
Of the total 6,954 dwellings in Covington County, owner-occupied units account for 5,241 (75.4%), while renter-occupied units make up 1,713 (24.6%).
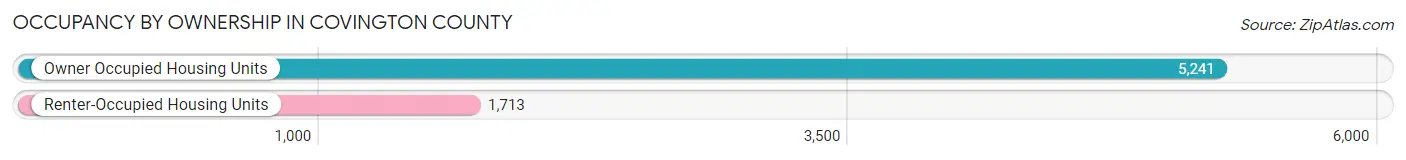
| Occupancy | # Housing Units | % Housing Units |
| Owner Occupied Housing Units | 5,241 | 75.4% |
| Renter-Occupied Housing Units | 1,713 | 24.6% |
| Total Occupied Housing Units | 6,954 | 100.0% |
Occupancy by Household Size in Covington County
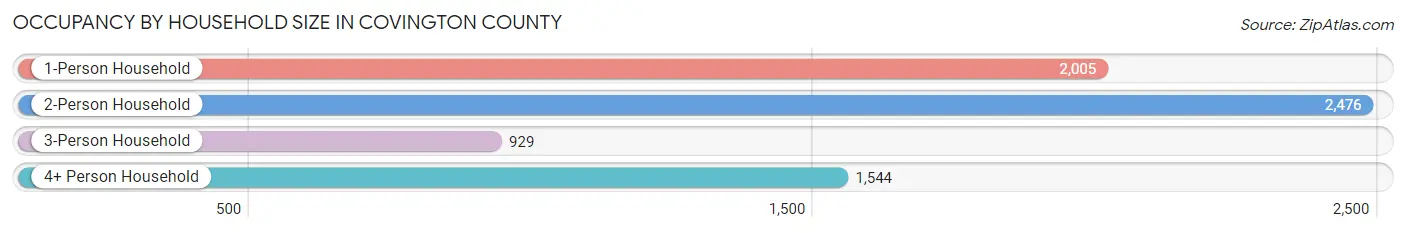
| Household Size | # Housing Units | % Housing Units |
| 1-Person Household | 2,005 | 28.8% |
| 2-Person Household | 2,476 | 35.6% |
| 3-Person Household | 929 | 13.4% |
| 4+ Person Household | 1,544 | 22.2% |
| Total Housing Units | 6,954 | 100.0% |
Occupancy by Ownership by Household Size in Covington County
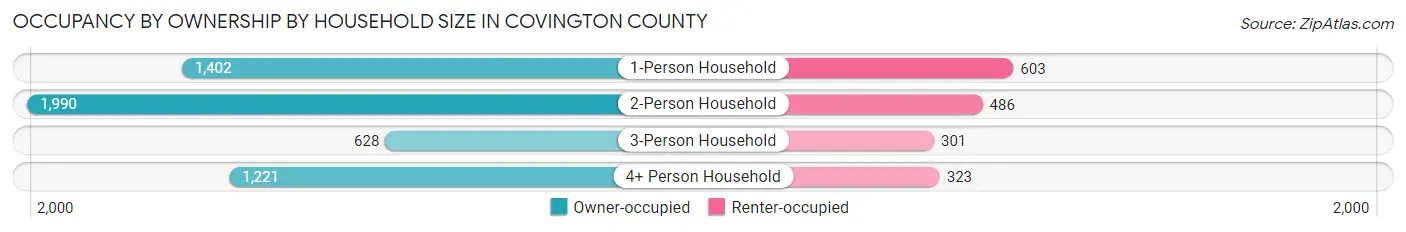
| Household Size | Owner-occupied | Renter-occupied |
| 1-Person Household | 1,402 (69.9%) | 603 (30.1%) |
| 2-Person Household | 1,990 (80.4%) | 486 (19.6%) |
| 3-Person Household | 628 (67.6%) | 301 (32.4%) |
| 4+ Person Household | 1,221 (79.1%) | 323 (20.9%) |
| Total Housing Units | 5,241 (75.4%) | 1,713 (24.6%) |
Occupancy by Educational Attainment in Covington County
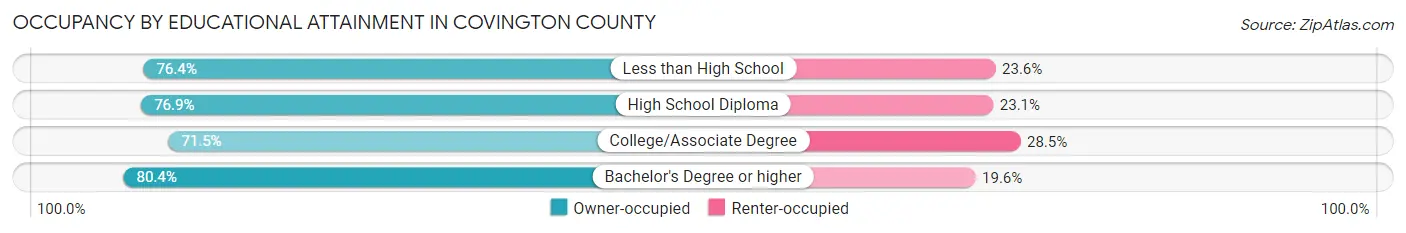
| Household Size | Owner-occupied | Renter-occupied |
| Less than High School | 956 (76.4%) | 295 (23.6%) |
| High School Diploma | 1,642 (76.9%) | 494 (23.1%) |
| College/Associate Degree | 1,799 (71.5%) | 718 (28.5%) |
| Bachelor's Degree or higher | 844 (80.4%) | 206 (19.6%) |
Occupancy by Age of Householder in Covington County
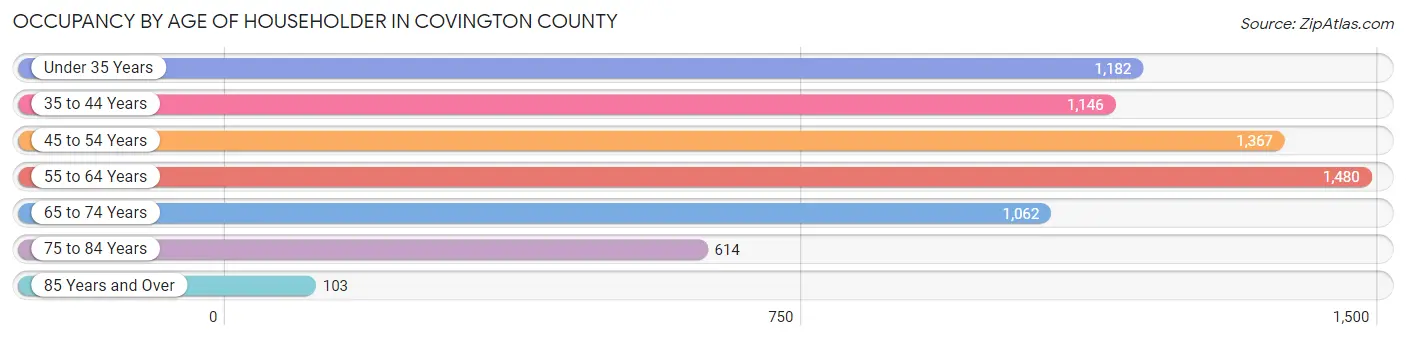
| Age Bracket | # Households | % Households |
| Under 35 Years | 1,182 | 17.0% |
| 35 to 44 Years | 1,146 | 16.5% |
| 45 to 54 Years | 1,367 | 19.7% |
| 55 to 64 Years | 1,480 | 21.3% |
| 65 to 74 Years | 1,062 | 15.3% |
| 75 to 84 Years | 614 | 8.8% |
| 85 Years and Over | 103 | 1.5% |
| Total | 6,954 | 100.0% |
Housing Finances in Covington County
Median Income by Occupancy in Covington County
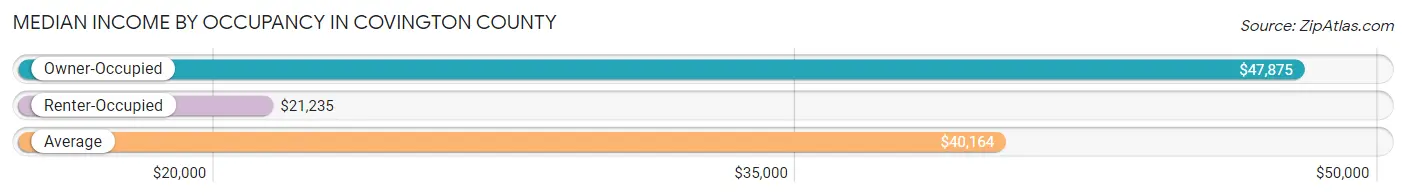
| Occupancy Type | # Households | Median Income |
| Owner-Occupied | 5,241 (75.4%) | $47,875 |
| Renter-Occupied | 1,713 (24.6%) | $21,235 |
| Average | 6,954 (100.0%) | $40,164 |
Occupancy by Householder Income Bracket in Covington County

| Income Bracket | Owner-occupied | Renter-occupied |
| Less than $5,000 | 244 (4.7%) | 29 (1.7%) |
| $5,000 to $9,999 | 80 (1.5%) | 295 (17.2%) |
| $10,000 to $14,999 | 565 (10.8%) | 285 (16.6%) |
| $15,000 to $19,999 | 409 (7.8%) | 206 (12.0%) |
| $20,000 to $24,999 | 254 (4.9%) | 84 (4.9%) |
| $25,000 to $34,999 | 343 (6.5%) | 155 (9.0%) |
| $35,000 to $49,999 | 819 (15.6%) | 313 (18.3%) |
| $50,000 to $74,999 | 874 (16.7%) | 87 (5.1%) |
| $75,000 to $99,999 | 383 (7.3%) | 161 (9.4%) |
| $100,000 to $149,999 | 790 (15.1%) | 78 (4.5%) |
| $150,000 or more | 480 (9.2%) | 20 (1.2%) |
| Total | 5,241 (100.0%) | 1,713 (100.0%) |
Monthly Housing Cost Tiers in Covington County
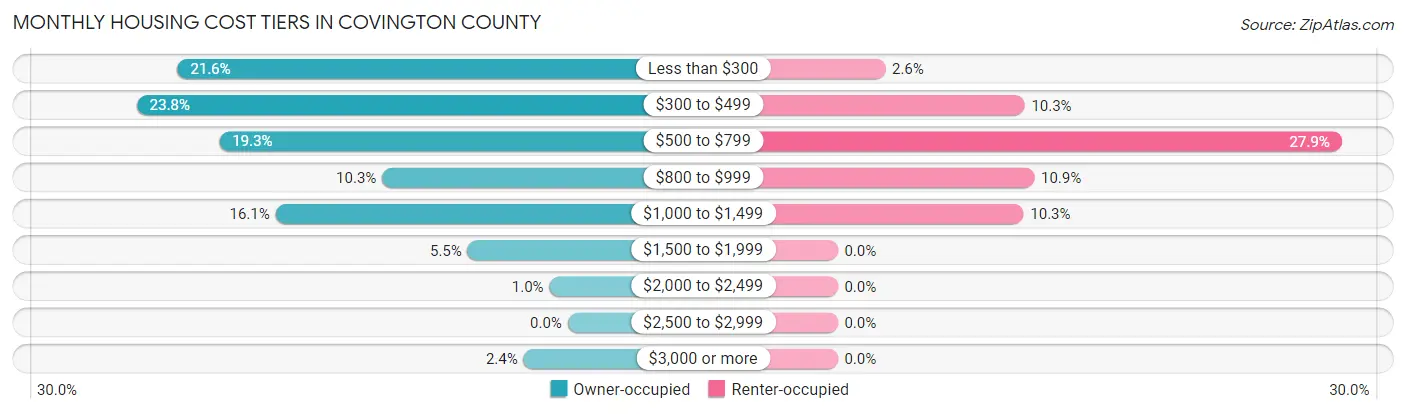
| Monthly Cost | Owner-occupied | Renter-occupied |
| Less than $300 | 1,130 (21.6%) | 45 (2.6%) |
| $300 to $499 | 1,248 (23.8%) | 177 (10.3%) |
| $500 to $799 | 1,009 (19.3%) | 477 (27.9%) |
| $800 to $999 | 537 (10.2%) | 186 (10.9%) |
| $1,000 to $1,499 | 846 (16.1%) | 176 (10.3%) |
| $1,500 to $1,999 | 290 (5.5%) | 0 (0.0%) |
| $2,000 to $2,499 | 53 (1.0%) | 0 (0.0%) |
| $2,500 to $2,999 | 0 (0.0%) | 0 (0.0%) |
| $3,000 or more | 128 (2.4%) | 0 (0.0%) |
| Total | 5,241 (100.0%) | 1,713 (100.0%) |
Physical Housing Characteristics in Covington County
Housing Structures in Covington County
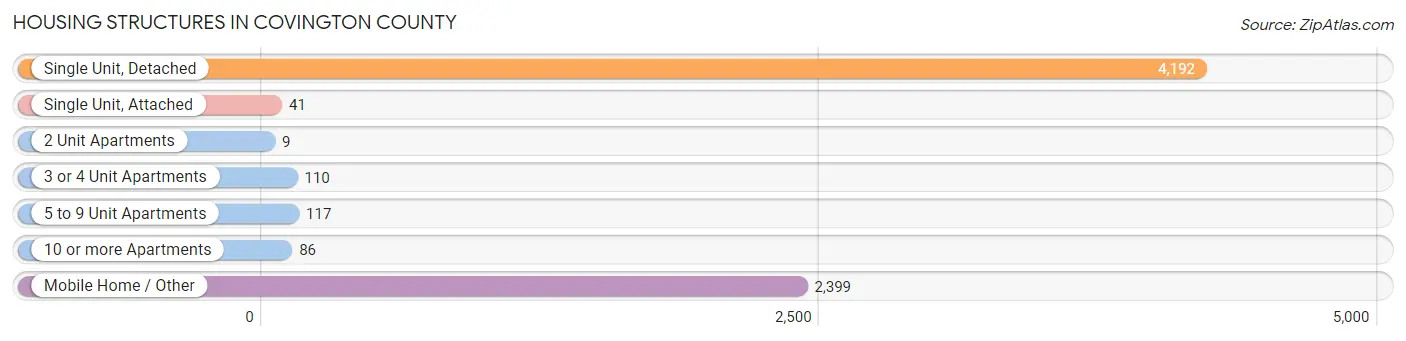
| Structure Type | # Housing Units | % Housing Units |
| Single Unit, Detached | 4,192 | 60.3% |
| Single Unit, Attached | 41 | 0.6% |
| 2 Unit Apartments | 9 | 0.1% |
| 3 or 4 Unit Apartments | 110 | 1.6% |
| 5 to 9 Unit Apartments | 117 | 1.7% |
| 10 or more Apartments | 86 | 1.2% |
| Mobile Home / Other | 2,399 | 34.5% |
| Total | 6,954 | 100.0% |
Housing Structures by Occupancy in Covington County
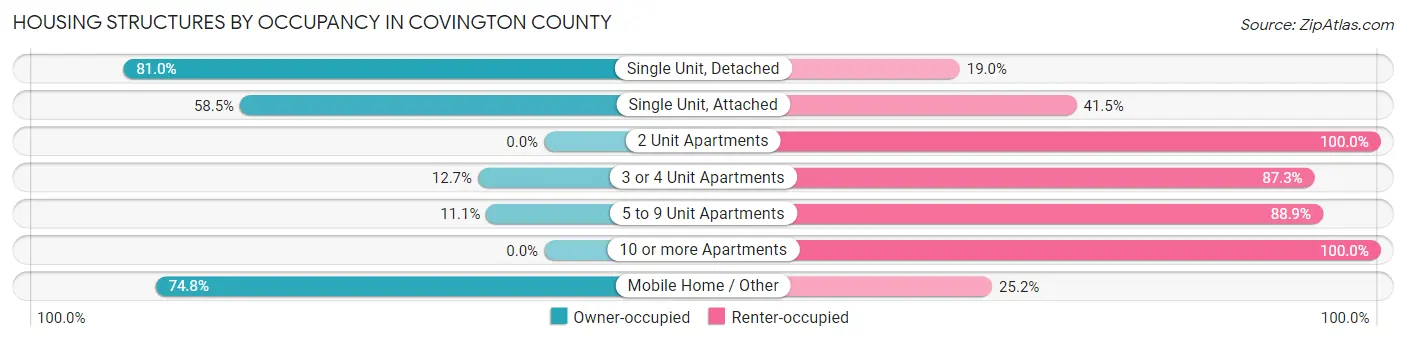
| Structure Type | Owner-occupied | Renter-occupied |
| Single Unit, Detached | 3,396 (81.0%) | 796 (19.0%) |
| Single Unit, Attached | 24 (58.5%) | 17 (41.5%) |
| 2 Unit Apartments | 0 (0.0%) | 9 (100.0%) |
| 3 or 4 Unit Apartments | 14 (12.7%) | 96 (87.3%) |
| 5 to 9 Unit Apartments | 13 (11.1%) | 104 (88.9%) |
| 10 or more Apartments | 0 (0.0%) | 86 (100.0%) |
| Mobile Home / Other | 1,794 (74.8%) | 605 (25.2%) |
| Total | 5,241 (75.4%) | 1,713 (24.6%) |
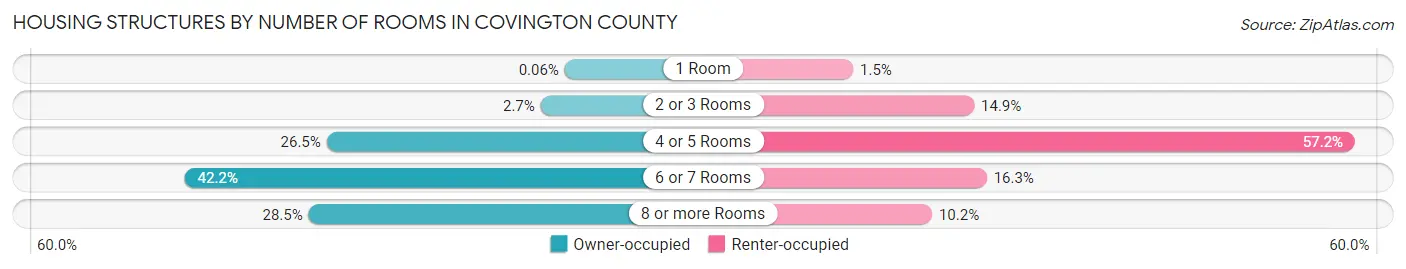
Housing Structures by Number of Rooms in Covington County
| Number of Rooms | Owner-occupied | Renter-occupied |
| 1 Room | 3 (0.1%) | 25 (1.5%) |
| 2 or 3 Rooms | 143 (2.7%) | 255 (14.9%) |
| 4 or 5 Rooms | 1,388 (26.5%) | 979 (57.2%) |
| 6 or 7 Rooms | 2,214 (42.2%) | 279 (16.3%) |
| 8 or more Rooms | 1,493 (28.5%) | 175 (10.2%) |
| Total | 5,241 (100.0%) | 1,713 (100.0%) |
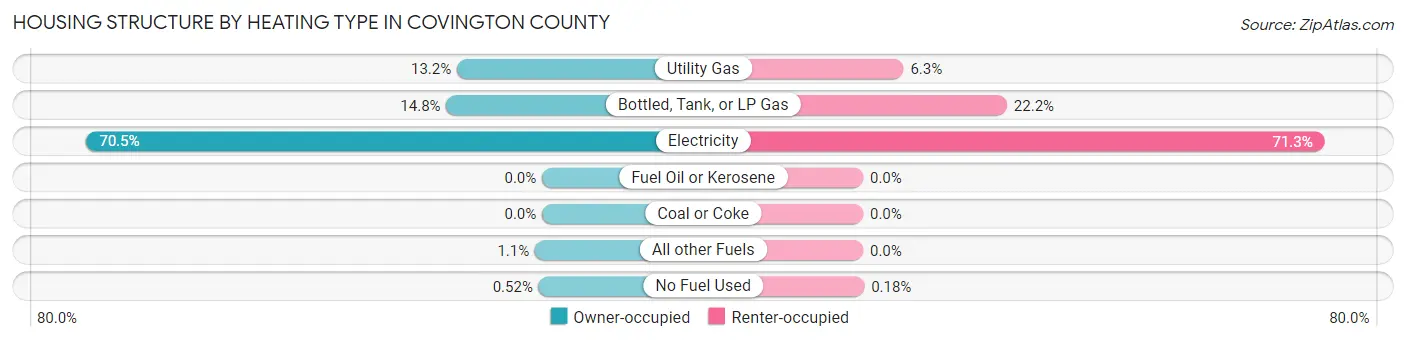
Housing Structure by Heating Type in Covington County
| Heating Type | Owner-occupied | Renter-occupied |
| Utility Gas | 689 (13.2%) | 107 (6.2%) |
| Bottled, Tank, or LP Gas | 775 (14.8%) | 381 (22.2%) |
| Electricity | 3,693 (70.5%) | 1,222 (71.3%) |
| Fuel Oil or Kerosene | 0 (0.0%) | 0 (0.0%) |
| Coal or Coke | 0 (0.0%) | 0 (0.0%) |
| All other Fuels | 57 (1.1%) | 0 (0.0%) |
| No Fuel Used | 27 (0.5%) | 3 (0.2%) |
| Total | 5,241 (100.0%) | 1,713 (100.0%) |
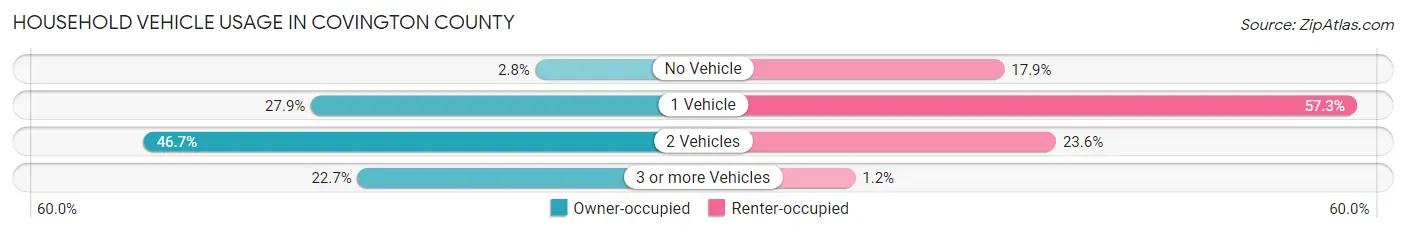
Household Vehicle Usage in Covington County
| Vehicles per Household | Owner-occupied | Renter-occupied |
| No Vehicle | 144 (2.8%) | 306 (17.9%) |
| 1 Vehicle | 1,462 (27.9%) | 982 (57.3%) |
| 2 Vehicles | 2,445 (46.7%) | 405 (23.6%) |
| 3 or more Vehicles | 1,190 (22.7%) | 20 (1.2%) |
| Total | 5,241 (100.0%) | 1,713 (100.0%) |
Real Estate & Mortgages in Covington County
Real Estate and Mortgage Overview in Covington County
| Characteristic | Without Mortgage | With Mortgage |
| Housing Units | 3,004 | 2,237 |
| Median Property Value | $72,200 | $79,500 |
| Median Household Income | $38,010 | $363 |
| Monthly Housing Costs | $346 | $128 |
| Real Estate Taxes | $333 | $880 |
Property Value by Mortgage Status in Covington County
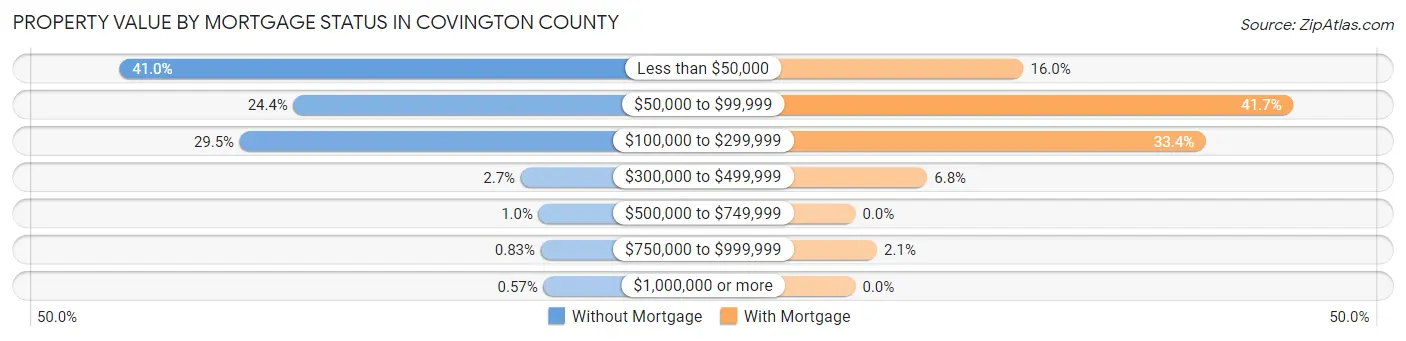
| Property Value | Without Mortgage | With Mortgage |
| Less than $50,000 | 1,231 (41.0%) | 358 (16.0%) |
| $50,000 to $99,999 | 732 (24.4%) | 933 (41.7%) |
| $100,000 to $299,999 | 886 (29.5%) | 747 (33.4%) |
| $300,000 to $499,999 | 82 (2.7%) | 153 (6.8%) |
| $500,000 to $749,999 | 31 (1.0%) | 0 (0.0%) |
| $750,000 to $999,999 | 25 (0.8%) | 46 (2.1%) |
| $1,000,000 or more | 17 (0.6%) | 0 (0.0%) |
| Total | 3,004 (100.0%) | 2,237 (100.0%) |
Household Income by Mortgage Status in Covington County
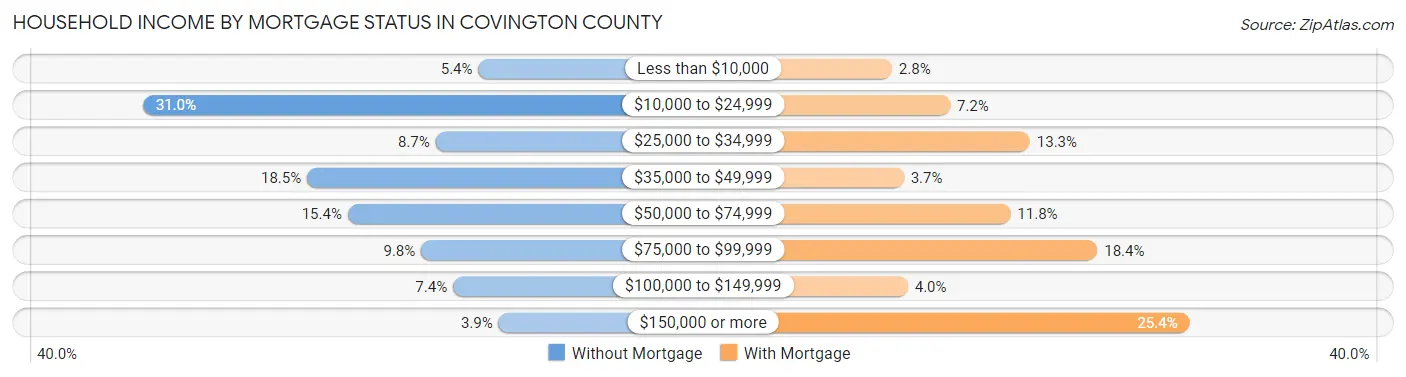
| Household Income | Without Mortgage | With Mortgage |
| Less than $10,000 | 163 (5.4%) | 62 (2.8%) |
| $10,000 to $24,999 | 931 (31.0%) | 161 (7.2%) |
| $25,000 to $34,999 | 261 (8.7%) | 297 (13.3%) |
| $35,000 to $49,999 | 555 (18.5%) | 82 (3.7%) |
| $50,000 to $74,999 | 462 (15.4%) | 264 (11.8%) |
| $75,000 to $99,999 | 294 (9.8%) | 412 (18.4%) |
| $100,000 to $149,999 | 221 (7.4%) | 89 (4.0%) |
| $150,000 or more | 117 (3.9%) | 569 (25.4%) |
| Total | 3,004 (100.0%) | 2,237 (100.0%) |
Property Value to Household Income Ratio in Covington County
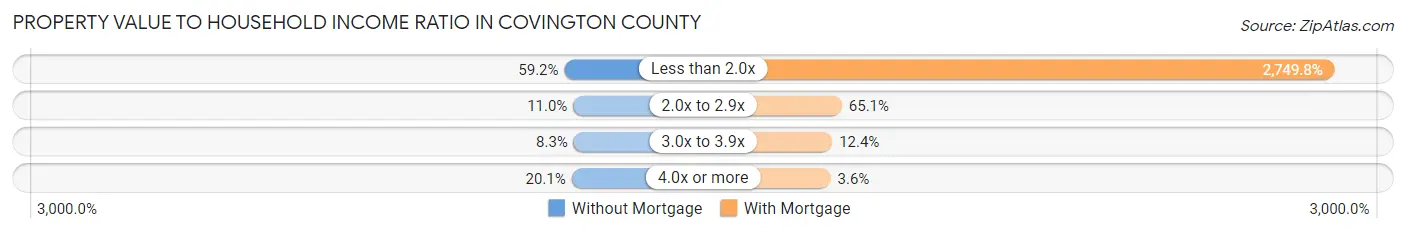
| Value-to-Income Ratio | Without Mortgage | With Mortgage |
| Less than 2.0x | 1,777 (59.2%) | 61,513 (2,749.8%) |
| 2.0x to 2.9x | 330 (11.0%) | 1,457 (65.1%) |
| 3.0x to 3.9x | 249 (8.3%) | 278 (12.4%) |
| 4.0x or more | 604 (20.1%) | 81 (3.6%) |
| Total | 3,004 (100.0%) | 2,237 (100.0%) |
Real Estate Taxes by Mortgage Status in Covington County
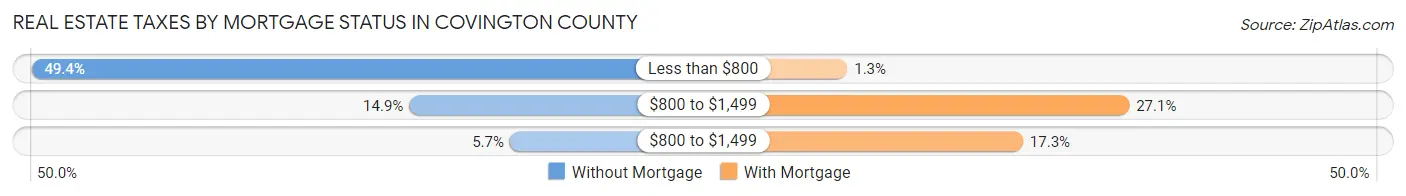
| Property Taxes | Without Mortgage | With Mortgage |
| Less than $800 | 1,483 (49.4%) | 29 (1.3%) |
| $800 to $1,499 | 447 (14.9%) | 605 (27.1%) |
| $800 to $1,499 | 171 (5.7%) | 388 (17.3%) |
| Total | 3,004 (100.0%) | 2,237 (100.0%) |
Health & Disability in Covington County
Health Insurance Coverage by Age in Covington County
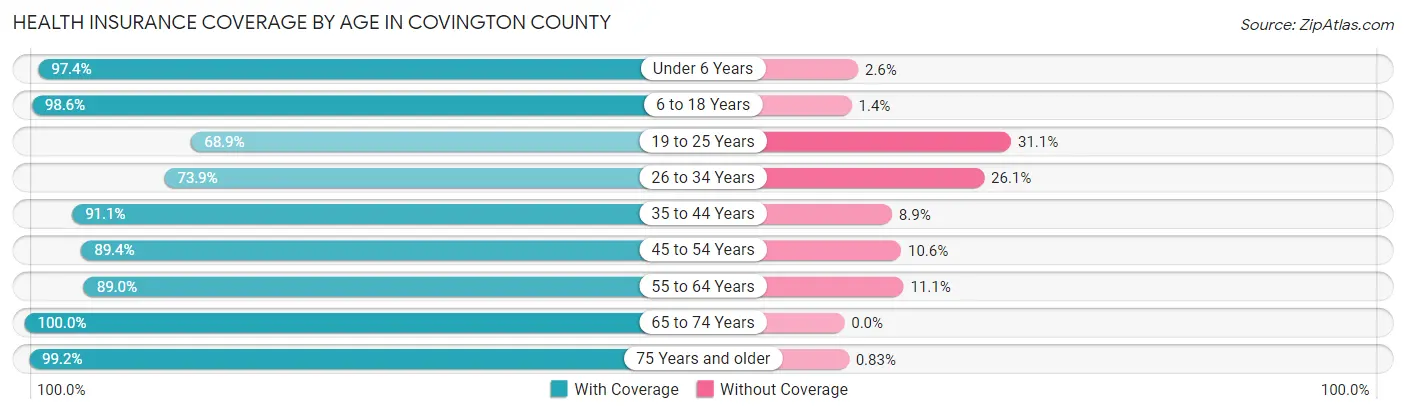
| Age Bracket | With Coverage | Without Coverage |
| Under 6 Years | 1,330 (97.4%) | 35 (2.6%) |
| 6 to 18 Years | 3,253 (98.6%) | 45 (1.4%) |
| 19 to 25 Years | 1,090 (68.9%) | 492 (31.1%) |
| 26 to 34 Years | 1,452 (73.9%) | 512 (26.1%) |
| 35 to 44 Years | 2,165 (91.1%) | 211 (8.9%) |
| 45 to 54 Years | 1,893 (89.4%) | 224 (10.6%) |
| 55 to 64 Years | 2,085 (88.9%) | 259 (11.1%) |
| 65 to 74 Years | 1,731 (100.0%) | 0 (0.0%) |
| 75 Years and older | 1,200 (99.2%) | 10 (0.8%) |
| Total | 16,199 (90.1%) | 1,788 (9.9%) |
Health Insurance Coverage by Citizenship Status in Covington County
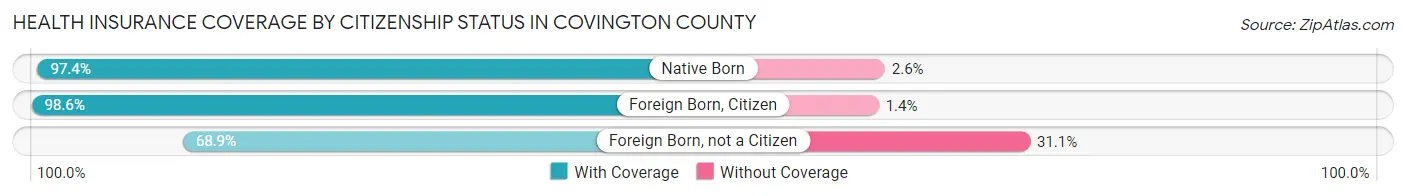
| Citizenship Status | With Coverage | Without Coverage |
| Native Born | 1,330 (97.4%) | 35 (2.6%) |
| Foreign Born, Citizen | 3,253 (98.6%) | 45 (1.4%) |
| Foreign Born, not a Citizen | 1,090 (68.9%) | 492 (31.1%) |
Health Insurance Coverage by Household Income in Covington County
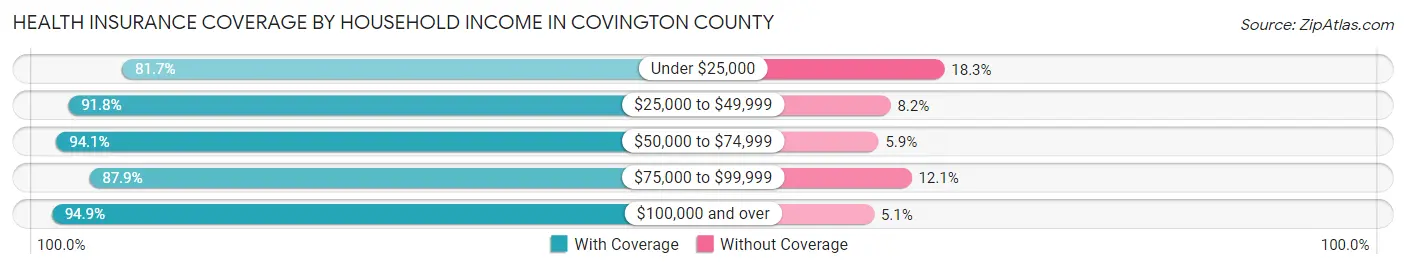
| Household Income | With Coverage | Without Coverage |
| Under $25,000 | 3,836 (81.7%) | 858 (18.3%) |
| $25,000 to $49,999 | 3,996 (91.8%) | 356 (8.2%) |
| $50,000 to $74,999 | 2,757 (94.1%) | 174 (5.9%) |
| $75,000 to $99,999 | 1,175 (87.9%) | 162 (12.1%) |
| $100,000 and over | 4,435 (94.9%) | 238 (5.1%) |
Public vs Private Health Insurance Coverage by Age in Covington County
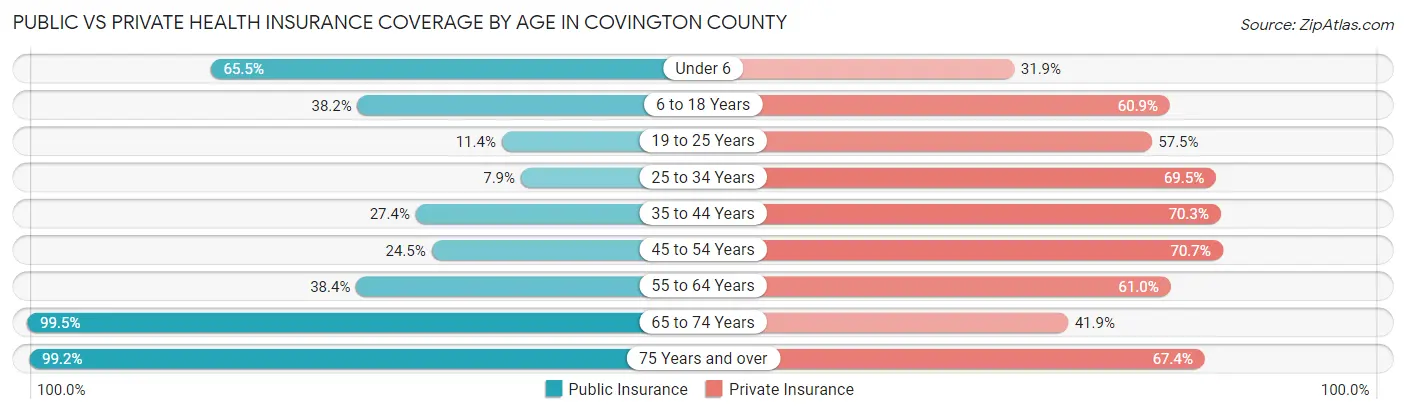
| Age Bracket | Public Insurance | Private Insurance |
| Under 6 | 894 (65.5%) | 436 (31.9%) |
| 6 to 18 Years | 1,260 (38.2%) | 2,008 (60.9%) |
| 19 to 25 Years | 181 (11.4%) | 909 (57.5%) |
| 25 to 34 Years | 155 (7.9%) | 1,364 (69.5%) |
| 35 to 44 Years | 651 (27.4%) | 1,671 (70.3%) |
| 45 to 54 Years | 518 (24.5%) | 1,496 (70.7%) |
| 55 to 64 Years | 901 (38.4%) | 1,430 (61.0%) |
| 65 to 74 Years | 1,723 (99.5%) | 726 (41.9%) |
| 75 Years and over | 1,200 (99.2%) | 815 (67.4%) |
| Total | 7,483 (41.6%) | 10,855 (60.4%) |
Disability Status by Sex by Age in Covington County
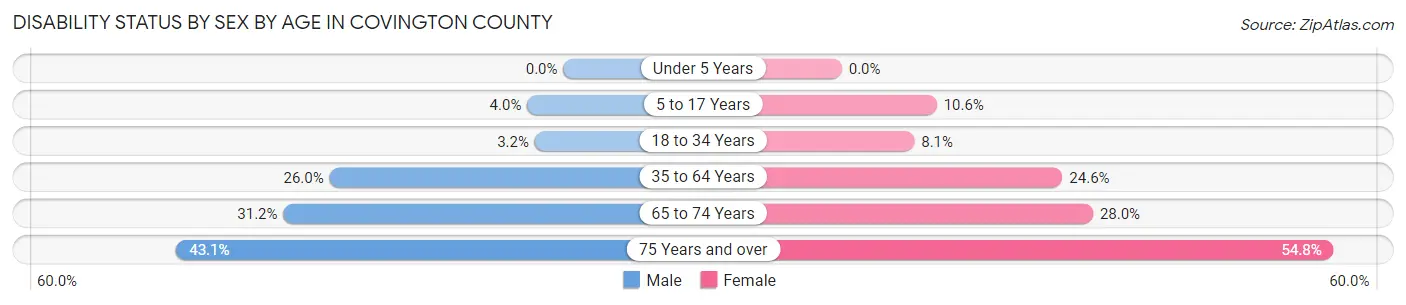
| Age Bracket | Male | Female |
| Under 5 Years | 0 (0.0%) | 0 (0.0%) |
| 5 to 17 Years | 67 (4.0%) | 170 (10.6%) |
| 18 to 34 Years | 63 (3.2%) | 143 (8.1%) |
| 35 to 64 Years | 836 (26.0%) | 891 (24.6%) |
| 65 to 74 Years | 241 (31.2%) | 268 (28.0%) |
| 75 Years and over | 228 (43.1%) | 373 (54.8%) |
Disability Class by Sex by Age in Covington County
Disability Class: Hearing Difficulty
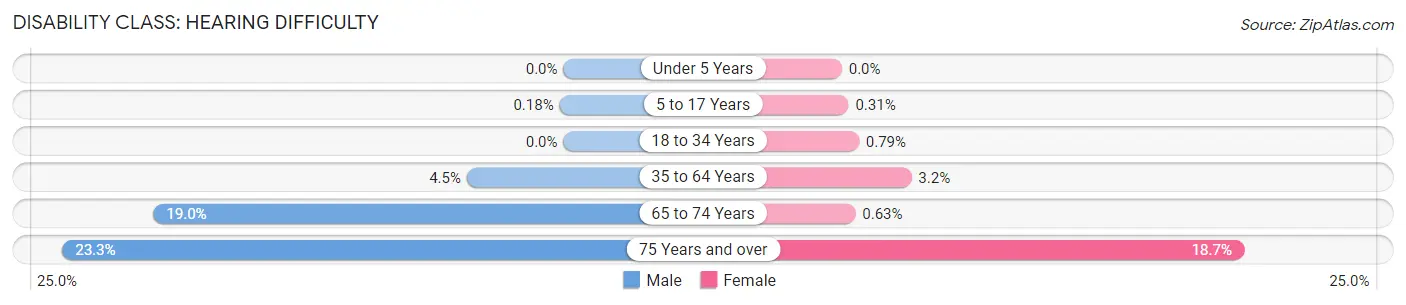
| Age Bracket | Male | Female |
| Under 5 Years | 0 (0.0%) | 0 (0.0%) |
| 5 to 17 Years | 3 (0.2%) | 5 (0.3%) |
| 18 to 34 Years | 0 (0.0%) | 14 (0.8%) |
| 35 to 64 Years | 144 (4.5%) | 117 (3.2%) |
| 65 to 74 Years | 147 (19.0%) | 6 (0.6%) |
| 75 Years and over | 123 (23.3%) | 127 (18.6%) |
Disability Class: Vision Difficulty
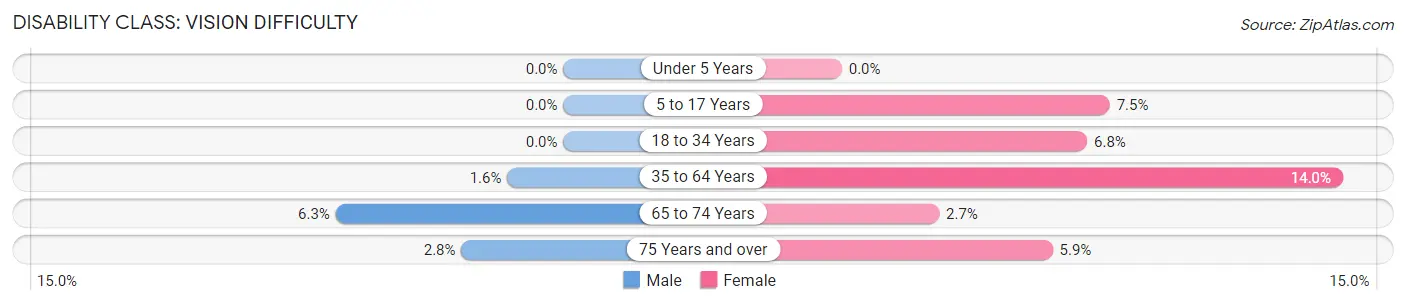
| Age Bracket | Male | Female |
| Under 5 Years | 0 (0.0%) | 0 (0.0%) |
| 5 to 17 Years | 0 (0.0%) | 120 (7.5%) |
| 18 to 34 Years | 0 (0.0%) | 121 (6.8%) |
| 35 to 64 Years | 50 (1.6%) | 506 (14.0%) |
| 65 to 74 Years | 49 (6.3%) | 26 (2.7%) |
| 75 Years and over | 15 (2.8%) | 40 (5.9%) |
Disability Class: Cognitive Difficulty
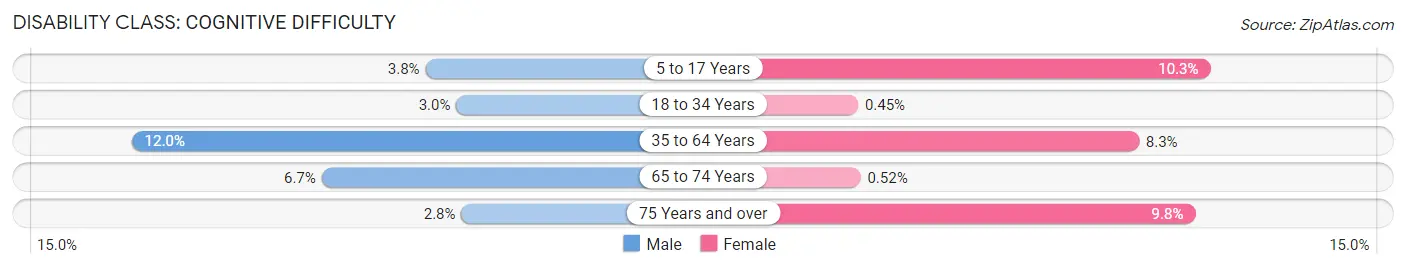
| Age Bracket | Male | Female |
| 5 to 17 Years | 64 (3.8%) | 165 (10.3%) |
| 18 to 34 Years | 59 (3.0%) | 8 (0.4%) |
| 35 to 64 Years | 386 (12.0%) | 300 (8.3%) |
| 65 to 74 Years | 52 (6.7%) | 5 (0.5%) |
| 75 Years and over | 15 (2.8%) | 67 (9.8%) |
Disability Class: Ambulatory Difficulty
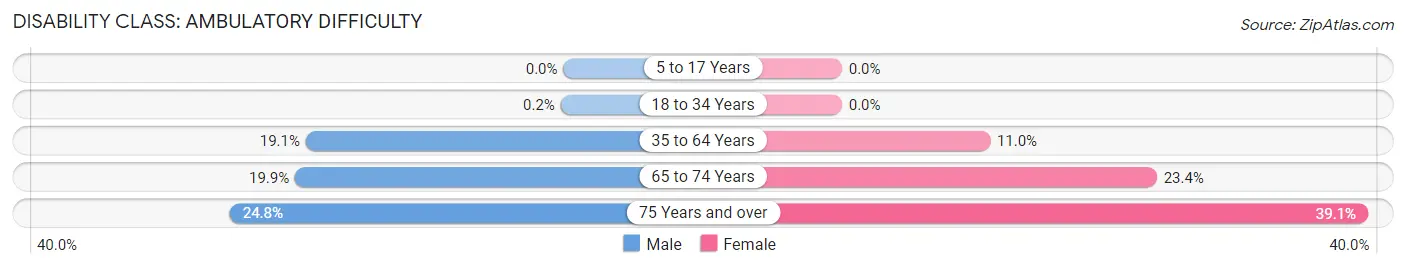
| Age Bracket | Male | Female |
| 5 to 17 Years | 0 (0.0%) | 0 (0.0%) |
| 18 to 34 Years | 4 (0.2%) | 0 (0.0%) |
| 35 to 64 Years | 614 (19.1%) | 399 (11.0%) |
| 65 to 74 Years | 154 (19.9%) | 224 (23.4%) |
| 75 Years and over | 131 (24.8%) | 266 (39.1%) |
Disability Class: Self-Care Difficulty
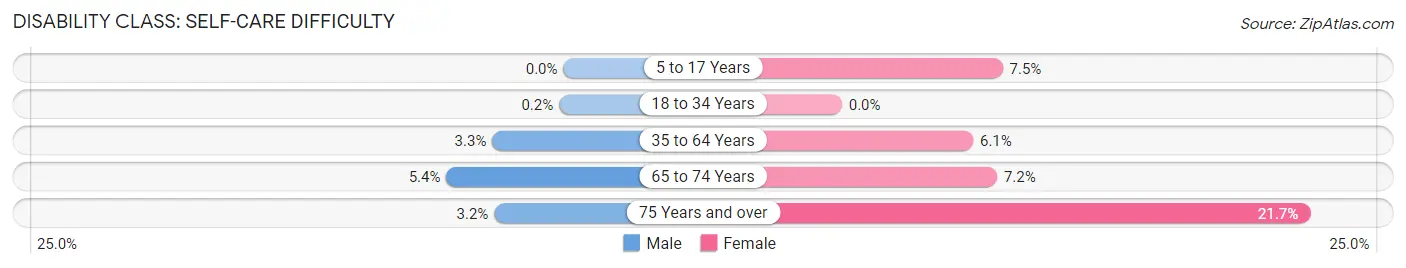
| Age Bracket | Male | Female |
| 5 to 17 Years | 0 (0.0%) | 120 (7.5%) |
| 18 to 34 Years | 4 (0.2%) | 0 (0.0%) |
| 35 to 64 Years | 106 (3.3%) | 221 (6.1%) |
| 65 to 74 Years | 42 (5.4%) | 69 (7.2%) |
| 75 Years and over | 17 (3.2%) | 148 (21.7%) |
Technology Access in Covington County
Computing Device Access in Covington County
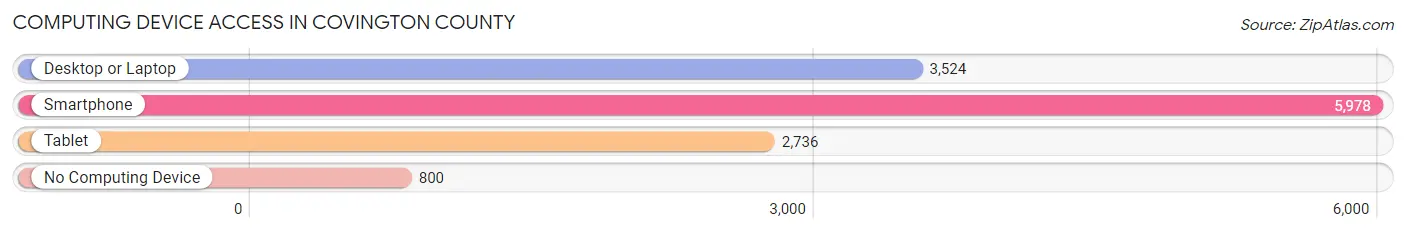
| Device Type | # Households | % Households |
| Desktop or Laptop | 3,524 | 50.7% |
| Smartphone | 5,978 | 86.0% |
| Tablet | 2,736 | 39.3% |
| No Computing Device | 800 | 11.5% |
| Total | 6,954 | 100.0% |
Internet Access in Covington County
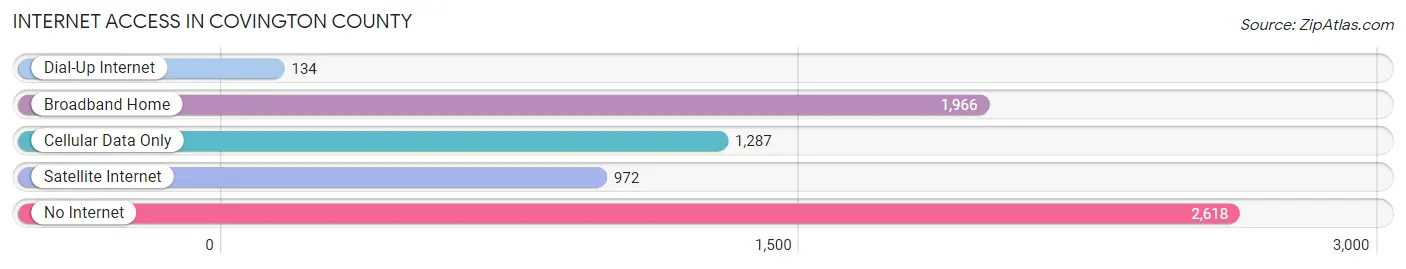
| Internet Type | # Households | % Households |
| Dial-Up Internet | 134 | 1.9% |
| Broadband Home | 1,966 | 28.3% |
| Cellular Data Only | 1,287 | 18.5% |
| Satellite Internet | 972 | 14.0% |
| No Internet | 2,618 | 37.7% |
| Total | 6,954 | 100.0% |
Covington County Summary
Covington County is located in the southeastern corner of Mississippi, bordered by the states of Alabama and Louisiana. It is part of the Hattiesburg, MS Metropolitan Statistical Area. The county was established in 1819 and named after General Leonard Covington, a hero of the War of 1812. As of the 2010 census, the population was 19,568.
Geography
Covington County is located in the southeastern corner of Mississippi, bordered by the states of Alabama and Louisiana. It is part of the Hattiesburg, MS Metropolitan Statistical Area. The county has a total area of 576 square miles, of which 574 square miles is land and 2 square miles (0.3%) is water. The terrain is mostly flat, with some rolling hills in the northern part of the county. The county is drained by the Leaf and Bouie Rivers.
The county is home to several state parks, including De Soto National Forest, Paul B. Johnson State Park, and Percy Quin State Park.
History
Covington County was established in 1819 and named after General Leonard Covington, a hero of the War of 1812. The county was originally part of the Choctaw Nation, and was later part of the Mississippi Territory.
The county was home to several Native American tribes, including the Choctaw, Chickasaw, and Natchez. The first European settlers arrived in the area in the early 1800s.
The county was a major cotton producer during the antebellum period, and the economy was largely based on agriculture. The county was also home to several Confederate military camps during the Civil War.
Economy
The economy of Covington County is largely based on agriculture. The county is home to several large farms, and the main crops grown are cotton, corn, soybeans, and wheat. The county is also home to several timber companies, and the lumber industry is an important part of the local economy.
The county is home to several manufacturing companies, including a furniture factory, a paper mill, and a plastics plant. The county is also home to several retail stores, restaurants, and other businesses.
Demographics
As of the 2010 census, the population of Covington County was 19,568. The racial makeup of the county was 79.3% White, 18.2% African American, 0.4% Native American, 0.3% Asian, 0.1% Pacific Islander, 0.7% from other races, and 1.1% from two or more races. Hispanic or Latino of any race were 1.7% of the population.
The median income for a household in the county was $30,945, and the median income for a family was $37,945. The per capita income for the county was $16,845. About 17.2% of families and 21.3% of the population were below the poverty line, including 28.2% of those under age 18 and 17.2% of those age 65 or over.
Common Questions
What is Per Capita Income in Covington County?
Per Capita income in Covington County is $24,147.
What is the Median Family Income in Covington County?
Median Family Income in Covington County is $51,913.
What is the Median Household income in Covington County?
Median Household Income in Covington County is $40,164.
What is Income or Wage Gap in Covington County?
Income or Wage Gap in Covington County is 29.1%.
Women in Covington County earn 70.9 cents for every dollar earned by a man.
What is Family Income Deficit in Covington County?
Family Income Deficit in Covington County is $12,267.
Families that are below poverty line in Covington County earn $12,267 less on average than the poverty threshold level.
What is Inequality or Gini Index in Covington County?
Inequality or Gini Index in Covington County is 0.49.
What is the Total Population of Covington County?
Total Population of Covington County is 18,323.
What is the Total Male Population of Covington County?
Total Male Population of Covington County is 9,001.
What is the Total Female Population of Covington County?
Total Female Population of Covington County is 9,322.
What is the Ratio of Males per 100 Females in Covington County?
There are 96.56 Males per 100 Females in Covington County.
What is the Ratio of Females per 100 Males in Covington County?
There are 103.57 Females per 100 Males in Covington County.
What is the Median Population Age in Covington County?
Median Population Age in Covington County is 37.8 Years.
What is the Average Family Size in Covington County
Average Family Size in Covington County is 3.2 People.
What is the Average Household Size in Covington County
Average Household Size in Covington County is 2.6 People.
How Large is the Labor Force in Covington County?
There are 7,603 People in the Labor Forcein in Covington County.
What is the Percentage of People in the Labor Force in Covington County?
53.4% of People are in the Labor Force in Covington County.
What is the Unemployment Rate in Covington County?
Unemployment Rate in Covington County is 5.8%.