Zip Codes with the Highest Percentage of Population Taking Taxi / Cab to Work in Florissant, MO
RELATED REPORTS & OPTIONS
Taxi / Cab
Florissant
Compare Zip Codes
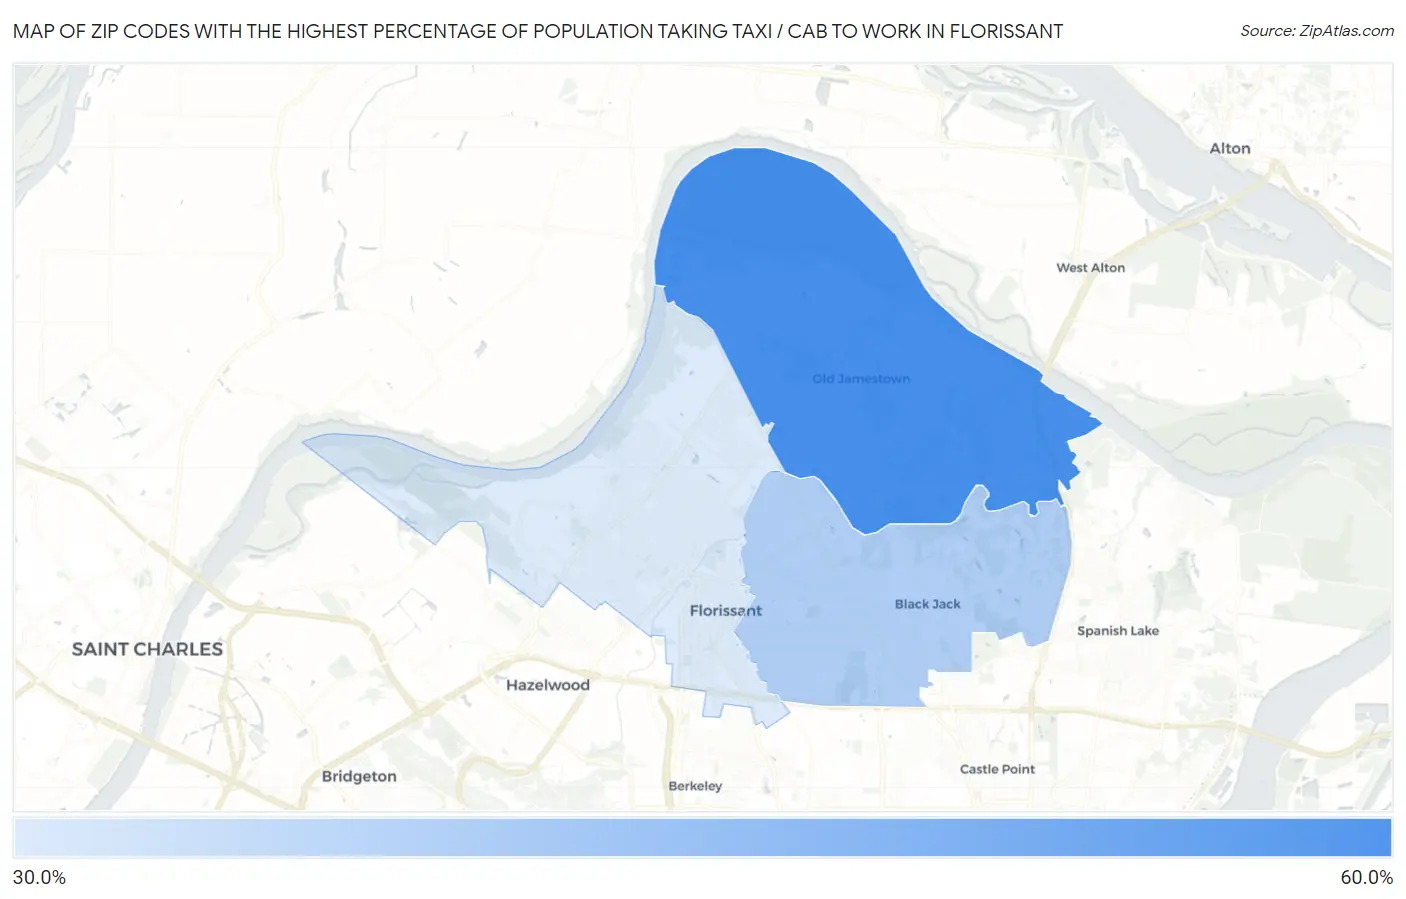
Map of Zip Codes with the Highest Percentage of Population Taking Taxi / Cab to Work in Florissant
32.5%
56.5%
Zip Codes with the Highest Percentage of Population Taking Taxi / Cab to Work in Florissant, MO
| Zip Code | % Take Taxi / Cab | vs State | vs National | |
| 1. | 63034 | 56.5% | 40.5%(+16.0)#41 | 38.2%(+18.3)#1,242 |
| 2. | 63033 | 39.5% | 40.5%(-1.00)#158 | 38.2%(+1.30)#6,829 |
| 3. | 63031 | 32.5% | 40.5%(-8.00)#224 | 38.2%(-5.70)#9,982 |
1
Common Questions
What are the Top Zip Codes with the Highest Percentage of Population Taking Taxi / Cab to Work in Florissant, MO?
Top Zip Codes with the Highest Percentage of Population Taking Taxi / Cab to Work in Florissant, MO are:
What zip code has the Highest Percentage of Population Taking Taxi / Cab to Work in Florissant, MO?
63034 has the Highest Percentage of Population Taking Taxi / Cab to Work in Florissant, MO with 56.5%.
What is the Percentage of Population Taking Taxi / Cab to Work in Florissant, MO?
Percentage of Population Taking Taxi / Cab to Work in Florissant is 32.8%.
What is the Percentage of Population Taking Taxi / Cab to Work in Missouri?
Percentage of Population Taking Taxi / Cab to Work in Missouri is 40.5%.
What is the Percentage of Population Taking Taxi / Cab to Work in the United States?
Percentage of Population Taking Taxi / Cab to Work in the United States is 38.2%.