Zip Codes with the Highest Percentage of Population Employed in Health Diagnosing & Treating in Florissant, MO
RELATED REPORTS & OPTIONS
Health Diagnosing & Treating
Florissant
Compare Zip Codes
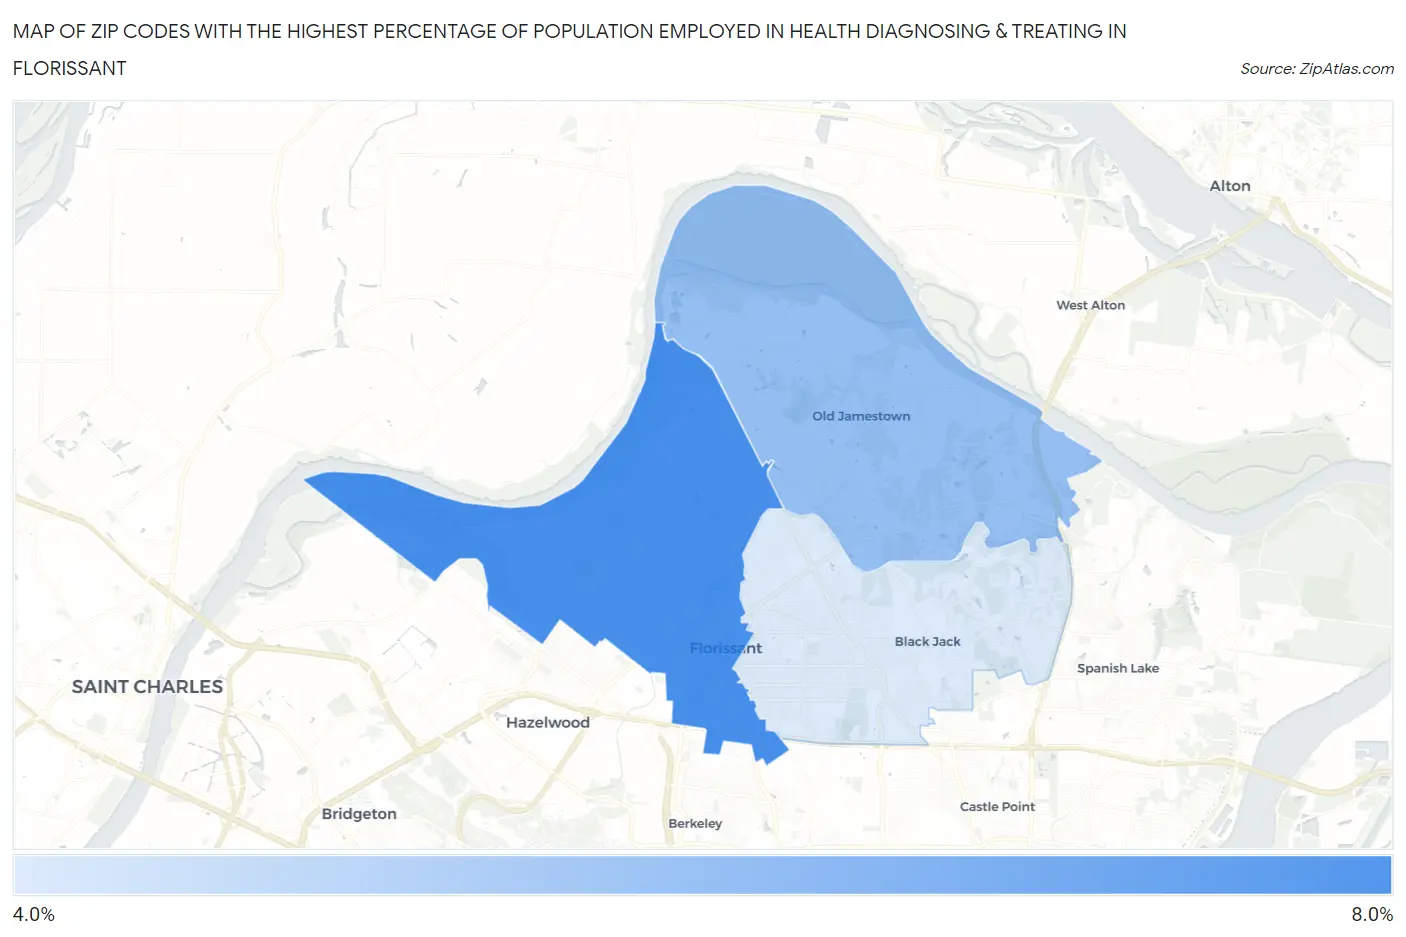
Map of Zip Codes with the Highest Percentage of Population Employed in Health Diagnosing & Treating in Florissant
4.4%
7.3%
Zip Codes with the Highest Percentage of Population Employed in Health Diagnosing & Treating in Florissant, MO
| Zip Code | % Employed | vs State | vs National | |
| 1. | 63031 | 7.3% | 6.9%(+0.429)#302 | 6.2%(+1.10)#9,281 |
| 2. | 63034 | 5.8% | 6.9%(-1.15)#452 | 6.2%(-0.476)#14,728 |
| 3. | 63033 | 4.4% | 6.9%(-2.54)#598 | 6.2%(-1.87)#20,067 |
1
Common Questions
What are the Top Zip Codes with the Highest Percentage of Population Employed in Health Diagnosing & Treating in Florissant, MO?
Top Zip Codes with the Highest Percentage of Population Employed in Health Diagnosing & Treating in Florissant, MO are:
What zip code has the Highest Percentage of Population Employed in Health Diagnosing & Treating in Florissant, MO?
63031 has the Highest Percentage of Population Employed in Health Diagnosing & Treating in Florissant, MO with 7.3%.
What is the Percentage of Population Employed in Health Diagnosing & Treating in Florissant, MO?
Percentage of Population Employed in Health Diagnosing & Treating in Florissant is 5.7%.
What is the Percentage of Population Employed in Health Diagnosing & Treating in Missouri?
Percentage of Population Employed in Health Diagnosing & Treating in Missouri is 6.9%.
What is the Percentage of Population Employed in Health Diagnosing & Treating in the United States?
Percentage of Population Employed in Health Diagnosing & Treating in the United States is 6.2%.