Zip Codes with the Highest Percentage of Population Employed in Administrative & Support Services in Florissant, MO
RELATED REPORTS & OPTIONS
Administrative & Support Services
Florissant
Compare Zip Codes
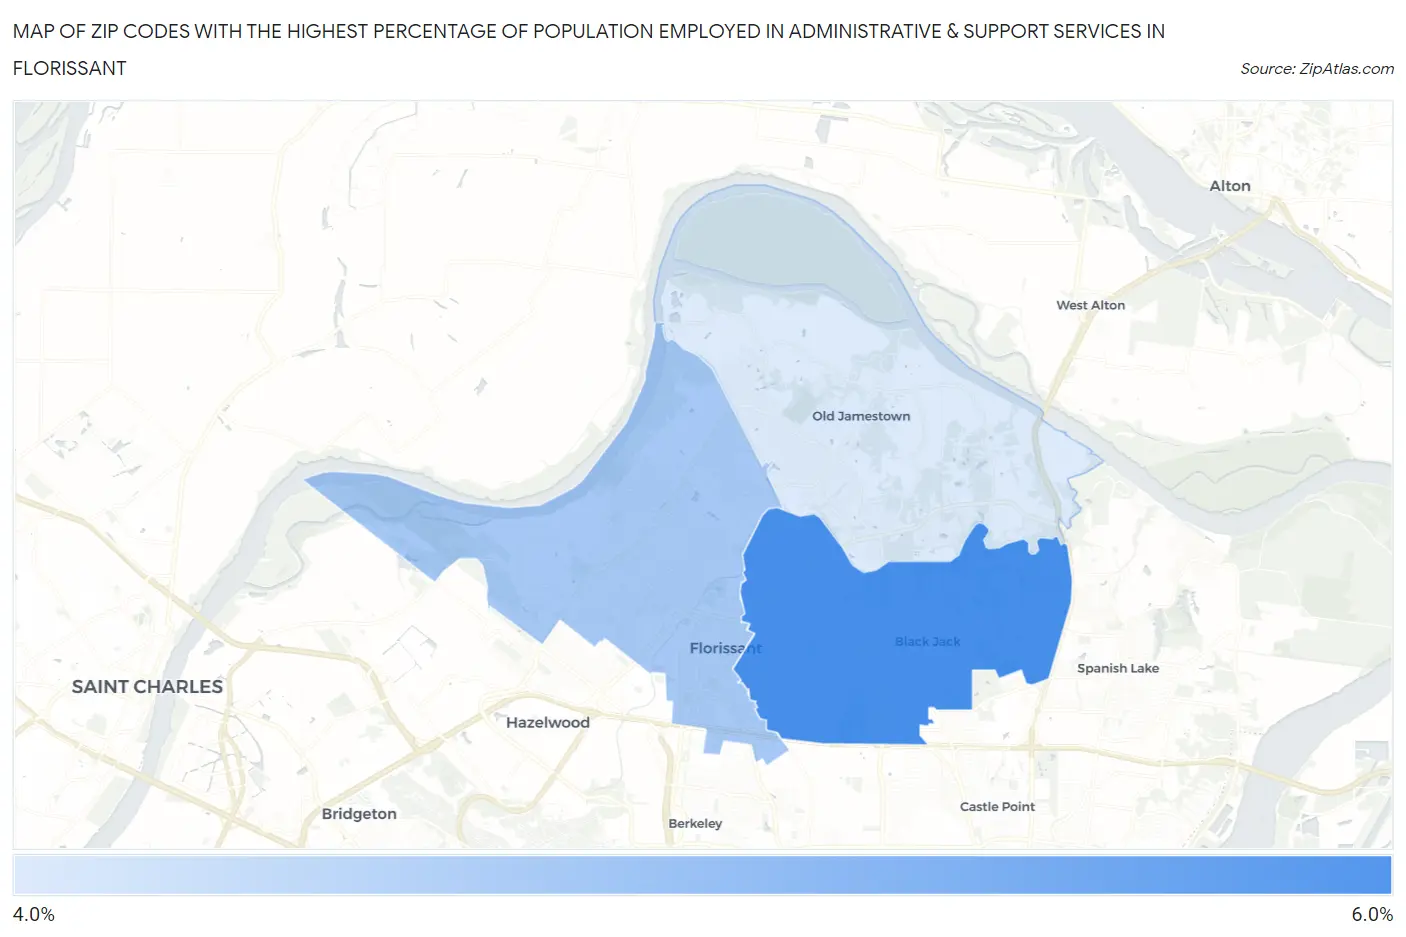
Map of Zip Codes with the Highest Percentage of Population Employed in Administrative & Support Services in Florissant
4.1%
5.6%
Zip Codes with the Highest Percentage of Population Employed in Administrative & Support Services in Florissant, MO
| Zip Code | % Employed | vs State | vs National | |
| 1. | 63033 | 5.6% | 3.6%(+2.06)#158 | 4.1%(+1.49)#5,485 |
| 2. | 63031 | 4.7% | 3.6%(+1.10)#207 | 4.1%(+0.532)#8,091 |
| 3. | 63034 | 4.1% | 3.6%(+0.524)#256 | 4.1%(-0.042)#10,208 |
1
Common Questions
What are the Top Zip Codes with the Highest Percentage of Population Employed in Administrative & Support Services in Florissant, MO?
Top Zip Codes with the Highest Percentage of Population Employed in Administrative & Support Services in Florissant, MO are:
What zip code has the Highest Percentage of Population Employed in Administrative & Support Services in Florissant, MO?
63033 has the Highest Percentage of Population Employed in Administrative & Support Services in Florissant, MO with 5.6%.
What is the Percentage of Population Employed in Administrative & Support Services in Florissant, MO?
Percentage of Population Employed in Administrative & Support Services in Florissant is 4.6%.
What is the Percentage of Population Employed in Administrative & Support Services in Missouri?
Percentage of Population Employed in Administrative & Support Services in Missouri is 3.6%.
What is the Percentage of Population Employed in Administrative & Support Services in the United States?
Percentage of Population Employed in Administrative & Support Services in the United States is 4.1%.