Zip Codes with the Highest Percentage of Population Employed in Arts, Media & Entertainment in Florissant, MO
RELATED REPORTS & OPTIONS
Arts, Media & Entertainment
Florissant
Compare Zip Codes
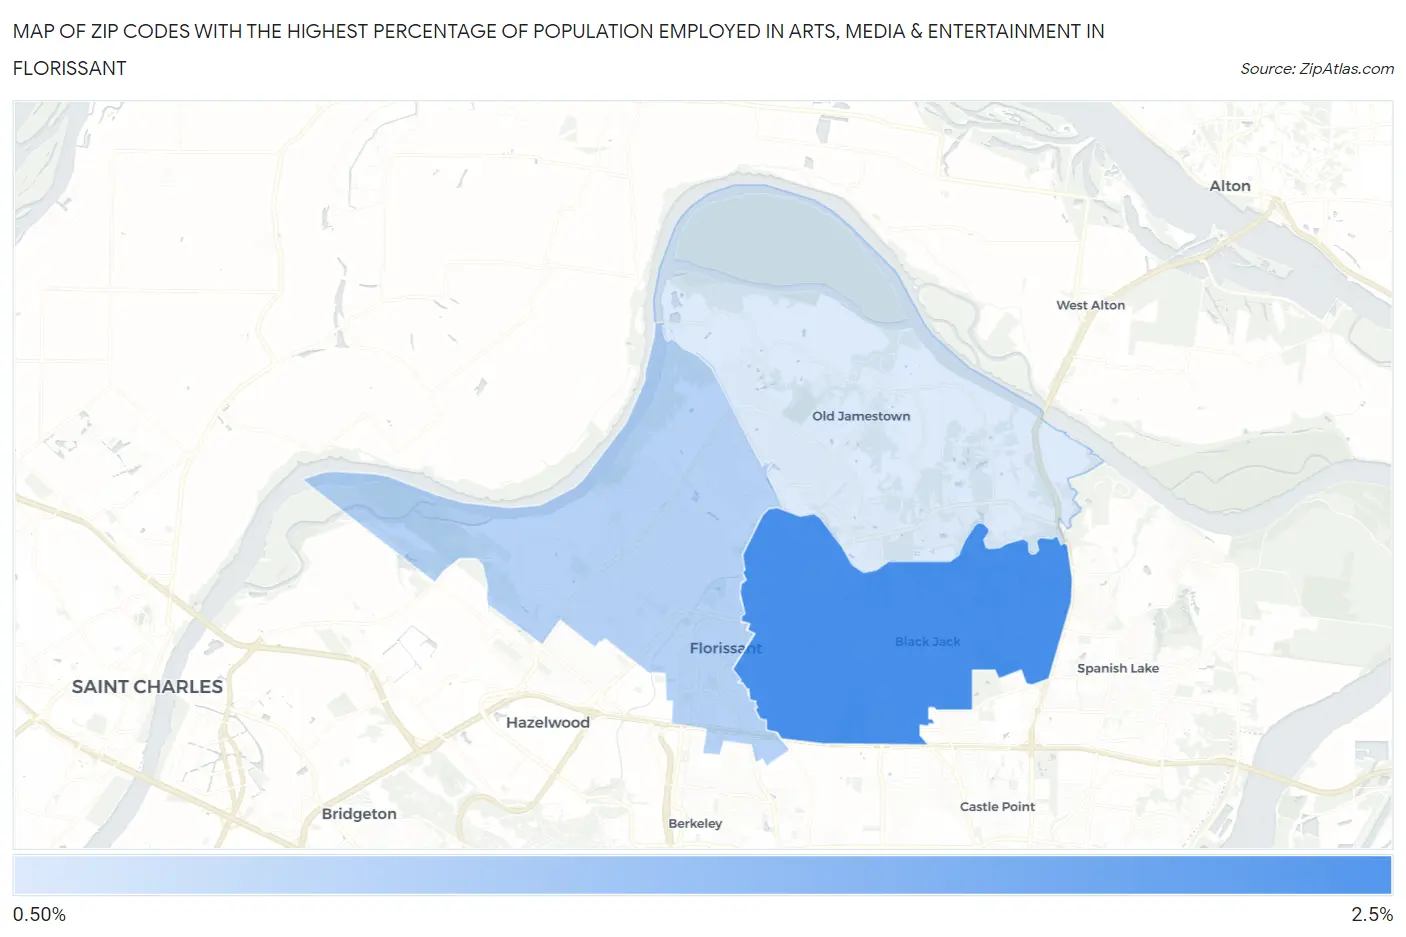
Map of Zip Codes with the Highest Percentage of Population Employed in Arts, Media & Entertainment in Florissant
1.0%
2.0%
Zip Codes with the Highest Percentage of Population Employed in Arts, Media & Entertainment in Florissant, MO
| Zip Code | % Employed | vs State | vs National | |
| 1. | 63033 | 2.0% | 1.7%(+0.355)#158 | 2.1%(-0.049)#7,750 |
| 2. | 63031 | 1.3% | 1.7%(-0.359)#274 | 2.1%(-0.764)#12,475 |
| 3. | 63034 | 1.0% | 1.7%(-0.608)#316 | 2.1%(-1.01)#14,416 |
1
Common Questions
What are the Top Zip Codes with the Highest Percentage of Population Employed in Arts, Media & Entertainment in Florissant, MO?
Top Zip Codes with the Highest Percentage of Population Employed in Arts, Media & Entertainment in Florissant, MO are:
What zip code has the Highest Percentage of Population Employed in Arts, Media & Entertainment in Florissant, MO?
63033 has the Highest Percentage of Population Employed in Arts, Media & Entertainment in Florissant, MO with 2.0%.
What is the Percentage of Population Employed in Arts, Media & Entertainment in Florissant, MO?
Percentage of Population Employed in Arts, Media & Entertainment in Florissant is 1.4%.
What is the Percentage of Population Employed in Arts, Media & Entertainment in Missouri?
Percentage of Population Employed in Arts, Media & Entertainment in Missouri is 1.7%.
What is the Percentage of Population Employed in Arts, Media & Entertainment in the United States?
Percentage of Population Employed in Arts, Media & Entertainment in the United States is 2.1%.