Zip Codes with the Highest Percentage of Households Without a Vehicle in Florissant, MO
RELATED REPORTS & OPTIONS
Households without a Cars
Florissant
Compare Zip Codes
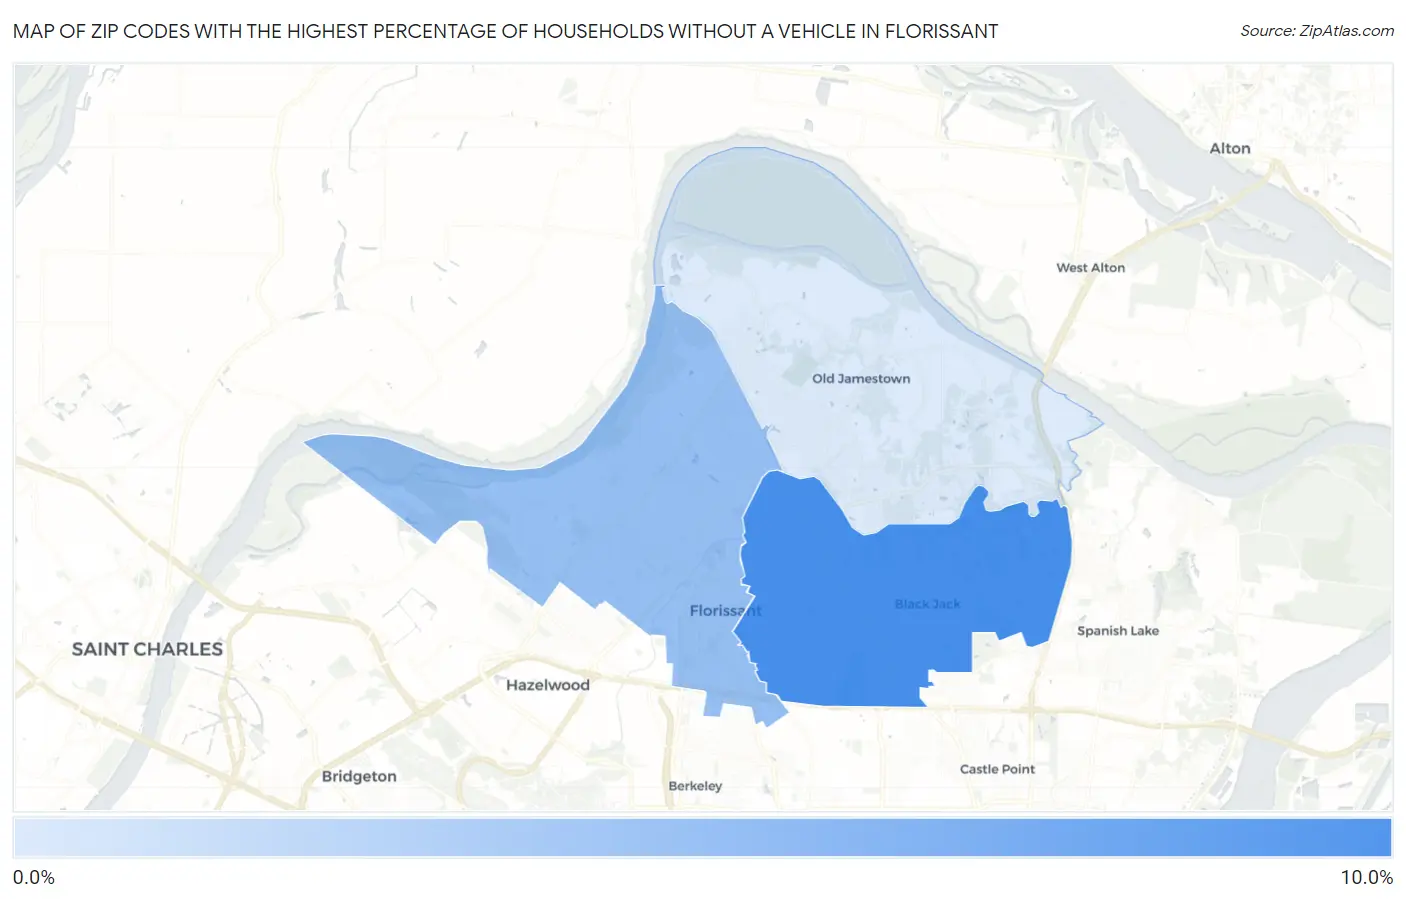
Map of Zip Codes with the Highest Percentage of Households Without a Vehicle in Florissant
1.8%
9.1%
Zip Codes with the Highest Percentage of Households Without a Vehicle in Florissant, MO
| Zip Code | Housholds Without a Car | vs State | vs National | |
| 1. | 63033 | 9.1% | 6.6%(+2.50)#148 | 8.3%(+0.800)#5,617 |
| 2. | 63031 | 5.2% | 6.6%(-1.40)#392 | 8.3%(-3.10)#12,315 |
| 3. | 63034 | 1.8% | 6.6%(-4.80)#738 | 8.3%(-6.50)#23,145 |
1
Common Questions
What are the Top Zip Codes with the Highest Percentage of Households Without a Vehicle in Florissant, MO?
Top Zip Codes with the Highest Percentage of Households Without a Vehicle in Florissant, MO are:
What zip code has the Highest Percentage of Households Without a Vehicle in Florissant, MO?
63033 has the Highest Percentage of Households Without a Vehicle in Florissant, MO with 9.1%.
What is the Percentage of Households Without a Vehicle in Florissant, MO?
Percentage of Households Without a Vehicle in Florissant is 8.1%.
What is the Percentage of Households Without a Vehicle in Missouri?
Percentage of Households Without a Vehicle in Missouri is 6.6%.
What is the Percentage of Households Without a Vehicle in the United States?
Percentage of Households Without a Vehicle in the United States is 8.3%.