Zip Codes with the Highest Percentage of Population with a Degree in Computers and Mathematics in Florissant, MO
RELATED REPORTS & OPTIONS
Computers and Mathematics
Florissant
Compare Zip Codes
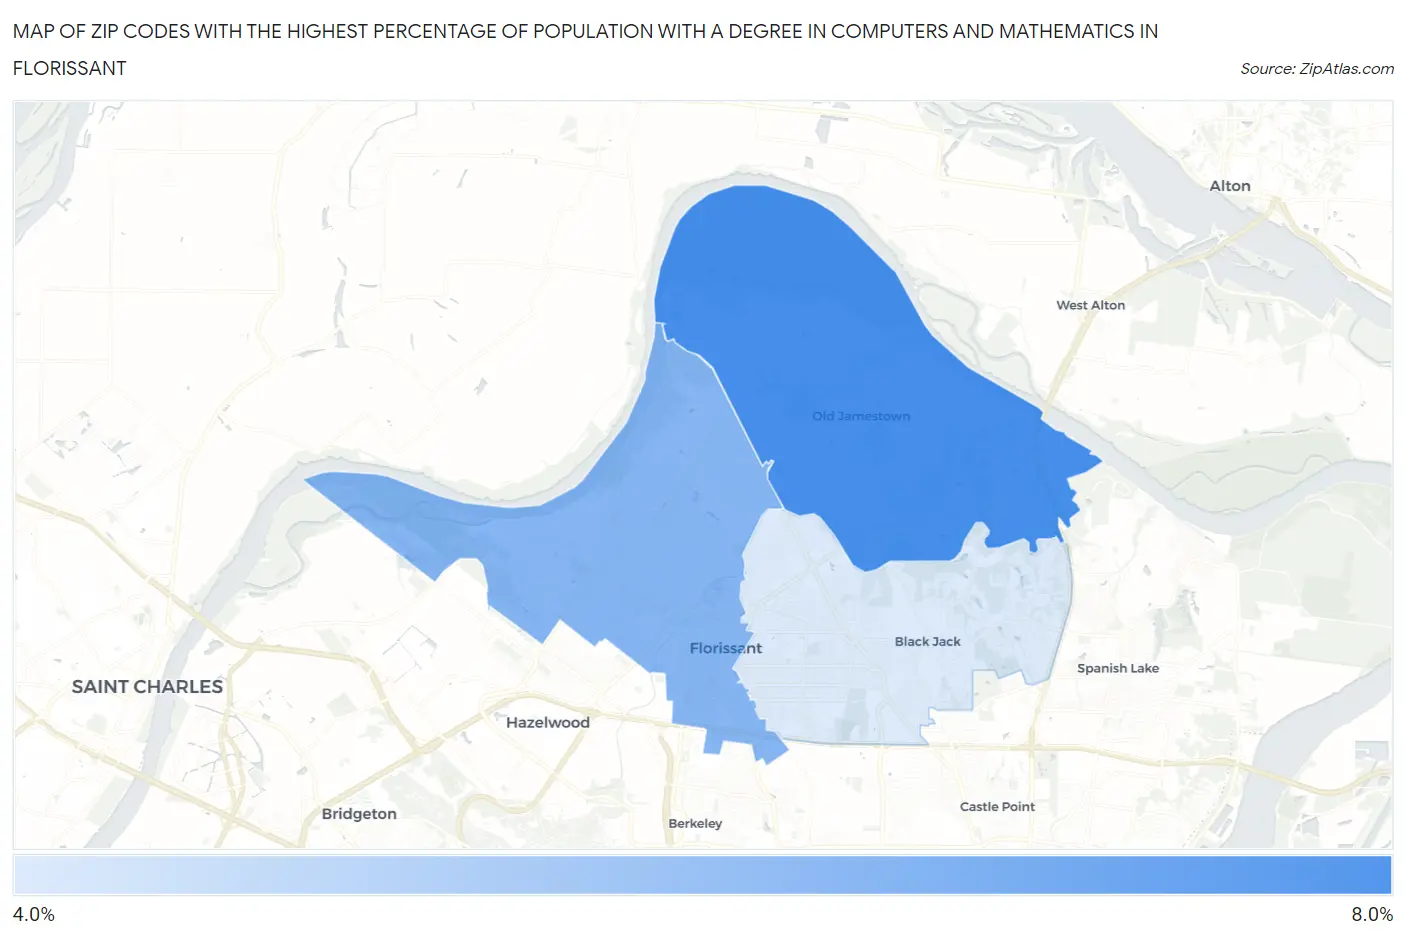
Map of Zip Codes with the Highest Percentage of Population with a Degree in Computers and Mathematics in Florissant
4.2%
7.9%
Zip Codes with the Highest Percentage of Population with a Degree in Computers and Mathematics in Florissant, MO
| Zip Code | % Graduates | vs State | vs National | |
| 1. | 63034 | 7.9% | 4.4%(+3.47)#80 | 4.9%(+3.02)#2,965 |
| 2. | 63031 | 6.4% | 4.4%(+1.92)#123 | 4.9%(+1.48)#4,660 |
| 3. | 63033 | 4.2% | 4.4%(-0.212)#247 | 4.9%(-0.660)#9,729 |
1
Common Questions
What are the Top Zip Codes with the Highest Percentage of Population with a Degree in Computers and Mathematics in Florissant, MO?
Top Zip Codes with the Highest Percentage of Population with a Degree in Computers and Mathematics in Florissant, MO are:
What zip code has the Highest Percentage of Population with a Degree in Computers and Mathematics in Florissant, MO?
63034 has the Highest Percentage of Population with a Degree in Computers and Mathematics in Florissant, MO with 7.9%.
What is the Percentage of Population with a Degree in Computers and Mathematics in Florissant, MO?
Percentage of Population with a Degree in Computers and Mathematics in Florissant is 5.5%.
What is the Percentage of Population with a Degree in Computers and Mathematics in Missouri?
Percentage of Population with a Degree in Computers and Mathematics in Missouri is 4.4%.
What is the Percentage of Population with a Degree in Computers and Mathematics in the United States?
Percentage of Population with a Degree in Computers and Mathematics in the United States is 4.9%.