Zip Codes with the Highest Percentage of Population Employed in Architecture & Engineering in Florissant, MO
RELATED REPORTS & OPTIONS
Architecture & Engineering
Florissant
Compare Zip Codes
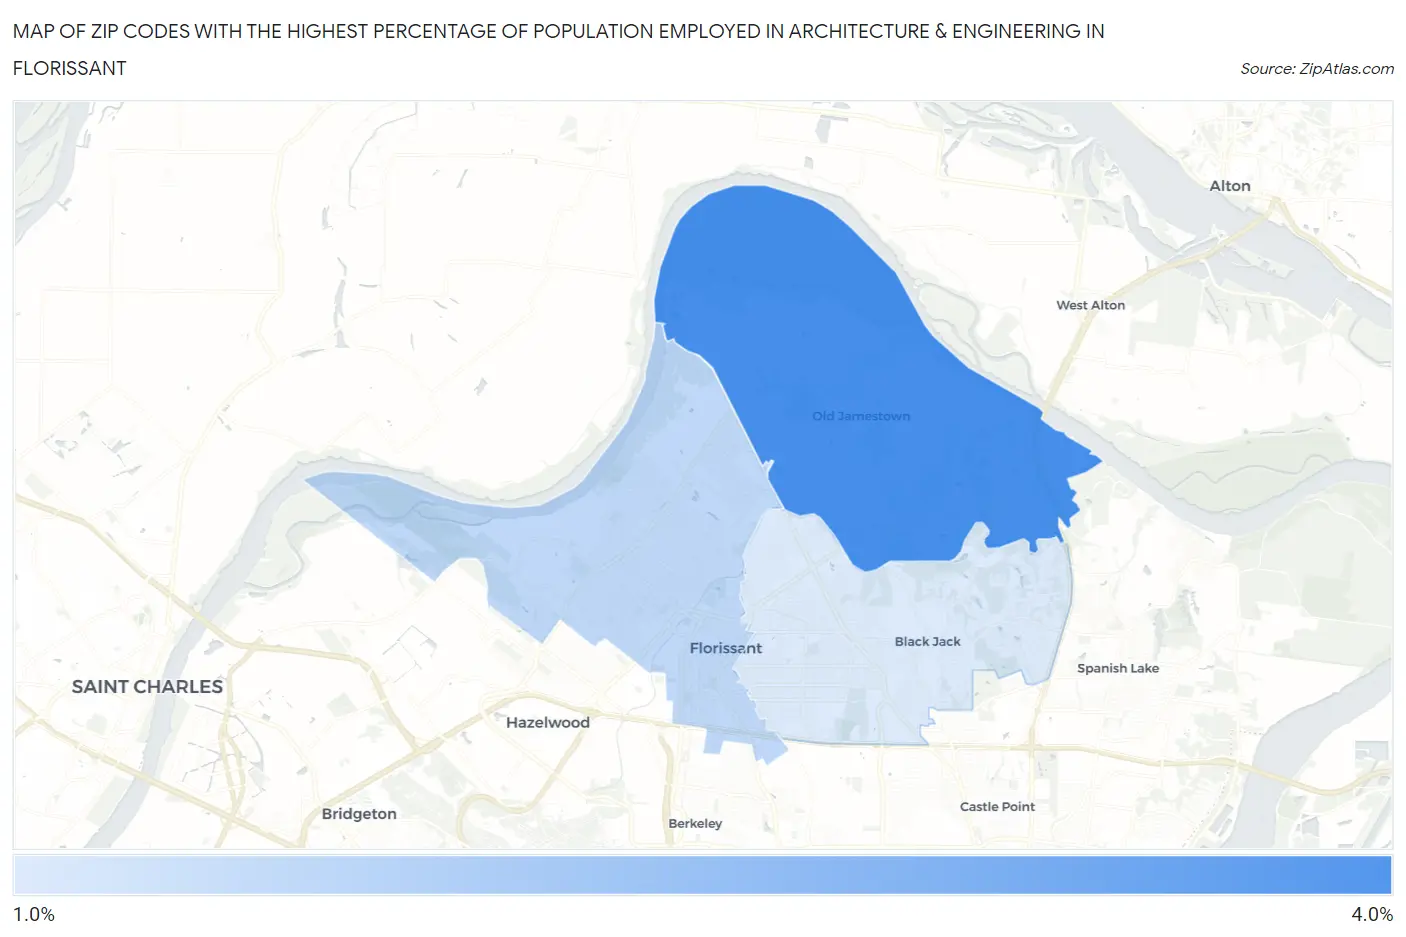
Map of Zip Codes with the Highest Percentage of Population Employed in Architecture & Engineering in Florissant
1.5%
3.1%
Zip Codes with the Highest Percentage of Population Employed in Architecture & Engineering in Florissant, MO
| Zip Code | % Employed | vs State | vs National | |
| 1. | 63034 | 3.1% | 1.7%(+1.37)#79 | 2.1%(+0.921)#4,810 |
| 2. | 63031 | 1.8% | 1.7%(+0.081)#213 | 2.1%(-0.364)#10,911 |
| 3. | 63033 | 1.5% | 1.7%(-0.245)#259 | 2.1%(-0.690)#13,169 |
1
Common Questions
What are the Top Zip Codes with the Highest Percentage of Population Employed in Architecture & Engineering in Florissant, MO?
Top Zip Codes with the Highest Percentage of Population Employed in Architecture & Engineering in Florissant, MO are:
What zip code has the Highest Percentage of Population Employed in Architecture & Engineering in Florissant, MO?
63034 has the Highest Percentage of Population Employed in Architecture & Engineering in Florissant, MO with 3.1%.
What is the Percentage of Population Employed in Architecture & Engineering in Florissant, MO?
Percentage of Population Employed in Architecture & Engineering in Florissant is 1.9%.
What is the Percentage of Population Employed in Architecture & Engineering in Missouri?
Percentage of Population Employed in Architecture & Engineering in Missouri is 1.7%.
What is the Percentage of Population Employed in Architecture & Engineering in the United States?
Percentage of Population Employed in Architecture & Engineering in the United States is 2.1%.