Zip Codes with the Highest Percentage of Population with a Degree in Science and Engineering in Florissant, MO
RELATED REPORTS & OPTIONS
Science and Engineering
Florissant
Compare Zip Codes
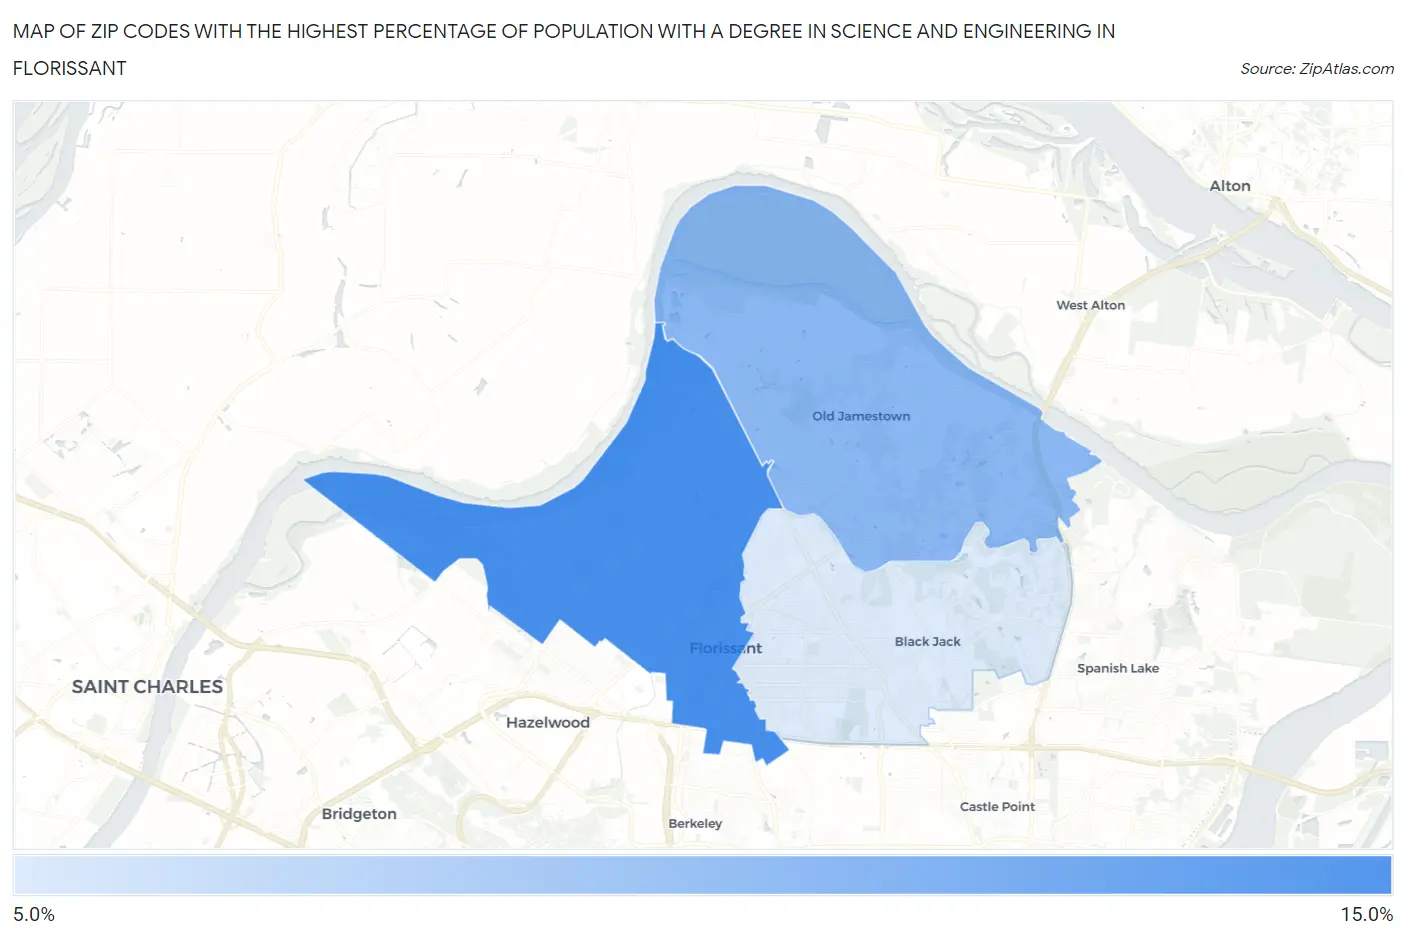
Map of Zip Codes with the Highest Percentage of Population with a Degree in Science and Engineering in Florissant
7.5%
12.2%
Zip Codes with the Highest Percentage of Population with a Degree in Science and Engineering in Florissant, MO
| Zip Code | % Graduates | vs State | vs National | |
| 1. | 63031 | 12.2% | 10.8%(+1.45)#349 | 9.8%(+2.45)#10,473 |
| 2. | 63034 | 10.1% | 10.8%(-0.700)#469 | 9.8%(+0.296)#14,858 |
| 3. | 63033 | 7.5% | 10.8%(-3.32)#630 | 9.8%(-2.32)#20,806 |
1
Common Questions
What are the Top Zip Codes with the Highest Percentage of Population with a Degree in Science and Engineering in Florissant, MO?
Top Zip Codes with the Highest Percentage of Population with a Degree in Science and Engineering in Florissant, MO are:
What zip code has the Highest Percentage of Population with a Degree in Science and Engineering in Florissant, MO?
63031 has the Highest Percentage of Population with a Degree in Science and Engineering in Florissant, MO with 12.2%.
What is the Percentage of Population with a Degree in Science and Engineering in Florissant, MO?
Percentage of Population with a Degree in Science and Engineering in Florissant is 9.6%.
What is the Percentage of Population with a Degree in Science and Engineering in Missouri?
Percentage of Population with a Degree in Science and Engineering in Missouri is 10.8%.
What is the Percentage of Population with a Degree in Science and Engineering in the United States?
Percentage of Population with a Degree in Science and Engineering in the United States is 9.8%.