Zip Codes with the Highest Percentage of Population Employed in Legal Services & Support in Midland, MI
RELATED REPORTS & OPTIONS
Legal Services & Support
Midland
Compare Zip Codes
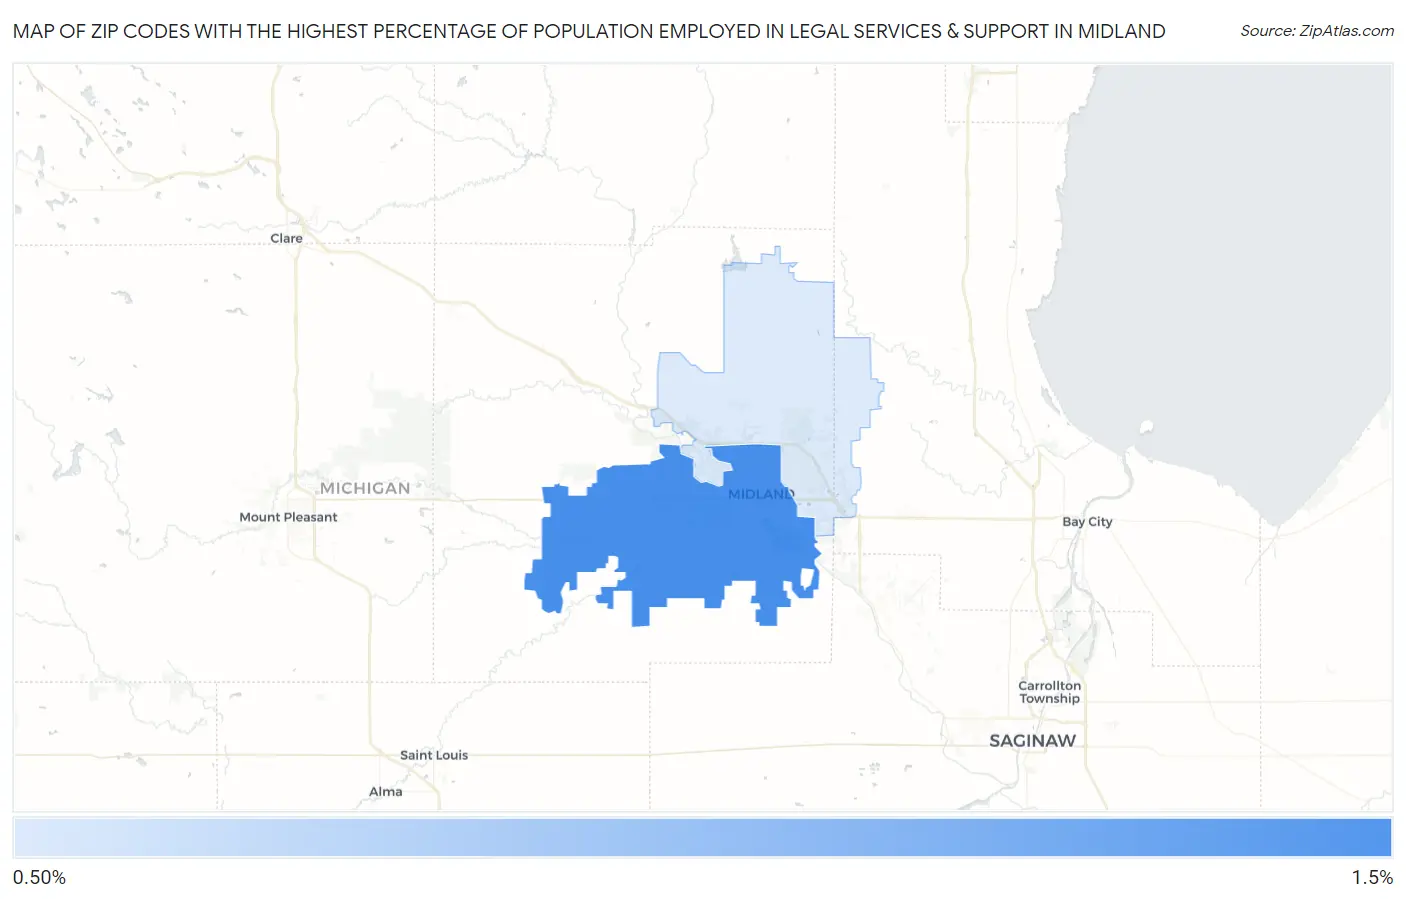
Map of Zip Codes with the Highest Percentage of Population Employed in Legal Services & Support in Midland
0.80%
1.3%
Zip Codes with the Highest Percentage of Population Employed in Legal Services & Support in Midland, MI
| Zip Code | % Employed | vs State | vs National | |
| 1. | 48640 | 1.3% | 0.89%(+0.378)#137 | 1.2%(+0.080)#6,136 |
| 2. | 48642 | 0.80% | 0.89%(-0.083)#254 | 1.2%(-0.381)#9,411 |
1
Common Questions
What are the Top Zip Codes with the Highest Percentage of Population Employed in Legal Services & Support in Midland, MI?
Top Zip Codes with the Highest Percentage of Population Employed in Legal Services & Support in Midland, MI are:
What zip code has the Highest Percentage of Population Employed in Legal Services & Support in Midland, MI?
48640 has the Highest Percentage of Population Employed in Legal Services & Support in Midland, MI with 1.3%.
What is the Percentage of Population Employed in Legal Services & Support in Midland, MI?
Percentage of Population Employed in Legal Services & Support in Midland is 0.98%.
What is the Percentage of Population Employed in Legal Services & Support in Michigan?
Percentage of Population Employed in Legal Services & Support in Michigan is 0.89%.
What is the Percentage of Population Employed in Legal Services & Support in the United States?
Percentage of Population Employed in Legal Services & Support in the United States is 1.2%.