Zip Codes with the Highest Percentage of Population Employed in Legal Services & Support in Holland, MI
RELATED REPORTS & OPTIONS
Legal Services & Support
Holland
Compare Zip Codes
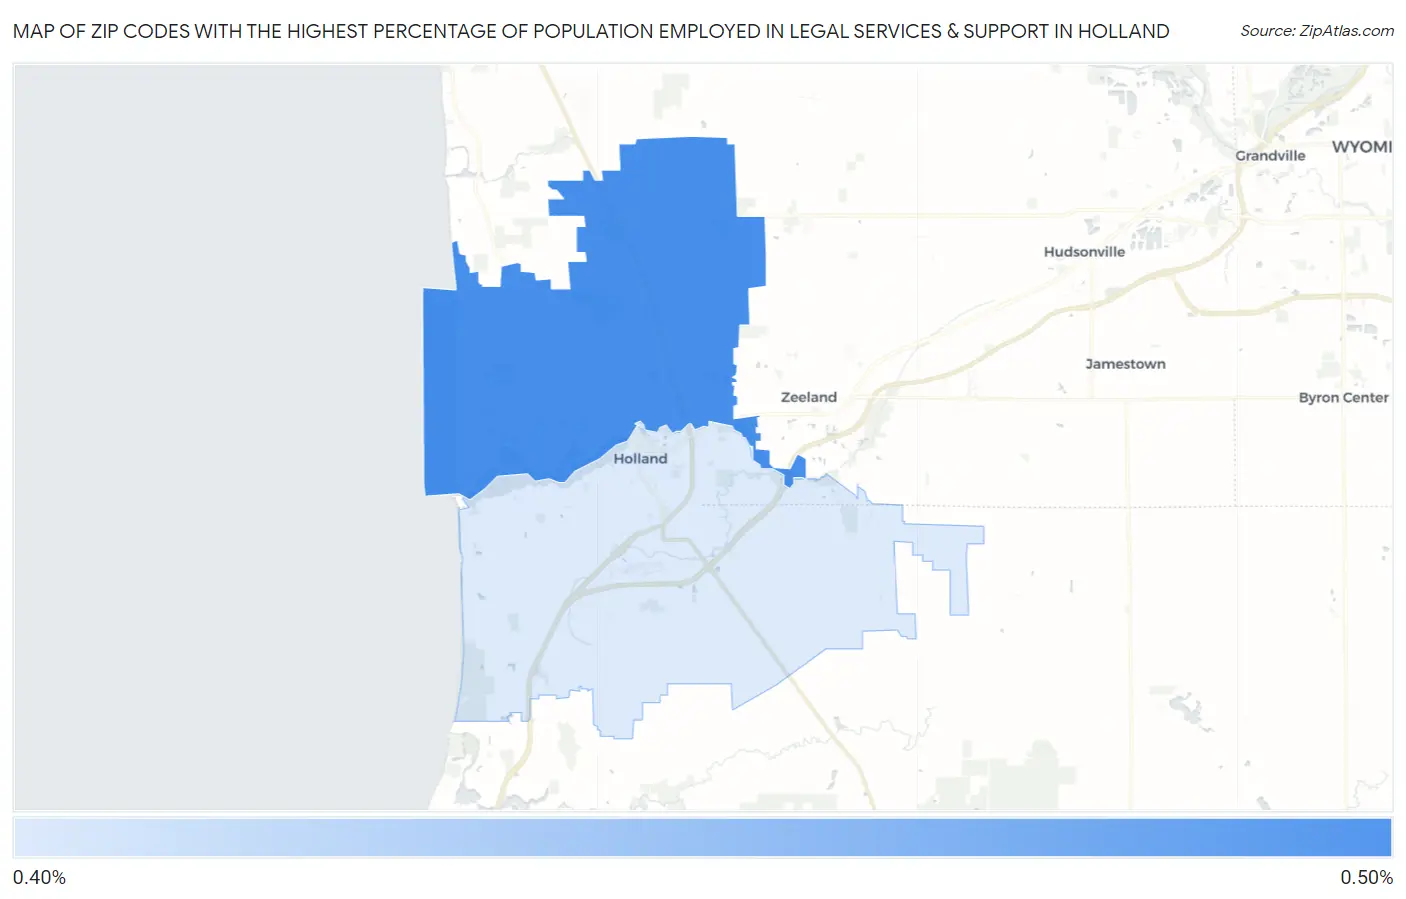
Map of Zip Codes with the Highest Percentage of Population Employed in Legal Services & Support in Holland
0.44%
0.47%
Zip Codes with the Highest Percentage of Population Employed in Legal Services & Support in Holland, MI
| Zip Code | % Employed | vs State | vs National | |
| 1. | 49424 | 0.47% | 0.89%(-0.414)#394 | 1.2%(-0.712)#12,990 |
| 2. | 49423 | 0.44% | 0.89%(-0.448)#411 | 1.2%(-0.746)#13,380 |
1
Common Questions
What are the Top Zip Codes with the Highest Percentage of Population Employed in Legal Services & Support in Holland, MI?
Top Zip Codes with the Highest Percentage of Population Employed in Legal Services & Support in Holland, MI are:
What zip code has the Highest Percentage of Population Employed in Legal Services & Support in Holland, MI?
49424 has the Highest Percentage of Population Employed in Legal Services & Support in Holland, MI with 0.47%.
What is the Percentage of Population Employed in Legal Services & Support in Holland, MI?
Percentage of Population Employed in Legal Services & Support in Holland is 0.41%.
What is the Percentage of Population Employed in Legal Services & Support in Michigan?
Percentage of Population Employed in Legal Services & Support in Michigan is 0.89%.
What is the Percentage of Population Employed in Legal Services & Support in the United States?
Percentage of Population Employed in Legal Services & Support in the United States is 1.2%.