Zip Codes with the Most Immigrants from Latin America in East Lansing, MI
RELATED REPORTS & OPTIONS
Latin America
East Lansing
Compare Zip Codes
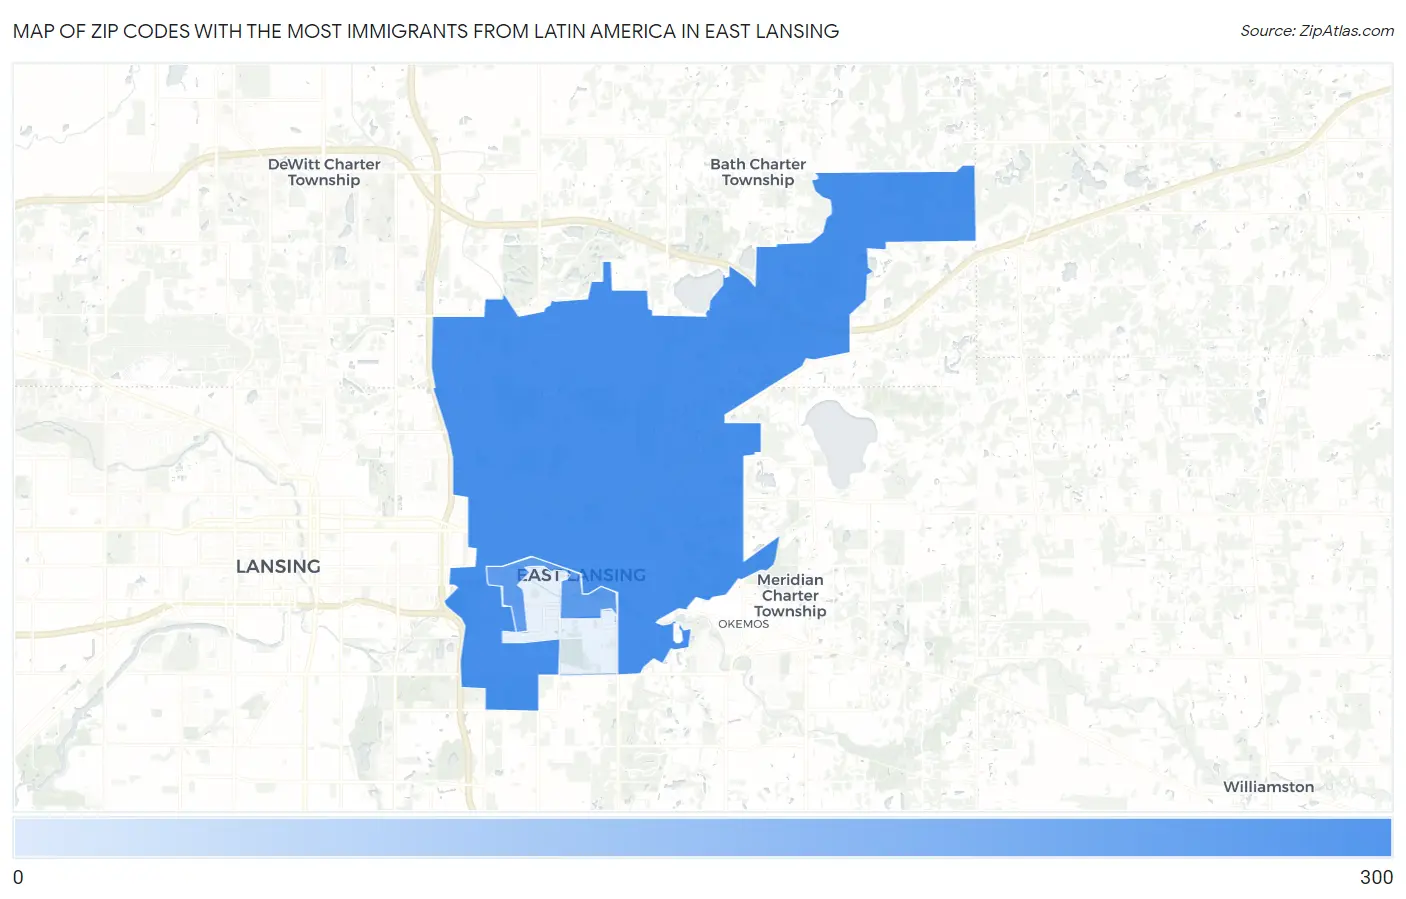
Map of Zip Codes with the Most Immigrants from Latin America in East Lansing
122
286
Zip Codes with the Most Immigrants from Latin America in East Lansing, MI
| Zip Code | Latin America | vs State | vs National | |
| 1. | 48823 | 286 | 129,602(0.22%)#116 | 22,649,518(0.00%)#7,858 |
| 2. | 48825 | 122 | 129,602(0.09%)#237 | 22,649,518(0.00%)#10,587 |
1
Common Questions
What are the Top Zip Codes with the Most Immigrants from Latin America in East Lansing, MI?
Top Zip Codes with the Most Immigrants from Latin America in East Lansing, MI are:
What zip code has the Most Immigrants from Latin America in East Lansing, MI?
48823 has the Most Immigrants from Latin America in East Lansing, MI with 286.
What is the Total Immigrants from Latin America in East Lansing, MI?
Total Immigrants from Latin America in East Lansing is 350.
What is the Total Immigrants from Latin America in Michigan?
Total Immigrants from Latin America in Michigan is 129,602.
What is the Total Immigrants from Latin America in the United States?
Total Immigrants from Latin America in the United States is 22,649,518.