Zip Codes with the Highest Percentage of Population with a Degree in Visual and Performing Arts in Lenexa, KS
RELATED REPORTS & OPTIONS
Visual and Performing Arts
Lenexa
Compare Zip Codes
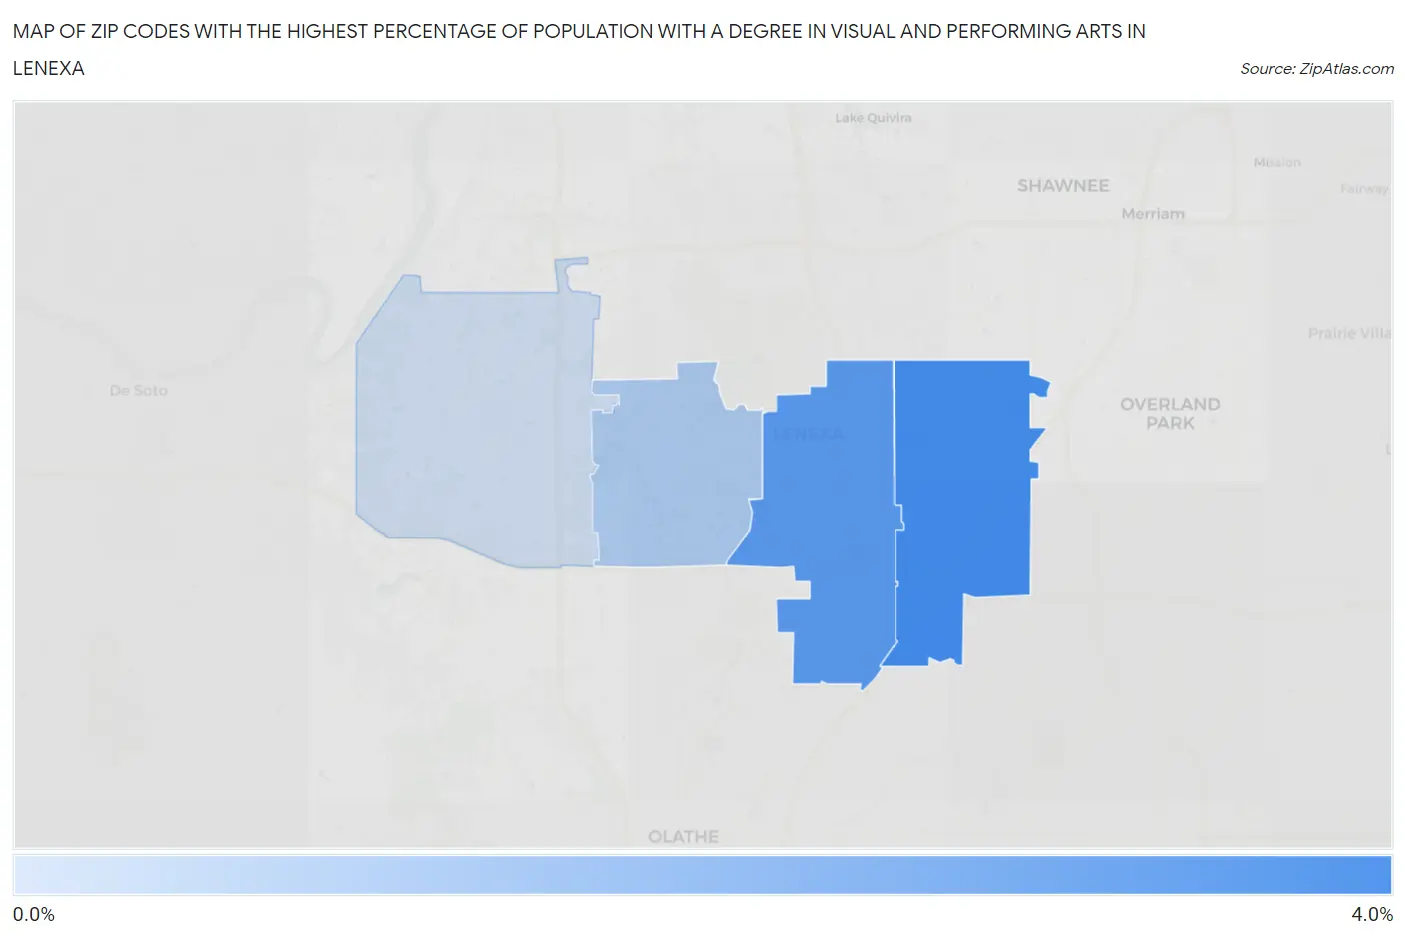
Map of Zip Codes with the Highest Percentage of Population with a Degree in Visual and Performing Arts in Lenexa
0.56%
3.7%
Zip Codes with the Highest Percentage of Population with a Degree in Visual and Performing Arts in Lenexa, KS
| Zip Code | % Graduates | vs State | vs National | |
| 1. | 66215 | 3.7% | 3.4%(+0.320)#144 | 4.3%(-0.519)#10,045 |
| 2. | 66219 | 3.2% | 3.4%(-0.243)#169 | 4.3%(-1.08)#12,084 |
| 3. | 66220 | 1.3% | 3.4%(-2.11)#303 | 4.3%(-2.94)#18,740 |
| 4. | 66227 | 0.56% | 3.4%(-2.85)#340 | 4.3%(-3.69)#20,646 |
1
Common Questions
What are the Top 3 Zip Codes with the Highest Percentage of Population with a Degree in Visual and Performing Arts in Lenexa, KS?
Top 3 Zip Codes with the Highest Percentage of Population with a Degree in Visual and Performing Arts in Lenexa, KS are:
What zip code has the Highest Percentage of Population with a Degree in Visual and Performing Arts in Lenexa, KS?
66215 has the Highest Percentage of Population with a Degree in Visual and Performing Arts in Lenexa, KS with 3.7%.
What is the Percentage of Population with a Degree in Visual and Performing Arts in Lenexa, KS?
Percentage of Population with a Degree in Visual and Performing Arts in Lenexa is 3.0%.
What is the Percentage of Population with a Degree in Visual and Performing Arts in Kansas?
Percentage of Population with a Degree in Visual and Performing Arts in Kansas is 3.4%.
What is the Percentage of Population with a Degree in Visual and Performing Arts in the United States?
Percentage of Population with a Degree in Visual and Performing Arts in the United States is 4.3%.