Zip Codes with the Highest Percentage of Population with a Degree in Psychology in Lenexa, KS
RELATED REPORTS & OPTIONS
Psychology
Lenexa
Compare Zip Codes
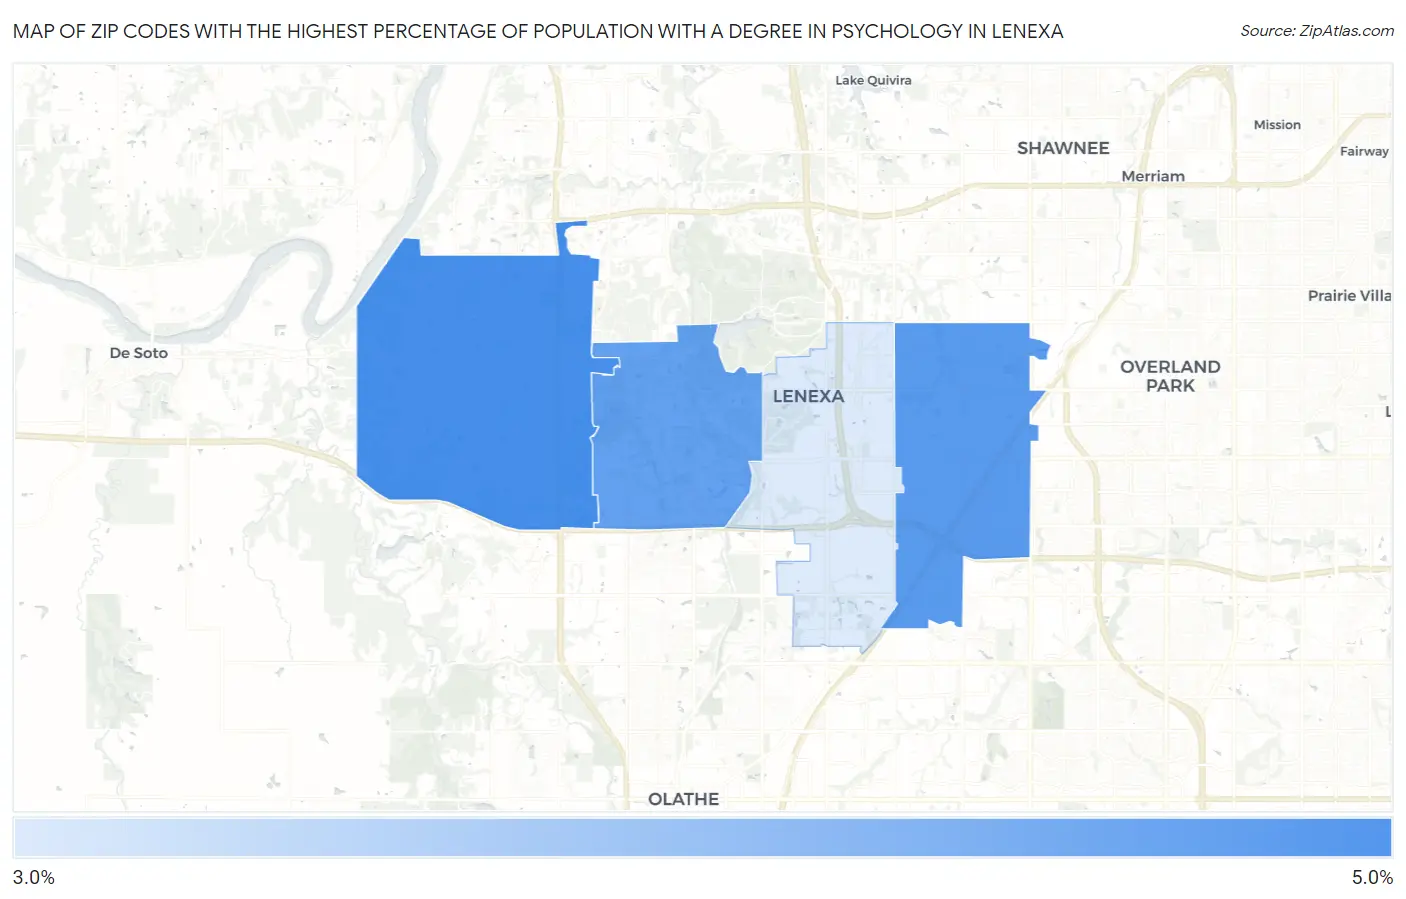
Map of Zip Codes with the Highest Percentage of Population with a Degree in Psychology in Lenexa
3.2%
4.5%
Zip Codes with the Highest Percentage of Population with a Degree in Psychology in Lenexa, KS
| Zip Code | % Graduates | vs State | vs National | |
| 1. | 66227 | 4.5% | 4.1%(+0.380)#176 | 5.1%(-0.578)#13,211 |
| 2. | 66215 | 4.3% | 4.1%(+0.250)#184 | 5.1%(-0.708)#13,701 |
| 3. | 66220 | 4.2% | 4.1%(+0.151)#192 | 5.1%(-0.807)#14,059 |
| 4. | 66219 | 3.2% | 4.1%(-0.868)#259 | 5.1%(-1.83)#17,559 |
1
Common Questions
What are the Top 3 Zip Codes with the Highest Percentage of Population with a Degree in Psychology in Lenexa, KS?
Top 3 Zip Codes with the Highest Percentage of Population with a Degree in Psychology in Lenexa, KS are:
What zip code has the Highest Percentage of Population with a Degree in Psychology in Lenexa, KS?
66227 has the Highest Percentage of Population with a Degree in Psychology in Lenexa, KS with 4.5%.
What is the Percentage of Population with a Degree in Psychology in Lenexa, KS?
Percentage of Population with a Degree in Psychology in Lenexa is 4.0%.
What is the Percentage of Population with a Degree in Psychology in Kansas?
Percentage of Population with a Degree in Psychology in Kansas is 4.1%.
What is the Percentage of Population with a Degree in Psychology in the United States?
Percentage of Population with a Degree in Psychology in the United States is 5.1%.