Zip Codes with the Highest Percentage of Immigrants from Northern Europe in Lenexa, KS
RELATED REPORTS & OPTIONS
Northern Europe
Lenexa
Compare Zip Codes
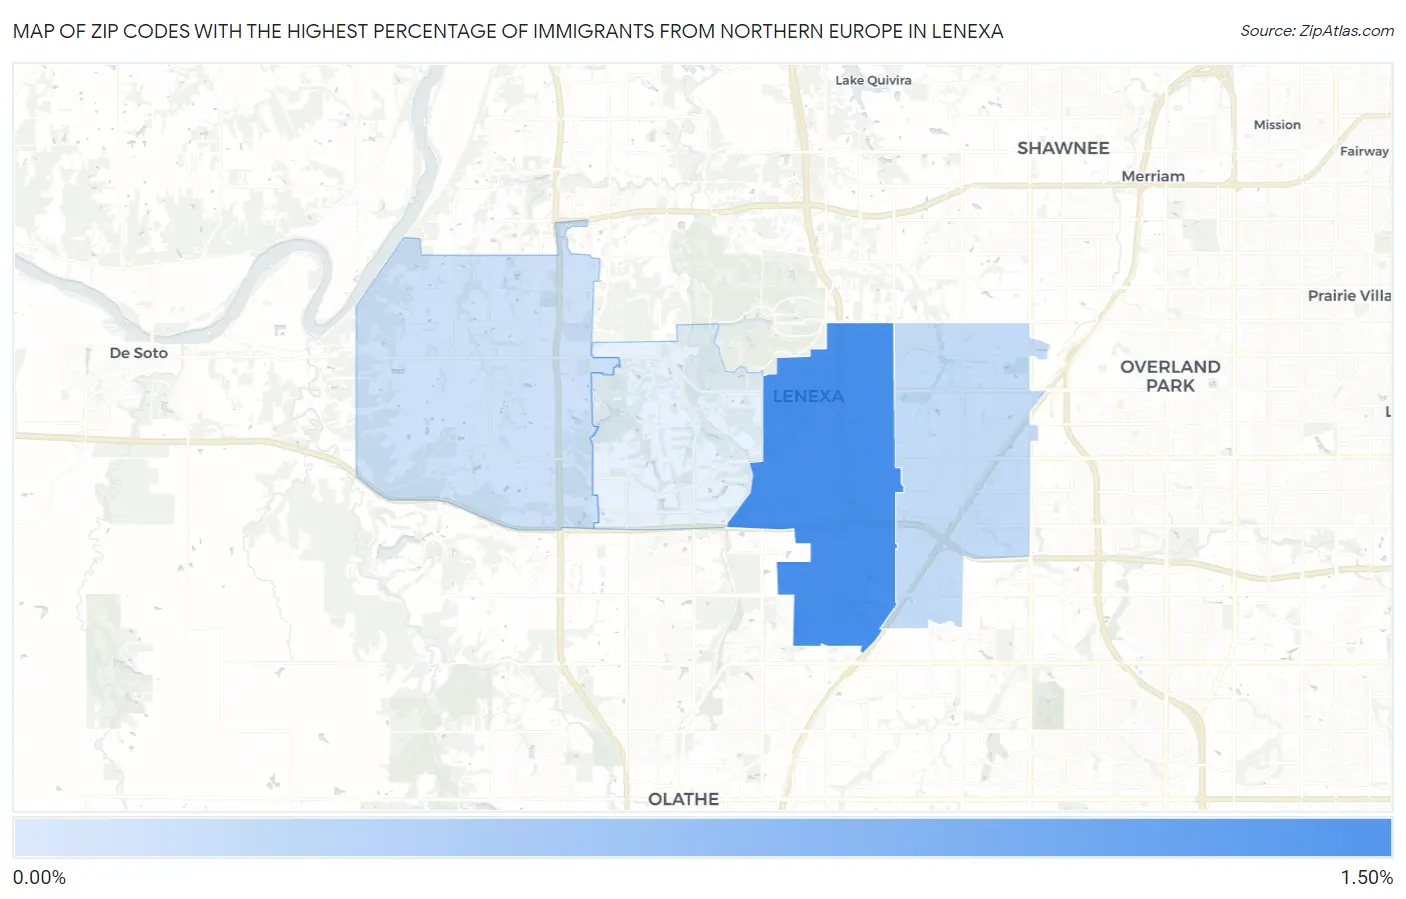
Map of Zip Codes with the Highest Percentage of Immigrants from Northern Europe in Lenexa
0.11%
1.15%
Zip Codes with the Highest Percentage of Immigrants from Northern Europe in Lenexa, KS
| Zip Code | Northern Europe | vs State | vs National | |
| 1. | 66219 | 1.15% | 0.12%(+1.03)#8 | 0.29%(+0.863)#1,167 |
| 2. | 66215 | 0.19% | 0.12%(+0.069)#67 | 0.29%(-0.093)#7,980 |
| 3. | 66227 | 0.11% | 0.12%(-0.009)#90 | 0.29%(-0.171)#10,022 |
1
Common Questions
What are the Top 3 Zip Codes with the Highest Percentage of Immigrants from Northern Europe in Lenexa, KS?
Top 3 Zip Codes with the Highest Percentage of Immigrants from Northern Europe in Lenexa, KS are:
What zip code has the Highest Percentage of Immigrants from Northern Europe in Lenexa, KS?
66219 has the Highest Percentage of Immigrants from Northern Europe in Lenexa, KS with 1.15%.
What is the Percentage of Immigrants from Northern Europe in Lenexa, KS?
Percentage of Immigrants from Northern Europe in Lenexa is 0.39%.
What is the Percentage of Immigrants from Northern Europe in Kansas?
Percentage of Immigrants from Northern Europe in Kansas is 0.12%.
What is the Percentage of Immigrants from Northern Europe in the United States?
Percentage of Immigrants from Northern Europe in the United States is 0.29%.