Zip Codes with the Highest Percentage of Eastern European Population in Lenexa, KS
RELATED REPORTS & OPTIONS
Eastern European
Lenexa
Compare Zip Codes
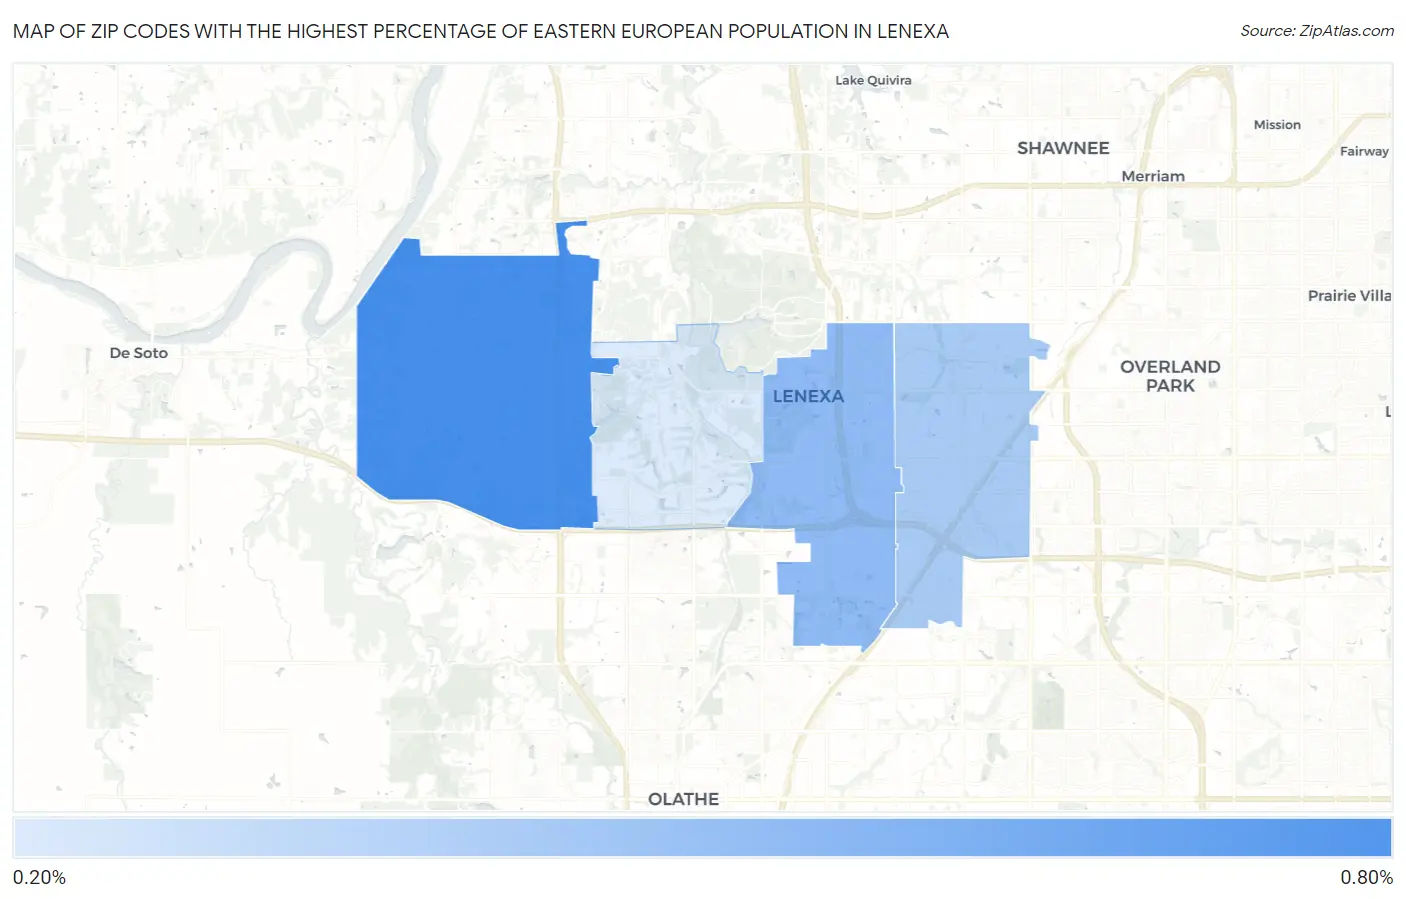
Map of Zip Codes with the Highest Percentage of Eastern European Population in Lenexa
0.23%
0.69%
Zip Codes with the Highest Percentage of Eastern European Population in Lenexa, KS
| Zip Code | Eastern European | vs State | vs National | |
| 1. | 66227 | 0.69% | 0.17%(+0.512)#22 | 0.30%(+0.382)#2,906 |
| 2. | 66219 | 0.47% | 0.17%(+0.296)#40 | 0.30%(+0.166)#4,261 |
| 3. | 66215 | 0.40% | 0.17%(+0.223)#50 | 0.30%(+0.092)#5,033 |
| 4. | 66220 | 0.23% | 0.17%(+0.060)#86 | 0.30%(-0.070)#7,515 |
1
Common Questions
What are the Top 3 Zip Codes with the Highest Percentage of Eastern European Population in Lenexa, KS?
Top 3 Zip Codes with the Highest Percentage of Eastern European Population in Lenexa, KS are:
What zip code has the Highest Percentage of Eastern European Population in Lenexa, KS?
66227 has the Highest Percentage of Eastern European Population in Lenexa, KS with 0.69%.
What is the Percentage of Eastern European Population in Lenexa, KS?
Percentage of Eastern European Population in Lenexa is 0.42%.
What is the Percentage of Eastern European Population in Kansas?
Percentage of Eastern European Population in Kansas is 0.17%.
What is the Percentage of Eastern European Population in the United States?
Percentage of Eastern European Population in the United States is 0.30%.