Zip Codes with the Highest Percentage of Population Employed in Finance & Insurance in Lenexa, KS
RELATED REPORTS & OPTIONS
Finance & Insurance
Lenexa
Compare Zip Codes
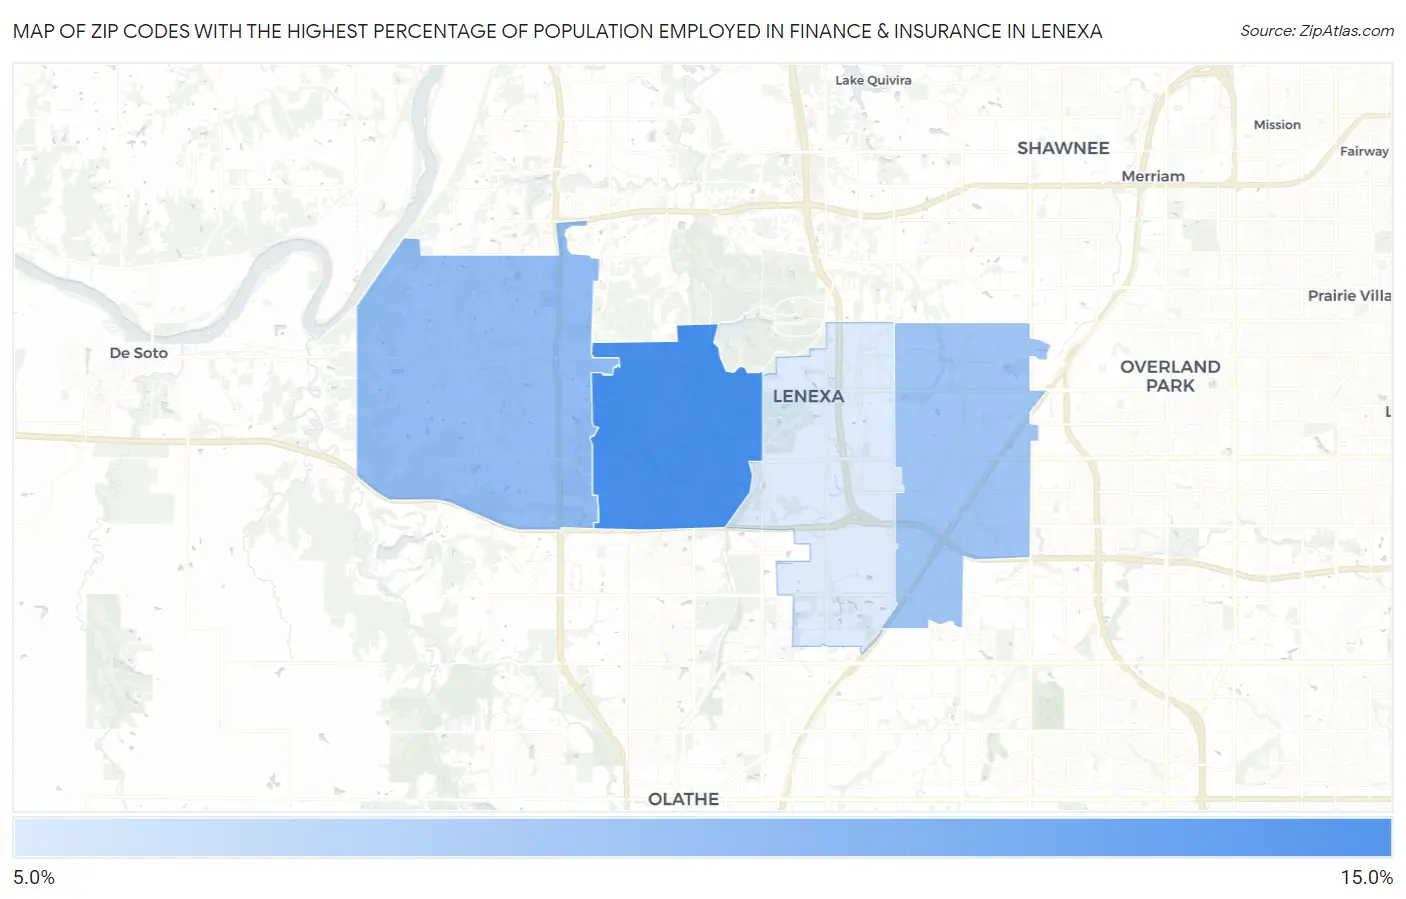
Map of Zip Codes with the Highest Percentage of Population Employed in Finance & Insurance in Lenexa
9.7%
13.5%
Zip Codes with the Highest Percentage of Population Employed in Finance & Insurance in Lenexa, KS
| Zip Code | % Employed | vs State | vs National | |
| 1. | 66220 | 13.5% | 5.1%(+8.40)#12 | 4.8%(+8.73)#741 |
| 2. | 66227 | 11.6% | 5.1%(+6.53)#20 | 4.8%(+6.86)#1,107 |
| 3. | 66215 | 11.3% | 5.1%(+6.17)#23 | 4.8%(+6.50)#1,215 |
| 4. | 66219 | 9.7% | 5.1%(+4.63)#46 | 4.8%(+4.96)#1,859 |
1
Common Questions
What are the Top 3 Zip Codes with the Highest Percentage of Population Employed in Finance & Insurance in Lenexa, KS?
Top 3 Zip Codes with the Highest Percentage of Population Employed in Finance & Insurance in Lenexa, KS are:
What zip code has the Highest Percentage of Population Employed in Finance & Insurance in Lenexa, KS?
66220 has the Highest Percentage of Population Employed in Finance & Insurance in Lenexa, KS with 13.5%.
What is the Percentage of Population Employed in Finance & Insurance in Lenexa, KS?
Percentage of Population Employed in Finance & Insurance in Lenexa is 10.7%.
What is the Percentage of Population Employed in Finance & Insurance in Kansas?
Percentage of Population Employed in Finance & Insurance in Kansas is 5.1%.
What is the Percentage of Population Employed in Finance & Insurance in the United States?
Percentage of Population Employed in Finance & Insurance in the United States is 4.8%.