Zip Codes with the Highest Percentage of Households with Income Above $200,000 in Lenexa, KS
RELATED REPORTS & OPTIONS
Household Income | $200k+
Lenexa
Compare Zip Codes
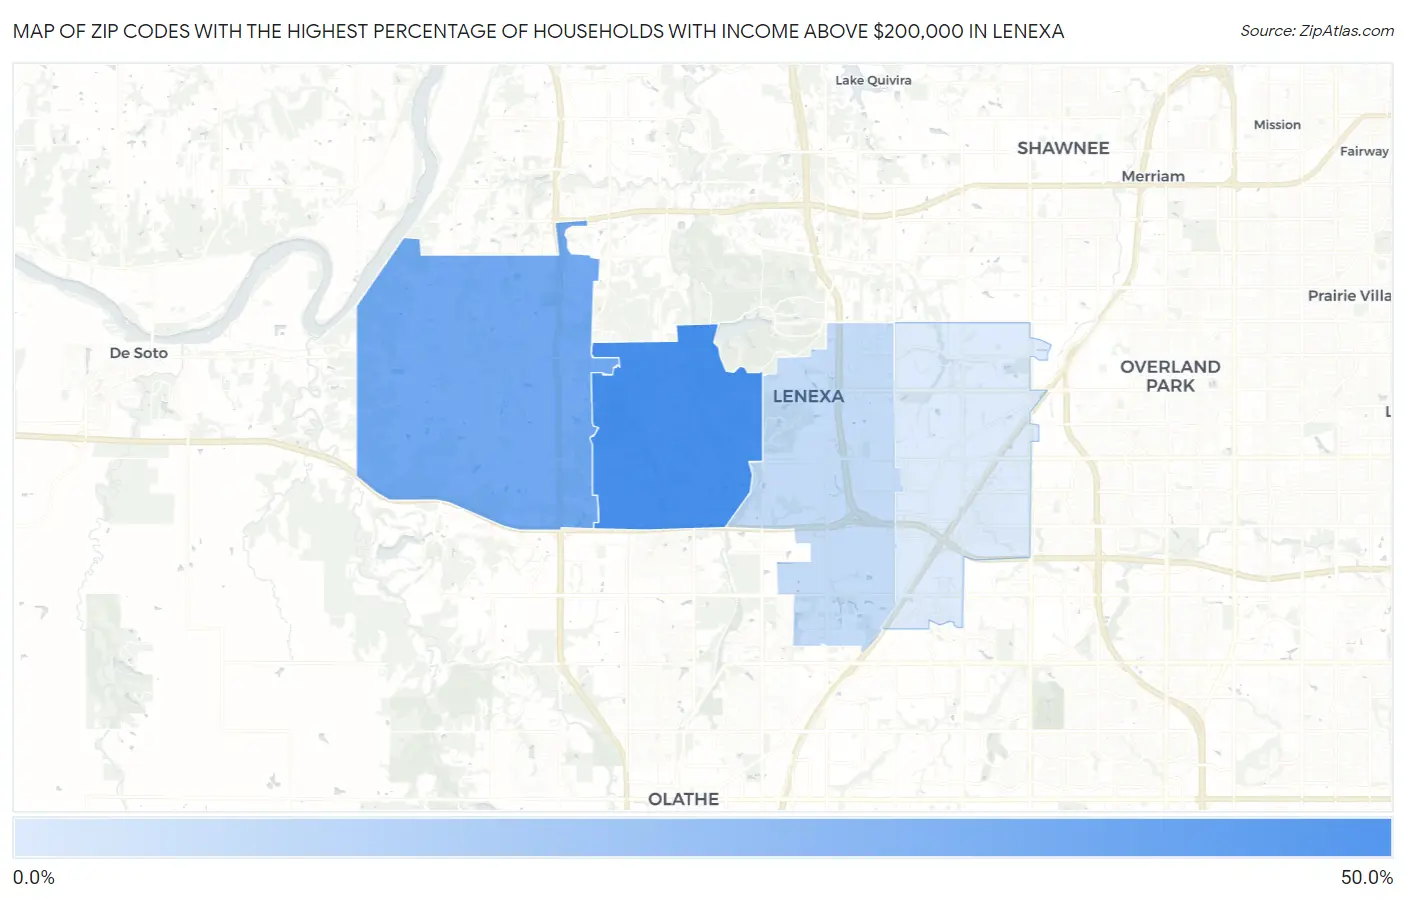
Map of Zip Codes with the Highest Percentage of Households with Income Above $200,000 in Lenexa
7.4%
40.7%
Zip Codes with the Highest Percentage of Households with Income Above $200,000 in Lenexa, KS
| Zip Code | Households with Income > $200k | vs State | vs National | |
| 1. | 66220 | 40.7% | 8.0%(+32.7)#4 | 11.4%(+29.3)#617 |
| 2. | 66227 | 30.4% | 8.0%(+22.4)#11 | 11.4%(+19.0)#1,411 |
| 3. | 66219 | 12.6% | 8.0%(+4.60)#61 | 11.4%(+1.20)#6,279 |
| 4. | 66215 | 7.4% | 8.0%(-0.600)#147 | 11.4%(-4.00)#11,196 |
1
Common Questions
What are the Top 3 Zip Codes with the Highest Percentage of Households with Income Above $200,000 in Lenexa, KS?
Top 3 Zip Codes with the Highest Percentage of Households with Income Above $200,000 in Lenexa, KS are:
What zip code has the Highest Percentage of Households with Income Above $200,000 in Lenexa, KS?
66220 has the Highest Percentage of Households with Income Above $200,000 in Lenexa, KS with 40.7%.
What is the Percentage of Households with Income Above $200,000 in Lenexa, KS?
Percentage of Households with Income Above $200,000 in Lenexa is 15.6%.
What is the Percentage of Households with Income Above $200,000 in Kansas?
Percentage of Households with Income Above $200,000 in Kansas is 8.0%.
What is the Percentage of Households with Income Above $200,000 in the United States?
Percentage of Households with Income Above $200,000 in the United States is 11.4%.