Zip Codes with the Highest Percentage of Local Government Employees in Lenexa, KS
RELATED REPORTS & OPTIONS
Local Government Employees
Lenexa
Compare Zip Codes
Map of Zip Codes with the Highest Percentage of Local Government Employees in Lenexa
4.9%
10.0%
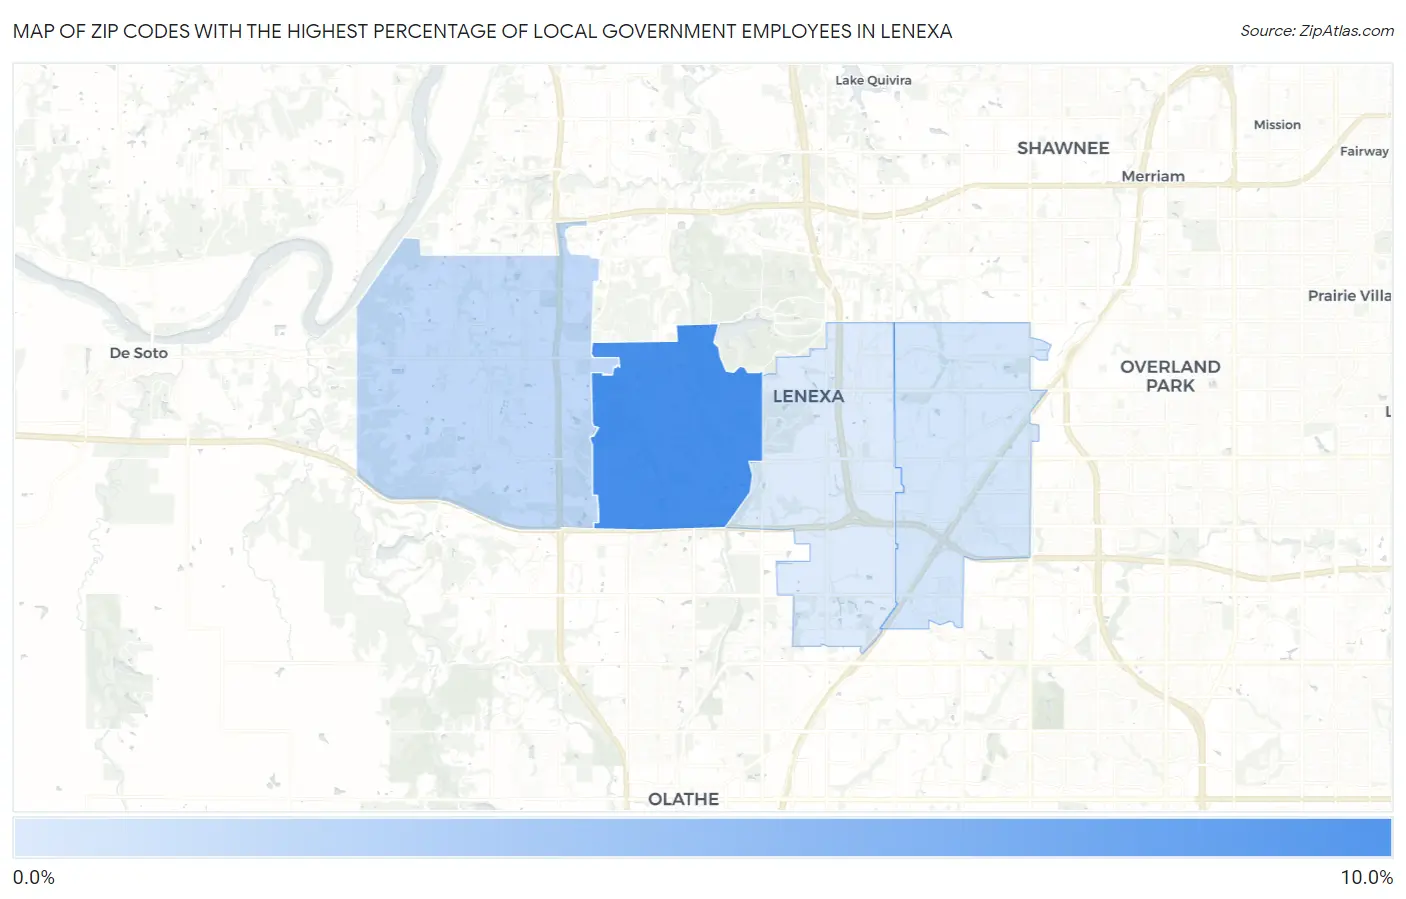
Zip Codes with the Highest Percentage of Local Government Employees in Lenexa, KS
| Zip Code | % Local Government Employees | vs State | vs National | |
| 1. | 66220 | 10.0% | 8.1%(+1.86)#319 | 7.2%(+2.77)#8,307 |
| 2. | 66227 | 5.9% | 8.1%(-2.23)#525 | 7.2%(-1.31)#20,065 |
| 3. | 66215 | 5.2% | 8.1%(-2.90)#565 | 7.2%(-1.98)#22,295 |
| 4. | 66219 | 4.9% | 8.1%(-3.23)#579 | 7.2%(-2.31)#23,306 |
1
Common Questions
What are the Top 3 Zip Codes with the Highest Percentage of Local Government Employees in Lenexa, KS?
Top 3 Zip Codes with the Highest Percentage of Local Government Employees in Lenexa, KS are:
What zip code has the Highest Percentage of Local Government Employees in Lenexa, KS?
66220 has the Highest Percentage of Local Government Employees in Lenexa, KS with 10.0%.
What is the Percentage of Local Government Employees in Lenexa, KS?
Percentage of Local Government Employees in Lenexa is 5.9%.
What is the Percentage of Local Government Employees in Kansas?
Percentage of Local Government Employees in Kansas is 8.1%.
What is the Percentage of Local Government Employees in the United States?
Percentage of Local Government Employees in the United States is 7.2%.