Zip Codes with the Highest Percentage of Population with a Degree in Physical and Health Sciences in Lenexa, KS
RELATED REPORTS & OPTIONS
Physical and Health Sciences
Lenexa
Compare Zip Codes
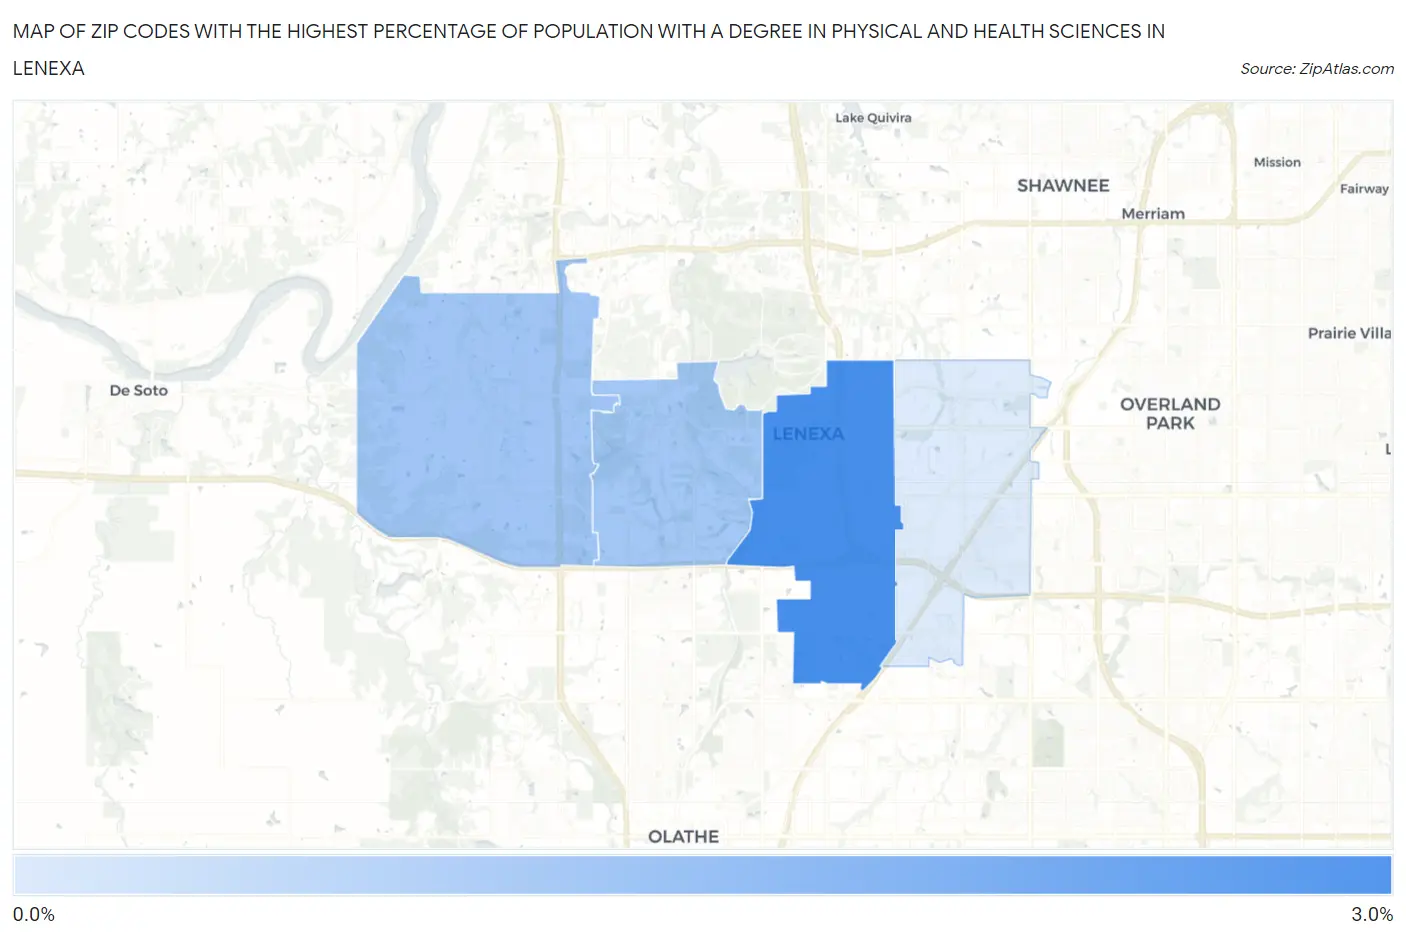
Map of Zip Codes with the Highest Percentage of Population with a Degree in Physical and Health Sciences in Lenexa
0.71%
3.0%
Zip Codes with the Highest Percentage of Population with a Degree in Physical and Health Sciences in Lenexa, KS
| Zip Code | % Graduates | vs State | vs National | |
| 1. | 66219 | 3.0% | 2.5%(+0.425)#171 | 3.1%(-0.126)#10,540 |
| 2. | 66227 | 1.6% | 2.5%(-0.939)#267 | 3.1%(-1.49)#16,828 |
| 3. | 66220 | 1.6% | 2.5%(-0.966)#268 | 3.1%(-1.52)#16,945 |
| 4. | 66215 | 0.71% | 2.5%(-1.84)#344 | 3.1%(-2.39)#20,117 |
1
Common Questions
What are the Top 3 Zip Codes with the Highest Percentage of Population with a Degree in Physical and Health Sciences in Lenexa, KS?
Top 3 Zip Codes with the Highest Percentage of Population with a Degree in Physical and Health Sciences in Lenexa, KS are:
What zip code has the Highest Percentage of Population with a Degree in Physical and Health Sciences in Lenexa, KS?
66219 has the Highest Percentage of Population with a Degree in Physical and Health Sciences in Lenexa, KS with 3.0%.
What is the Percentage of Population with a Degree in Physical and Health Sciences in Lenexa, KS?
Percentage of Population with a Degree in Physical and Health Sciences in Lenexa is 1.7%.
What is the Percentage of Population with a Degree in Physical and Health Sciences in Kansas?
Percentage of Population with a Degree in Physical and Health Sciences in Kansas is 2.5%.
What is the Percentage of Population with a Degree in Physical and Health Sciences in the United States?
Percentage of Population with a Degree in Physical and Health Sciences in the United States is 3.1%.