Zip Codes with the Highest Percentage of Households Heated without Fuel in Lenexa, KS
RELATED REPORTS & OPTIONS
Fuel-less Heating
Lenexa
Compare Zip Codes
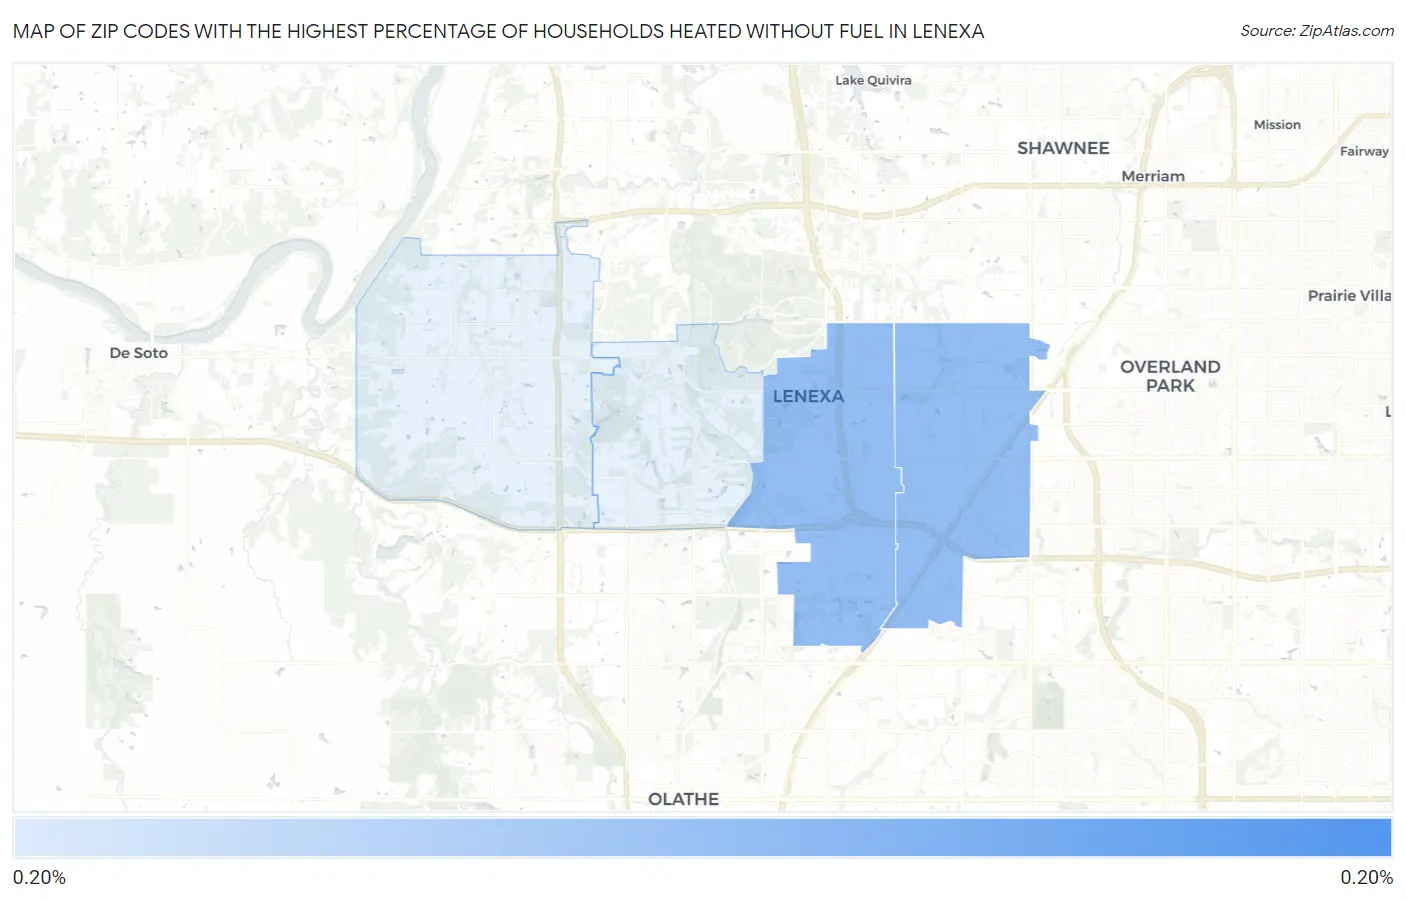
Map of Zip Codes with the Highest Percentage of Households Heated without Fuel in Lenexa
0.20%
0.20%
Zip Codes with the Highest Percentage of Households Heated without Fuel in Lenexa, KS
| Zip Code | Fuel-less Heating | vs State | vs National | |
| 1. | 66215 | 0.20% | 0.30%(-0.100)#128 | 1.2%(-1.000)#13,421 |
| 2. | 66219 | 0.20% | 0.30%(-0.100)#135 | 1.2%(-1.000)#13,773 |
1
Common Questions
What are the Top 3 Zip Codes with the Highest Percentage of Households Heated without Fuel in Lenexa, KS?
Top 3 Zip Codes with the Highest Percentage of Households Heated without Fuel in Lenexa, KS are:
What zip code has the Highest Percentage of Households Heated without Fuel in Lenexa, KS?
66215 has the Highest Percentage of Households Heated without Fuel in Lenexa, KS with 0.20%.
What is the Percentage of Households Heated without Fuel in Lenexa, KS?
Percentage of Households Heated without Fuel in Lenexa is 0.20%.
What is the Percentage of Households Heated without Fuel in Kansas?
Percentage of Households Heated without Fuel in Kansas is 0.30%.
What is the Percentage of Households Heated without Fuel in the United States?
Percentage of Households Heated without Fuel in the United States is 1.2%.