Zip Codes with the Highest Percentage of Population with a Degree in Science and Engineering in Lenexa, KS
RELATED REPORTS & OPTIONS
Science and Engineering
Lenexa
Compare Zip Codes
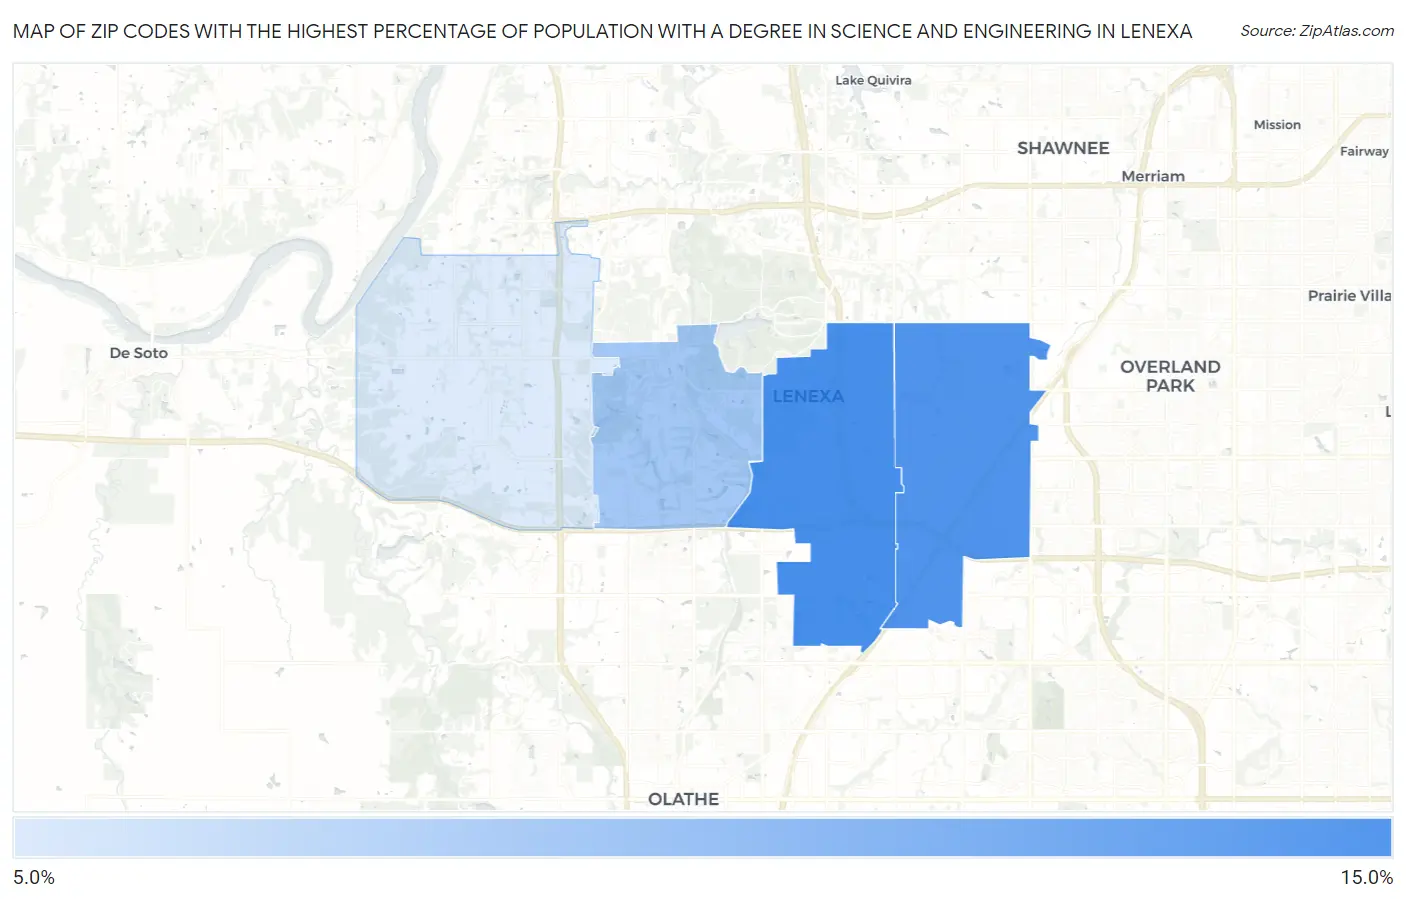
Map of Zip Codes with the Highest Percentage of Population with a Degree in Science and Engineering in Lenexa
5.0%
11.7%
Zip Codes with the Highest Percentage of Population with a Degree in Science and Engineering in Lenexa, KS
| Zip Code | % Graduates | vs State | vs National | |
| 1. | 66219 | 11.7% | 11.1%(+0.550)#279 | 9.8%(+1.90)#11,504 |
| 2. | 66215 | 11.3% | 11.1%(+0.149)#291 | 9.8%(+1.50)#12,287 |
| 3. | 66220 | 7.5% | 11.1%(-3.58)#429 | 9.8%(-2.23)#20,623 |
| 4. | 66227 | 5.0% | 11.1%(-6.09)#495 | 9.8%(-4.75)#24,696 |
1
Common Questions
What are the Top 3 Zip Codes with the Highest Percentage of Population with a Degree in Science and Engineering in Lenexa, KS?
Top 3 Zip Codes with the Highest Percentage of Population with a Degree in Science and Engineering in Lenexa, KS are:
What zip code has the Highest Percentage of Population with a Degree in Science and Engineering in Lenexa, KS?
66219 has the Highest Percentage of Population with a Degree in Science and Engineering in Lenexa, KS with 11.7%.
What is the Percentage of Population with a Degree in Science and Engineering in Lenexa, KS?
Percentage of Population with a Degree in Science and Engineering in Lenexa is 10.1%.
What is the Percentage of Population with a Degree in Science and Engineering in Kansas?
Percentage of Population with a Degree in Science and Engineering in Kansas is 11.1%.
What is the Percentage of Population with a Degree in Science and Engineering in the United States?
Percentage of Population with a Degree in Science and Engineering in the United States is 9.8%.