Zip Codes with the Highest Percentage of Population Employed in Manufacturing in Lenexa, KS
RELATED REPORTS & OPTIONS
Manufacturing
Lenexa
Compare Zip Codes
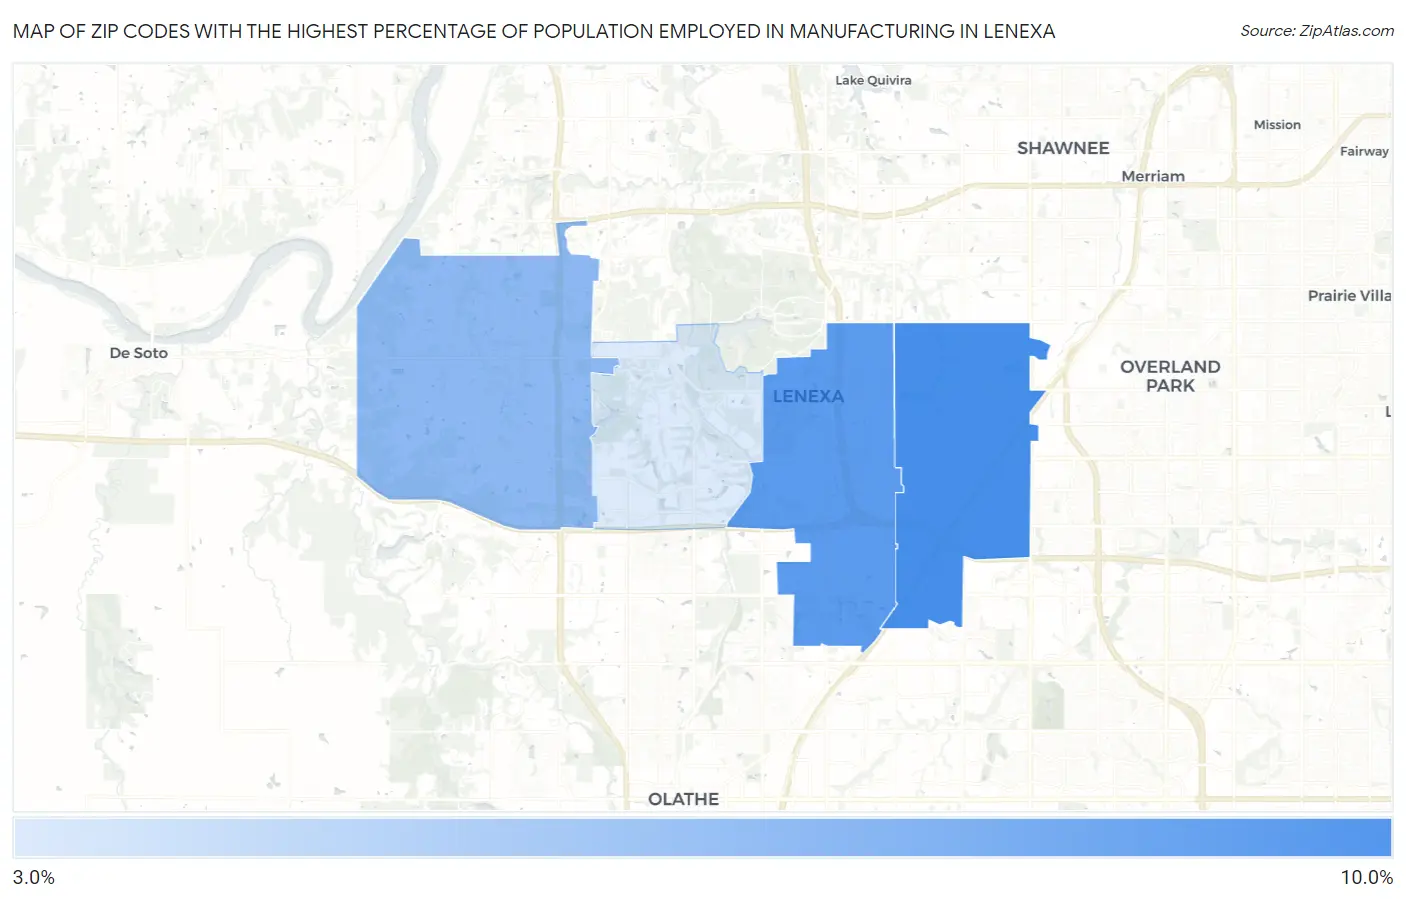
Map of Zip Codes with the Highest Percentage of Population Employed in Manufacturing in Lenexa
3.8%
8.7%
Zip Codes with the Highest Percentage of Population Employed in Manufacturing in Lenexa, KS
| Zip Code | % Employed | vs State | vs National | |
| 1. | 66215 | 8.7% | 12.4%(-3.69)#410 | 10.0%(-1.27)#17,897 |
| 2. | 66219 | 8.1% | 12.4%(-4.28)#434 | 10.0%(-1.86)#18,928 |
| 3. | 66227 | 6.4% | 12.4%(-5.97)#492 | 10.0%(-3.55)#21,963 |
| 4. | 66220 | 3.8% | 12.4%(-8.62)#580 | 10.0%(-6.20)#26,353 |
1
Common Questions
What are the Top 3 Zip Codes with the Highest Percentage of Population Employed in Manufacturing in Lenexa, KS?
Top 3 Zip Codes with the Highest Percentage of Population Employed in Manufacturing in Lenexa, KS are:
What zip code has the Highest Percentage of Population Employed in Manufacturing in Lenexa, KS?
66215 has the Highest Percentage of Population Employed in Manufacturing in Lenexa, KS with 8.7%.
What is the Percentage of Population Employed in Manufacturing in Lenexa, KS?
Percentage of Population Employed in Manufacturing in Lenexa is 7.4%.
What is the Percentage of Population Employed in Manufacturing in Kansas?
Percentage of Population Employed in Manufacturing in Kansas is 12.4%.
What is the Percentage of Population Employed in Manufacturing in the United States?
Percentage of Population Employed in Manufacturing in the United States is 10.0%.