Zip Codes with the Highest Percentage of Population Employed in Farming, Fishing & Forestry in Springfield, IL
RELATED REPORTS & OPTIONS
Farming, Fishing & Forestry
Springfield
Compare Zip Codes
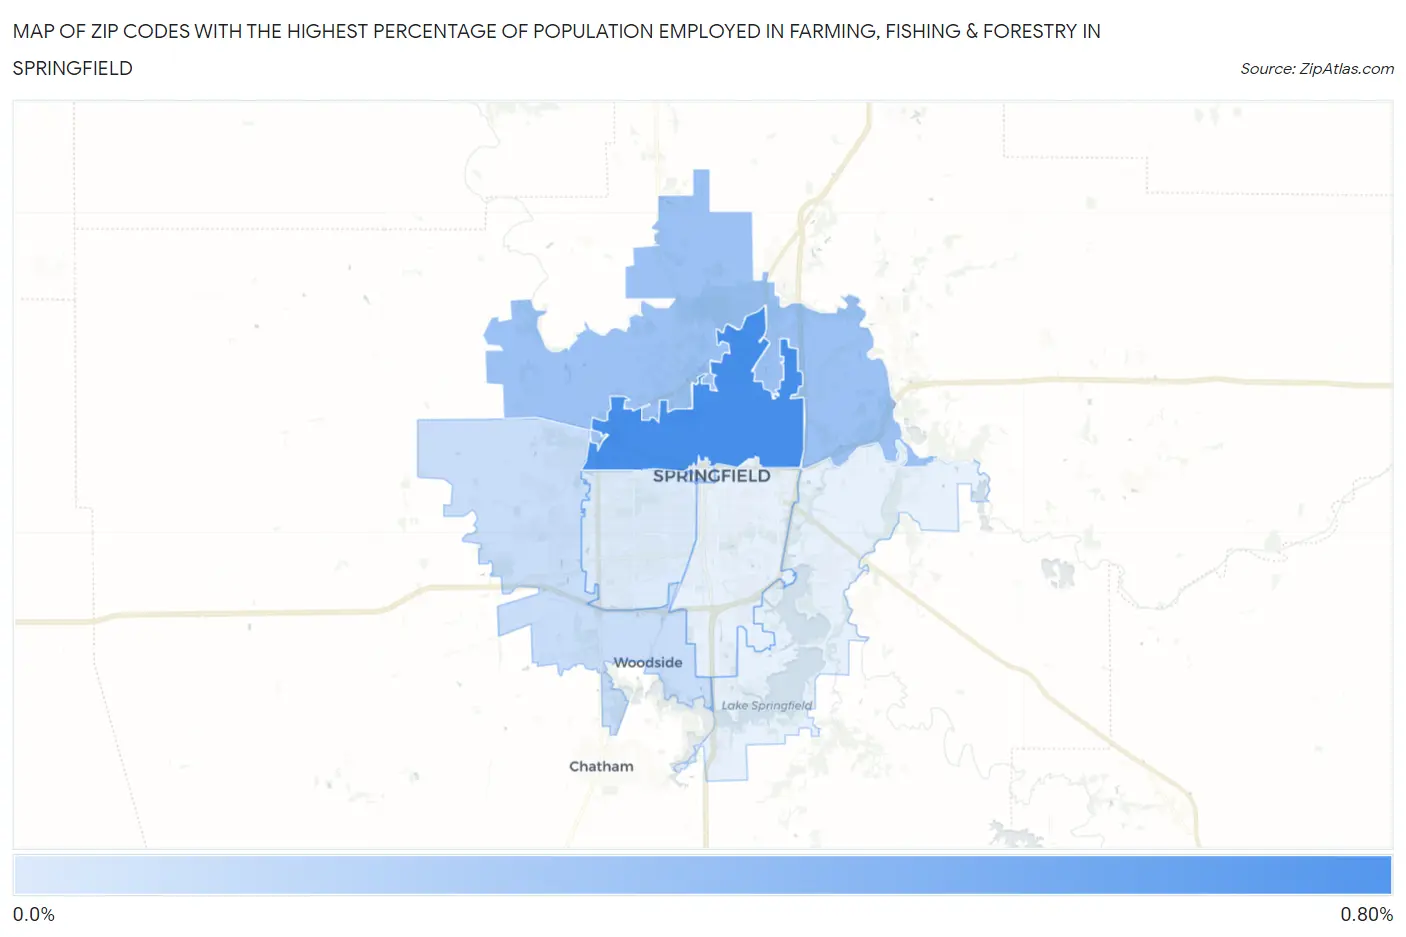
Map of Zip Codes with the Highest Percentage of Population Employed in Farming, Fishing & Forestry in Springfield
0.015%
0.62%
Zip Codes with the Highest Percentage of Population Employed in Farming, Fishing & Forestry in Springfield, IL
| Zip Code | % Employed | vs State | vs National | |
| 1. | 62702 | 0.62% | 0.31%(+0.311)#528 | 0.61%(+0.016)#11,881 |
| 2. | 62707 | 0.28% | 0.31%(-0.027)#658 | 0.61%(-0.322)#15,029 |
| 3. | 62711 | 0.10% | 0.31%(-0.210)#776 | 0.61%(-0.505)#17,746 |
| 4. | 62704 | 0.015% | 0.31%(-0.296)#829 | 0.61%(-0.591)#19,120 |
1
Common Questions
What are the Top 5 Zip Codes with the Highest Percentage of Population Employed in Farming, Fishing & Forestry in Springfield, IL?
Top 5 Zip Codes with the Highest Percentage of Population Employed in Farming, Fishing & Forestry in Springfield, IL are:
What zip code has the Highest Percentage of Population Employed in Farming, Fishing & Forestry in Springfield, IL?
62702 has the Highest Percentage of Population Employed in Farming, Fishing & Forestry in Springfield, IL with 0.62%.
What is the Percentage of Population Employed in Farming, Fishing & Forestry in Springfield, IL?
Percentage of Population Employed in Farming, Fishing & Forestry in Springfield is 0.13%.
What is the Percentage of Population Employed in Farming, Fishing & Forestry in Illinois?
Percentage of Population Employed in Farming, Fishing & Forestry in Illinois is 0.31%.
What is the Percentage of Population Employed in Farming, Fishing & Forestry in the United States?
Percentage of Population Employed in Farming, Fishing & Forestry in the United States is 0.61%.