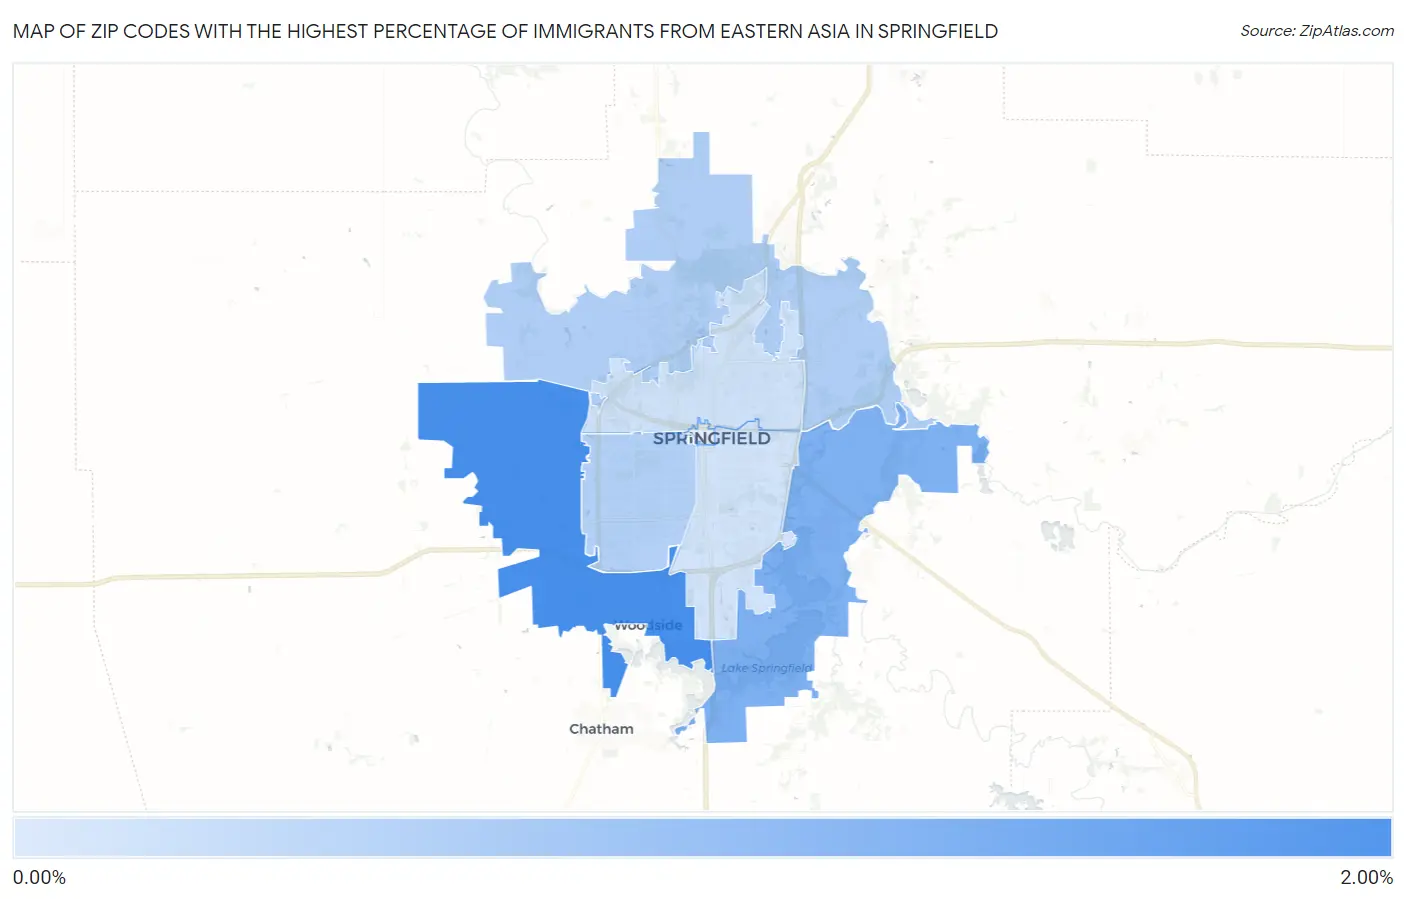
Zip Codes with the Highest Percentage of Immigrants from Eastern Asia in Springfield, IL
RELATED REPORTS & OPTIONS
Eastern Asia
Springfield
Compare Zip Codes
Map of Zip Codes with the Highest Percentage of Immigrants from Eastern Asia in Springfield
0.12%
1.69%

Zip Codes with the Highest Percentage of Immigrants from Eastern Asia in Springfield, IL
| Zip Code | Eastern Asia | vs State | vs National | |
| 1. | 62711 | 1.69% | 1.12%(+0.567)#93 | 1.28%(+0.414)#2,381 |
| 2. | 62712 | 1.06% | 1.12%(-0.062)#128 | 1.28%(-0.215)#3,703 |
| 3. | 62707 | 0.50% | 1.12%(-0.618)#214 | 1.28%(-0.771)#6,546 |
| 4. | 62704 | 0.47% | 1.12%(-0.651)#231 | 1.28%(-0.804)#6,853 |
| 5. | 62702 | 0.17% | 1.12%(-0.957)#423 | 1.28%(-1.11)#10,900 |
| 6. | 62703 | 0.12% | 1.12%(-0.998)#451 | 1.28%(-1.15)#11,656 |
1
Common Questions
What are the Top 5 Zip Codes with the Highest Percentage of Immigrants from Eastern Asia in Springfield, IL?
Top 5 Zip Codes with the Highest Percentage of Immigrants from Eastern Asia in Springfield, IL are:
What zip code has the Highest Percentage of Immigrants from Eastern Asia in Springfield, IL?
62711 has the Highest Percentage of Immigrants from Eastern Asia in Springfield, IL with 1.69%.
What is the Percentage of Immigrants from Eastern Asia in Springfield, IL?
Percentage of Immigrants from Eastern Asia in Springfield is 0.57%.
What is the Percentage of Immigrants from Eastern Asia in Illinois?
Percentage of Immigrants from Eastern Asia in Illinois is 1.12%.
What is the Percentage of Immigrants from Eastern Asia in the United States?
Percentage of Immigrants from Eastern Asia in the United States is 1.28%.