Zip Codes with the Highest Percentage of Immigrants from Asia in Springfield, IL
RELATED REPORTS & OPTIONS
Asia
Springfield
Compare Zip Codes
Map of Zip Codes with the Highest Percentage of Immigrants from Asia in Springfield
0.71%
10.20%
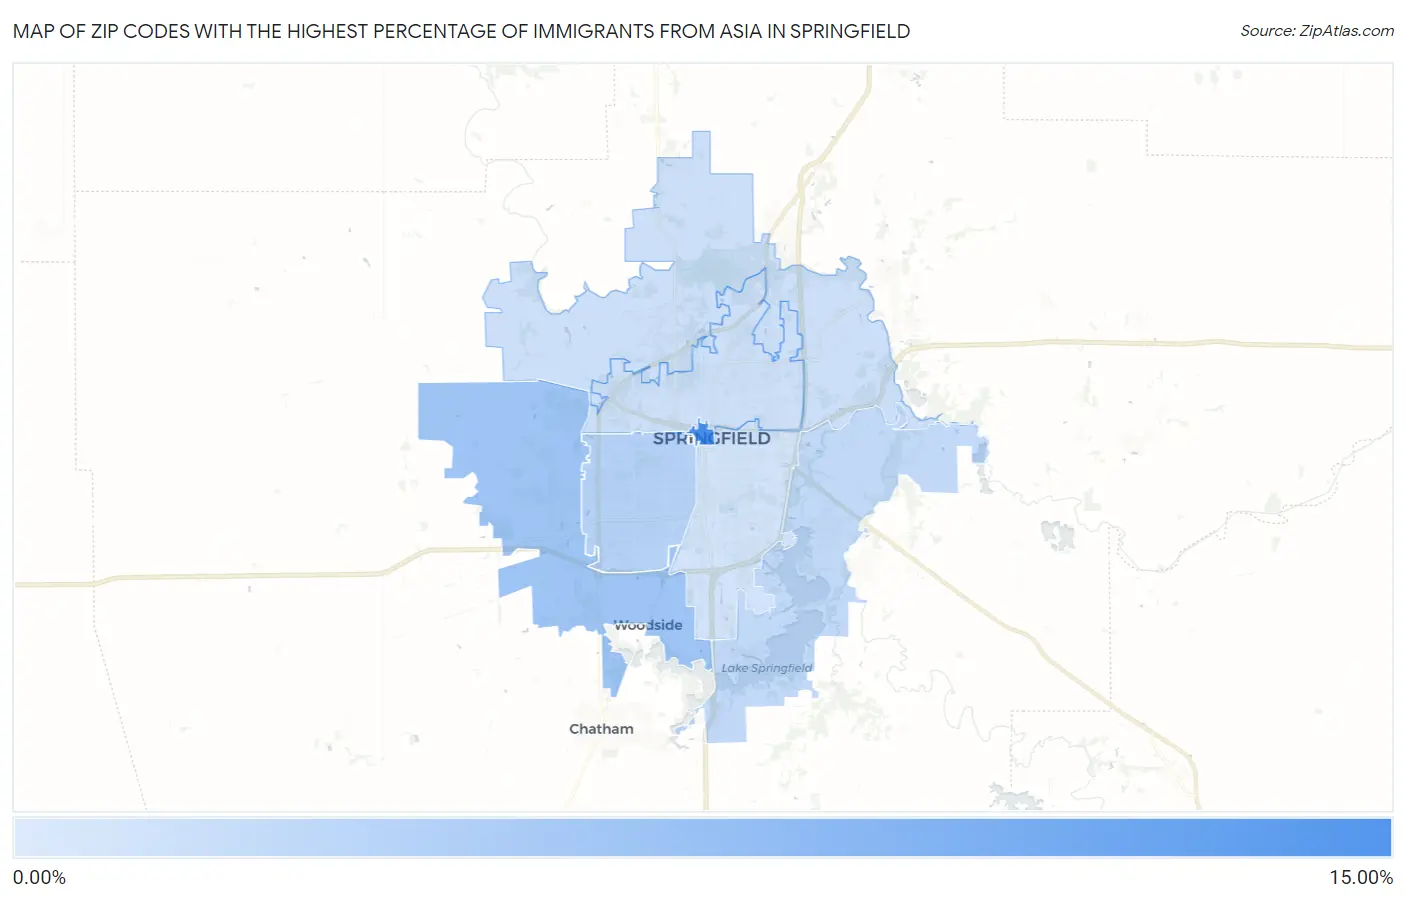
Zip Codes with the Highest Percentage of Immigrants from Asia in Springfield, IL
| Zip Code | Asia | vs State | vs National | |
| 1. | 62701 | 10.20% | 4.39% (+5.81)#64 | 4.26% (+5.94)#1,259 |
| 2. | 62711 | 4.09% | 4.39% (-0.304)#156 | 4.26% (-0.172)#3,704 |
| 3. | 62704 | 2.60% | 4.39% (-1.79)#223 | 4.26% (-1.66)#5,549 |
| 4. | 62712 | 1.81% | 4.39% (-2.58)#277 | 4.26% (-2.45)#7,311 |
| 5. | 62707 | 1.10% | 4.39% (-3.29)#342 | 4.26% (-3.16)#9,828 |
| 6. | 62702 | 1.01% | 4.39% (-3.38)#363 | 4.26% (-3.25)#10,269 |
| 7. | 62703 | 0.71% | 4.39% (-3.68)#434 | 4.26% (-3.55)#12,128 |
1
Common Questions
What are the Top 5 Zip Codes with the Highest Percentage of Immigrants from Asia in Springfield, IL?
Top 5 Zip Codes with the Highest Percentage of Immigrants from Asia in Springfield, IL are:
What zip code has the Highest Percentage of Immigrants from Asia in Springfield, IL?
62701 has the Highest Percentage of Immigrants from Asia in Springfield, IL with 10.20%.
What is the Percentage of Immigrants from Asia in Springfield, IL?
Percentage of Immigrants from Asia in Springfield is 2.11%.
What is the Percentage of Immigrants from Asia in Illinois?
Percentage of Immigrants from Asia in Illinois is 4.39%.
What is the Percentage of Immigrants from Asia in the United States?
Percentage of Immigrants from Asia in the United States is 4.26%.