Zip Codes with the Highest Percentage of Population with a Degree in Science and Engineering in Evanston, IL
RELATED REPORTS & OPTIONS
Science and Engineering
Evanston
Compare Zip Codes
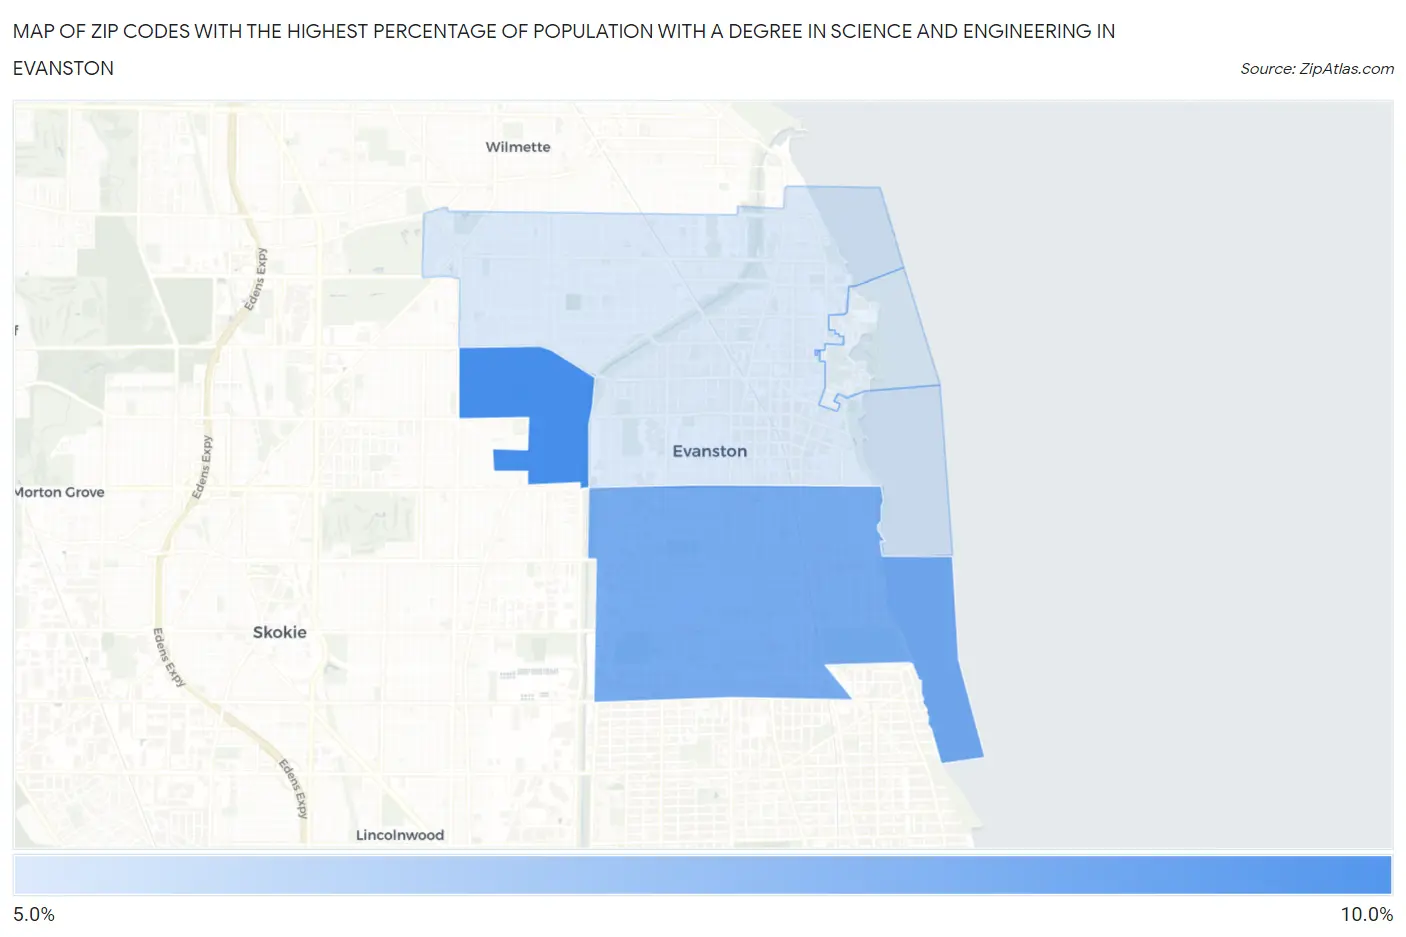
Map of Zip Codes with the Highest Percentage of Population with a Degree in Science and Engineering in Evanston
5.3%
8.3%
Zip Codes with the Highest Percentage of Population with a Degree in Science and Engineering in Evanston, IL
| Zip Code | % Graduates | vs State | vs National | |
| 1. | 60203 | 8.3% | 9.8%(-1.50)#887 | 9.8%(-1.44)#18,828 |
| 2. | 60202 | 7.3% | 9.8%(-2.50)#975 | 9.8%(-2.44)#21,064 |
| 3. | 60201 | 5.3% | 9.8%(-4.58)#1,096 | 9.8%(-4.52)#24,392 |
1
Common Questions
What are the Top 3 Zip Codes with the Highest Percentage of Population with a Degree in Science and Engineering in Evanston, IL?
Top 3 Zip Codes with the Highest Percentage of Population with a Degree in Science and Engineering in Evanston, IL are:
What zip code has the Highest Percentage of Population with a Degree in Science and Engineering in Evanston, IL?
60203 has the Highest Percentage of Population with a Degree in Science and Engineering in Evanston, IL with 8.3%.
What is the Percentage of Population with a Degree in Science and Engineering in Evanston, IL?
Percentage of Population with a Degree in Science and Engineering in Evanston is 6.2%.
What is the Percentage of Population with a Degree in Science and Engineering in Illinois?
Percentage of Population with a Degree in Science and Engineering in Illinois is 9.8%.
What is the Percentage of Population with a Degree in Science and Engineering in the United States?
Percentage of Population with a Degree in Science and Engineering in the United States is 9.8%.