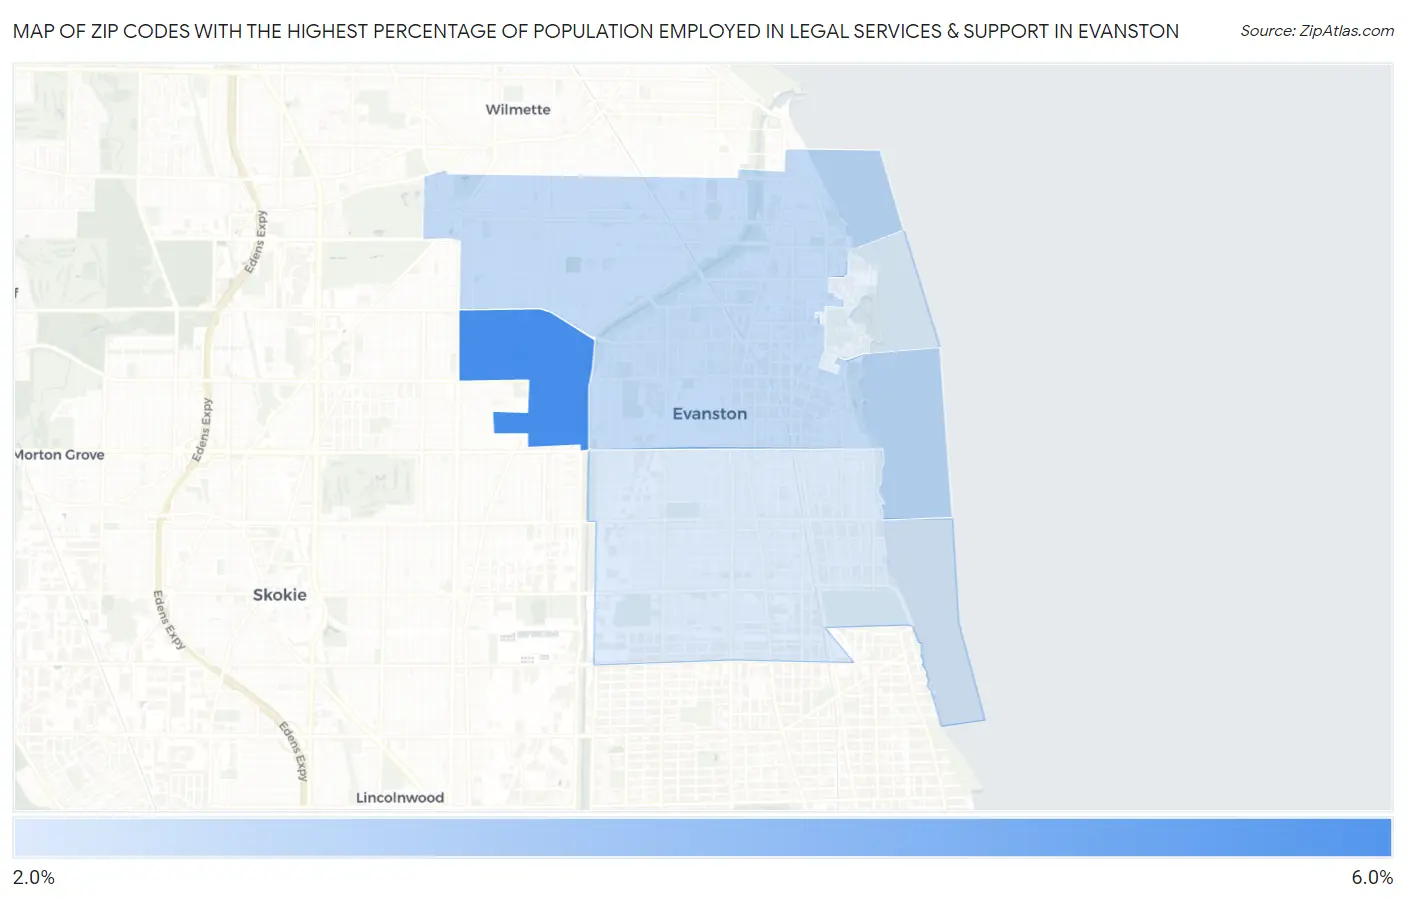
Zip Codes with the Highest Percentage of Population Employed in Legal Services & Support in Evanston, IL
RELATED REPORTS & OPTIONS
Legal Services & Support
Evanston
Compare Zip Codes
Map of Zip Codes with the Highest Percentage of Population Employed in Legal Services & Support in Evanston
2.7%
5.7%
Zip Codes with the Highest Percentage of Population Employed in Legal Services & Support in Evanston, IL
| Zip Code | % Employed | vs State | vs National | |
| 1. | 60203 | 5.7% | 1.3%(+4.36)#25 | 1.2%(+4.53)#555 |
| 2. | 60201 | 3.2% | 1.3%(+1.81)#61 | 1.2%(+1.98)#1,687 |
| 3. | 60202 | 2.7% | 1.3%(+1.32)#83 | 1.2%(+1.48)#2,253 |
1
Common Questions
What are the Top 3 Zip Codes with the Highest Percentage of Population Employed in Legal Services & Support in Evanston, IL?
Top 3 Zip Codes with the Highest Percentage of Population Employed in Legal Services & Support in Evanston, IL are:
What zip code has the Highest Percentage of Population Employed in Legal Services & Support in Evanston, IL?
60203 has the Highest Percentage of Population Employed in Legal Services & Support in Evanston, IL with 5.7%.
What is the Percentage of Population Employed in Legal Services & Support in Evanston, IL?
Percentage of Population Employed in Legal Services & Support in Evanston is 2.9%.
What is the Percentage of Population Employed in Legal Services & Support in Illinois?
Percentage of Population Employed in Legal Services & Support in Illinois is 1.3%.
What is the Percentage of Population Employed in Legal Services & Support in the United States?
Percentage of Population Employed in Legal Services & Support in the United States is 1.2%.