Zip Codes with the Highest Percentage of Population with a Degree in Visual and Performing Arts in Evanston, IL
RELATED REPORTS & OPTIONS
Visual and Performing Arts
Evanston
Compare Zip Codes
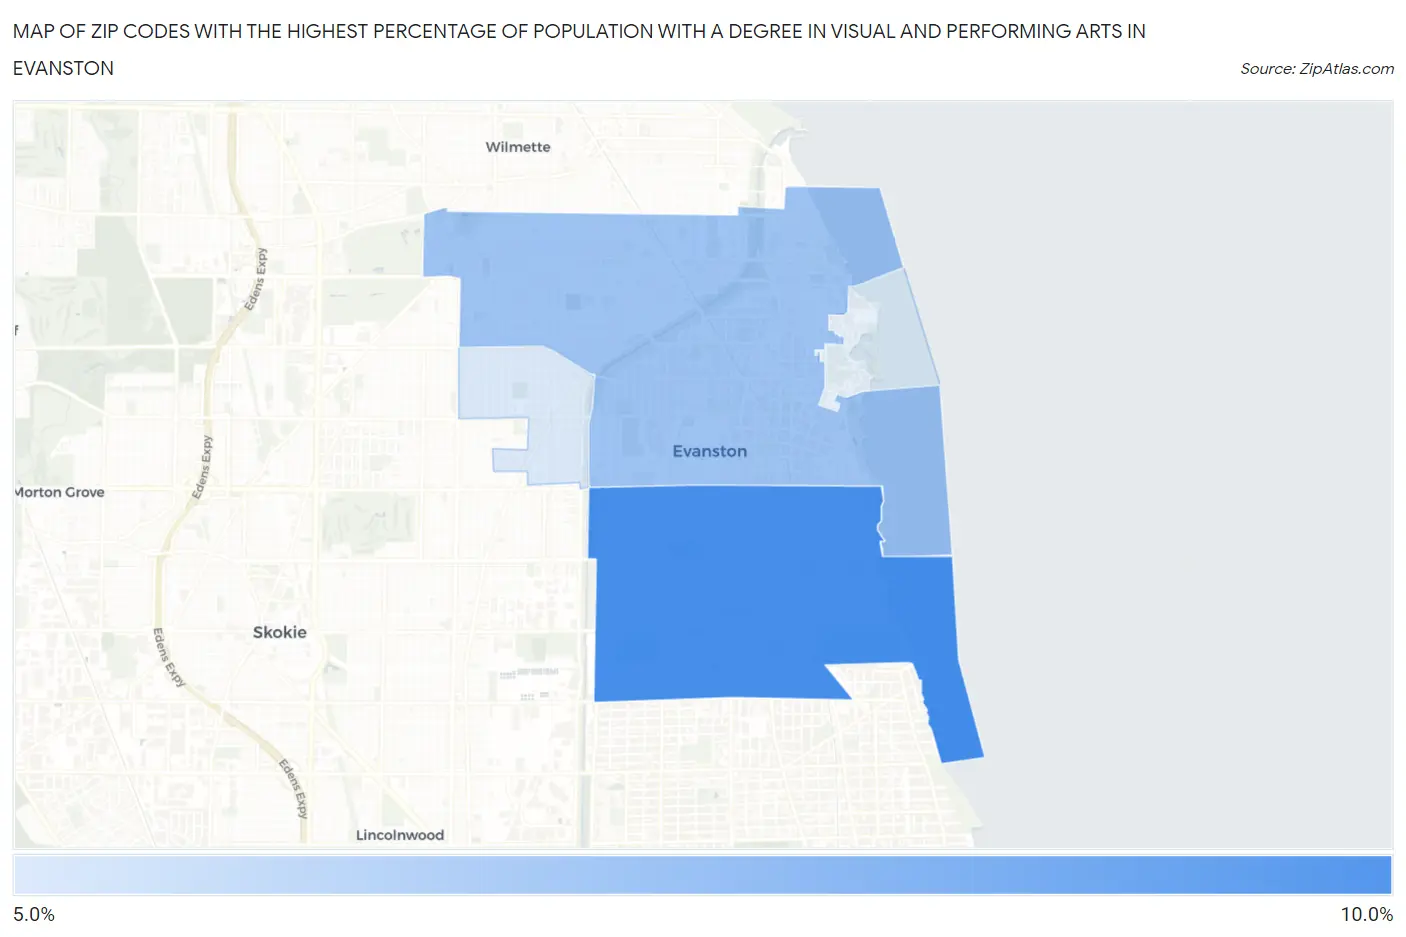
Map of Zip Codes with the Highest Percentage of Population with a Degree in Visual and Performing Arts in Evanston
5.6%
8.5%
Zip Codes with the Highest Percentage of Population with a Degree in Visual and Performing Arts in Evanston, IL
| Zip Code | % Graduates | vs State | vs National | |
| 1. | 60202 | 8.5% | 4.4%(+4.09)#93 | 4.3%(+4.29)#2,501 |
| 2. | 60201 | 6.8% | 4.4%(+2.39)#149 | 4.3%(+2.58)#3,843 |
| 3. | 60203 | 5.6% | 4.4%(+1.19)#212 | 4.3%(+1.38)#5,430 |
1
Common Questions
What are the Top 3 Zip Codes with the Highest Percentage of Population with a Degree in Visual and Performing Arts in Evanston, IL?
Top 3 Zip Codes with the Highest Percentage of Population with a Degree in Visual and Performing Arts in Evanston, IL are:
What zip code has the Highest Percentage of Population with a Degree in Visual and Performing Arts in Evanston, IL?
60202 has the Highest Percentage of Population with a Degree in Visual and Performing Arts in Evanston, IL with 8.5%.
What is the Percentage of Population with a Degree in Visual and Performing Arts in Evanston, IL?
Percentage of Population with a Degree in Visual and Performing Arts in Evanston is 7.6%.
What is the Percentage of Population with a Degree in Visual and Performing Arts in Illinois?
Percentage of Population with a Degree in Visual and Performing Arts in Illinois is 4.4%.
What is the Percentage of Population with a Degree in Visual and Performing Arts in the United States?
Percentage of Population with a Degree in Visual and Performing Arts in the United States is 4.3%.