Zip Codes with the Highest Percentage of Population Employed in Community & Social Service in Evanston, IL
RELATED REPORTS & OPTIONS
Community & Social Service
Evanston
Compare Zip Codes
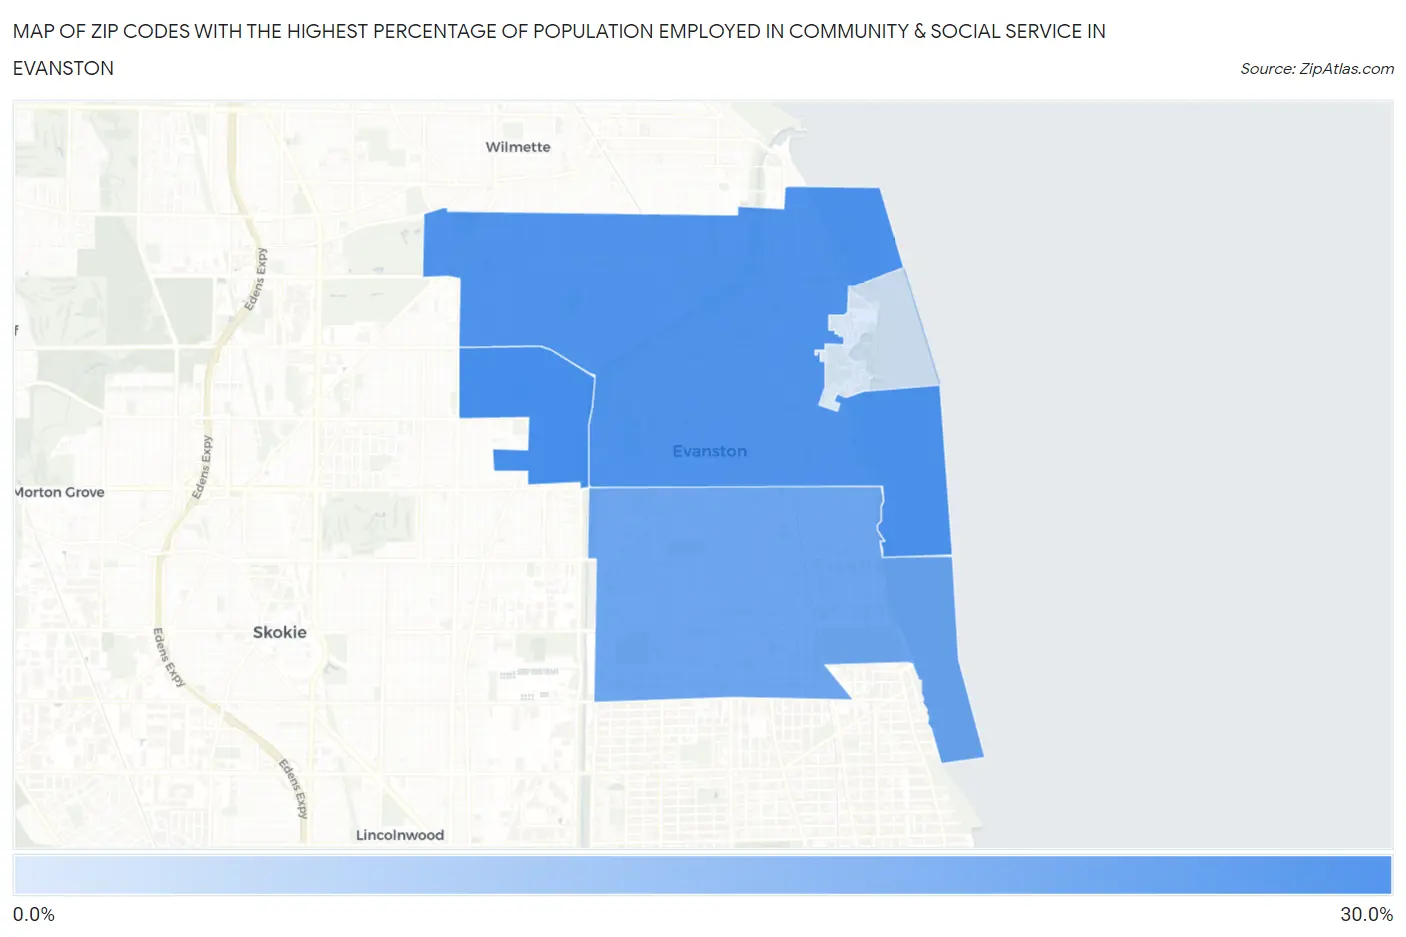
Map of Zip Codes with the Highest Percentage of Population Employed in Community & Social Service in Evanston
8.3%
26.6%
Zip Codes with the Highest Percentage of Population Employed in Community & Social Service in Evanston, IL
| Zip Code | % Employed | vs State | vs National | |
| 1. | 60203 | 26.6% | 11.3%(+15.3)#15 | 11.2%(+15.4)#816 |
| 2. | 60201 | 25.5% | 11.3%(+14.2)#18 | 11.2%(+14.3)#916 |
| 3. | 60202 | 21.6% | 11.3%(+10.3)#37 | 11.2%(+10.3)#1,578 |
| 4. | 60208 | 8.3% | 11.3%(-2.95)#713 | 11.2%(-2.88)#18,680 |
1
Common Questions
What are the Top 3 Zip Codes with the Highest Percentage of Population Employed in Community & Social Service in Evanston, IL?
Top 3 Zip Codes with the Highest Percentage of Population Employed in Community & Social Service in Evanston, IL are:
What zip code has the Highest Percentage of Population Employed in Community & Social Service in Evanston, IL?
60203 has the Highest Percentage of Population Employed in Community & Social Service in Evanston, IL with 26.6%.
What is the Percentage of Population Employed in Community & Social Service in Evanston, IL?
Percentage of Population Employed in Community & Social Service in Evanston is 23.5%.
What is the Percentage of Population Employed in Community & Social Service in Illinois?
Percentage of Population Employed in Community & Social Service in Illinois is 11.3%.
What is the Percentage of Population Employed in Community & Social Service in the United States?
Percentage of Population Employed in Community & Social Service in the United States is 11.2%.